St Helens North (UK Parliament constituency)
Coordinates: 53°29′10″N 2°42′50″W / 53.486°N 2.714°W

| St. Helens North | |
|---|---|
| Borough constituency for the House of Commons | |
 Boundary of St. Helens North in Merseyside | |
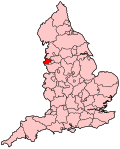 Location of Merseyside within England | |
| County | Merseyside |
| Electorate | 75,688 (December 2010)[1] |
| Major settlements | St Helens, Billinge, Earlestown, Haydock, Newton-le-Willows and Rainford |
| Current constituency | |
| Created | 1983 |
| Member of Parliament | Conor McGinn (Labour) |
| Number of members | One |
| Created from | St Helens, Newton, Ince, Ormskirk and Huyton[2] |
St. Helens North is a constituency[n 1] created in 1983 represented in the House of Commons of the UK Parliament since 2015 by the Labour Party's Conor McGinn. Between 1997 and 2015 the MP was Labour's David Watts.[n 2]
Boundaries[]

1983–2010: The Metropolitan Borough of St Helens wards of Billinge and Seneley Green, Blackbrook, Broad Oak, Haydock, Moss Bank, Newton East, Newton West, Rainford, and Windle.
2010–present: As above, less Broad Oak, plus Earlestown; Newton replaced Newton East and West wards.
The constituency is one of two covering the Metropolitan Borough, the other being St Helens South and Whiston. It includes the north of the town of St Helens, and Billinge, Seneley Green, Earlestown, Blackbrook, Haydock, Newton-le-Willows and Rainford.
History[]
- Results of the winning party
The 2015 result made the seat the 42nd-safest of Labour's 232 seats by percentage of majority.[3] The constituency was created in 1983, primarily replacing parts of the St Helens and Newton constituencies. It has been won to date by candidates fielded by the Labour Party — by the former Newton MP John Evans and from 1997 by David Watts, a former council leader. As to the predominantly-contributing two seats to the present division, St Helens has been won by the party since 1935 and so too Newton. The party's two successive candidates for MP have won an absolute majority (plurality) of the votes since 1987 (inclusive).
- Opposition parties
The Conservative Party fielded the runner-up candidate in 2010 and 2015. Neither the Liberal Democrats nor the Green candidate won 5% of the vote in 2015 to retain their deposits. The third place in 2015 was taken by the UKIP candidate, Smith, who narrowly gained more than the national average swing through a swing of 10.4%.[n 3]
- Turnout
Turnout has ranged from 77.4% in 1992 to 52.7% in 2001.
Constituency profile[]
The seat includes the large town of St Helens, noted by visitors for its successful rugby league side and the nearby horseracing racecourse at Haydock Park. Despite these prominent sports venues, workless claimants, registered jobseekers, were in November 2012 higher than the national average of 3.8%, at 4.7% of the population based on a statistical compilation by The Guardian, which was close to the Greater Manchester and Merseyside average but higher than the regional average of 4.4%.[4] With the exception of the Conservative area of Rainford, virtually every other ward in the seat is safely Labour.
Members of Parliament[]
| Election | Member[5] | Party | |
|---|---|---|---|
| 1983 | John Evans | Labour | |
| 1997 | Dave Watts | Labour | |
| 2015 | Conor McGinn | Labour | |
Elections[]
Elections in the 2010s[]
| Party | Candidate | Votes | % | ±% | |
|---|---|---|---|---|---|
| Labour | Conor McGinn | 24,870 | 52.3 | −11.4 | |
| Conservative | Joel Charles | 12,661 | 26.6 | −0.5 | |
| Brexit Party | Malcolm Webster | 5,396 | 11.3 | New | |
| Liberal Democrats | Pat Moloney | 2,668 | 5.6 | +3.0 | |
| Green | David Van Der Burg | 1,966 | 4.1 | +1.7 | |
| Majority | 12,209 | 25.7 | −10.9 | ||
| Turnout | 47,561 | 62.9 | −3.1 | ||
| Labour hold | Swing | −5.4 | |||
| Party | Candidate | Votes | % | ±% | |
|---|---|---|---|---|---|
| Labour | Conor McGinn | 32,012 | 63.7 | +6.7 | |
| Conservative | Jackson Ng | 13,606 | 27.1 | +7.5 | |
| UKIP | Peter Peers | 2,097 | 4.2 | −10.9 | |
| Liberal Democrats | Tom Morrison | 1,287 | 2.6 | −1.8 | |
| Green | Rachel Parkinson | 1,220 | 2.4 | −1.4 | |
| Majority | 18,406 | 36.6 | −0.8 | ||
| Turnout | 50,222 | 66.0 | +4.5 | ||
| Labour hold | Swing | −0.4 | |||
| Party | Candidate | Votes | % | ±% | |
|---|---|---|---|---|---|
| Labour | Conor McGinn | 26,378 | 57.0 | +5.3 | |
| Conservative | Paul Richardson | 9,087 | 19.6 | −2.7 | |
| UKIP | Ian Smith | 6,983 | 15.1 | +10.4 | |
| Liberal Democrats | Denise Aspinall | 2,046 | 4.4 | −15.8 | |
| Green | Elizabeth Ward | 1,762 | 3.8 | New | |
| Majority | 17,291 | 37.4 | +8.0 | ||
| Turnout | 46,256 | 61.5 | +1.7 | ||
| Labour hold | Swing | +4.0 | |||
| Party | Candidate | Votes | % | ±% | |
|---|---|---|---|---|---|
| Labour | David Watts | 23,041 | 51.7 | −8.2 | |
| Conservative | Paul V. Greenall | 9,940 | 22.3 | +3.4 | |
| Liberal Democrats | John L. Beirne | 8,992 | 20.2 | −1.1 | |
| UKIP | Gary Robinson | 2,100 | 4.7 | +1.7 | |
| Socialist Labour | Stephen Whatham | 483 | 1.0 | New | |
| Majority | 13,101 | 29.4 | |||
| Turnout | 44,556 | 59.8 | +2.0 | ||
| Labour hold | Swing | −6.2 | |||
Elections in the 2000s[]
| Party | Candidate | Votes | % | ±% | |
|---|---|---|---|---|---|
| Labour | David Watts | 22,329 | 56.9 | −4.2 | |
| Liberal Democrats | John L. Beirne | 8,367 | 21.3 | +3.7 | |
| Conservative | Paul J. Oakley | 7,410 | 18.9 | +0.1 | |
| UKIP | Sylvia Hall | 1,165 | 3.0 | New | |
| Majority | 13,962 | 35.6 | -6.7 | ||
| Turnout | 39,271 | 57.8 | +5.1 | ||
| Labour hold | Swing | −4.0 | |||
| Party | Candidate | Votes | % | ±% | |
|---|---|---|---|---|---|
| Labour | David Watts | 22,977 | 61.1 | −3.8 | |
| Conservative | Simon Pearce | 7,076 | 18.8 | +1.5 | |
| Liberal Democrats | John L. Beirne | 6,609 | 17.6 | +4.9 | |
| Socialist Labour | Stephen Whatham | 939 | 2.5 | +0.8 | |
| Majority | 15,901 | 42.3 | -5.3 | ||
| Turnout | 37,601 | 52.7 | −16.2 | ||
| Labour hold | Swing | ||||
Elections in the 1990s[]
| Party | Candidate | Votes | % | ±% | |
|---|---|---|---|---|---|
| Labour | David Watts | 31,953 | 64.9 | +7.0 | |
| Conservative | Pelham J.C. Walker | 8,536 | 17.3 | −11.2 | |
| Liberal Democrats | John L. Beirne | 6,270 | 12.7 | −0.4 | |
| Referendum | David Johnson | 1,276 | 2.6 | New | |
| Socialist Labour | Ron Waugh | 833 | 1.7 | New | |
| UKIP | Richard D. Rubin | 363 | 0.7 | New | |
| Majority | 23,417 | 47.6 | +18.2 | ||
| Turnout | 49,231 | 68.9 | -8.5 | ||
| Labour hold | Swing | ||||
| Party | Candidate | Votes | % | ±% | |
|---|---|---|---|---|---|
| Labour | John Evans | 31,930 | 57.9 | +4.2 | |
| Conservative | Brendan Anderson | 15,686 | 28.5 | +1.2 | |
| Liberal Democrats | John L. Beirne | 7,224 | 13.1 | −6.0 | |
| Natural Law | Anne Lynch | 287 | 0.5 | New | |
| Majority | 16,244 | 29.4 | +3.0 | ||
| Turnout | 55,127 | 77.4 | +1.1 | ||
| Labour hold | Swing | +1.5 | |||
Elections in the 1980s[]
| Party | Candidate | Votes | % | ±% | |
|---|---|---|---|---|---|
| Labour | John Evans | 28,989 | 53.7 | +5.8 | |
| Conservative | Melinda Libby | 14,729 | 27.3 | −3.1 | |
| Liberal | Neil Derbyshire | 10,300 | 19.1 | −2.6 | |
| Majority | 14,260 | 26.4 | +8.9 | ||
| Turnout | 54,018 | 76.3 | +1.8 | ||
| Labour hold | Swing | +4.4 | |||
| Party | Candidate | Votes | % | ±% | |
|---|---|---|---|---|---|
| Labour | John Evans | 25,334 | 47.9 | ||
| Conservative | Anthony Rhodes | 16,075 | 30.4 | ||
| Liberal | Neil Derbyshire | 11,525 | 21.7 | ||
| Majority | 9,259 | 17.5 | |||
| Turnout | 52,934 | 74.5 | |||
| Labour win (new seat) | |||||
See also[]
- List of Parliamentary constituencies on Merseyside
Notes and references[]
- Notes
- ^ A borough constituency (for the purposes of election expenses and type of returning officer)
- ^ As with all constituencies, the constituency elects one Member of Parliament (MP) by the first past the post system of election at least every five years.
- ^ UKIP's swing nationally was +9.5% in 2015
- References
- ^ "Electorate Figures - Boundary Commission for England". 2011 Electorate Figures. Boundary Commission for England. 4 March 2011. Archived from the original on 6 November 2010. Retrieved 13 March 2011.
- ^ "'St Helens North', June 1983 up to May 1997". ElectionWeb Project. Cognitive Computing Limited. Retrieved 14 March 2016.
- ^ List of Labour MPs elected in 2015 by % majority UK Political.info. Retrieved 2017-01-29
- ^ Unemployment claimants by constituency The Guardian
- ^ Leigh Rayment's Historical List of MPs – Constituencies beginning with "S" (part 1)
- ^ "Statement of persons nominated" (PDF).
- ^ "St Helens North parliamentary constituency". BBC News.
- ^ "Election Data 2015". Electoral Calculus. Archived from the original on 17 October 2015. Retrieved 17 October 2015.
- ^ "St Helens North". BBC News. Retrieved 10 May 2015.
- ^ "Election Data 2010". Electoral Calculus. Archived from the original on 26 July 2013. Retrieved 17 October 2015.
- ^ "Election Data 2005". Electoral Calculus. Archived from the original on 15 October 2011. Retrieved 18 October 2015.
- ^ "Election Data 2001". Electoral Calculus. Archived from the original on 15 October 2011. Retrieved 18 October 2015.
- ^ "Election Data 1997". Electoral Calculus. Archived from the original on 15 October 2011. Retrieved 18 October 2015.
- ^ "Election Data 1992". Electoral Calculus. Archived from the original on 15 October 2011. Retrieved 18 October 2015.
- ^ "UK General Election results April 1992". Richard Kimber's Political Science Resources. Politics Resources. 9 April 1992. Retrieved 2010-12-06.
- ^ "Election Data 1987". Electoral Calculus. Archived from the original on 15 October 2011. Retrieved 18 October 2015.
- ^ "Election Data 1983". Electoral Calculus. Archived from the original on 15 October 2011. Retrieved 18 October 2015.
| Authority control |
|---|
- Parliamentary constituencies in North West England
- Constituencies of the Parliament of the United Kingdom established in 1983
- Politics of the Metropolitan Borough of St Helens