Blackpool South (UK Parliament constituency)
This article uses bare URLs, which may be threatened by link rot. (May 2021) |
Coordinates: 53°46′01″N 2°54′50″W / 53.767°N 2.914°W

| Blackpool South | |
|---|---|
| Borough constituency for the House of Commons | |
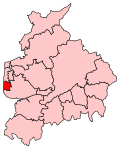 Boundary of Blackpool South in Lancashire | |
 Location of Lancashire within England | |
| County | Lancashire |
| Population | 81,266 (2011 census)[1] |
| Electorate | 56,850 (December 2018)[2] |
| Major settlements | Blackpool (part) |
| Current constituency | |
| Created | 1945 |
| Member of Parliament | Scott Benton (Conservative) |
| Number of members | One |
| Created from | Blackpool |
Blackpool South is a constituency[n 1] in Lancashire, represented in the House of Commons since 2019 by Scott Benton, a Conservative.[n 2]
History[]
This seat was created for the 1945 general election. This marginal constituency has been represented by both the Conservative and Labour Party parties since the Second World War. It was held by the Conservatives until 1997, when Gordon Marsden, gained it for Labour. He represented the seat for the next 22 years but was defeated in 2019 by the Conservative Scott Benton.
Constituency profile[]
The seat encompasses the central and southern parts of Blackpool, including the famous Blackpool Tower, the three piers and the Pleasure Beach. Also included is the Bloomfield area, home to Blackpool F.C. In the southern end of the seat, near to the Fylde border, Squires Gate is the site of Blackpool Airport.
Tourism is a major industry in the area, and while Blackpool has been less affected by the decline in domestic holidaymaking than some resorts, there are nonetheless some run-down areas which were once rather more glamorous. Traditionally seaside seats were very safe for the Conservative Party, but for some time it seemed unlikely that the party would win it back. However, they were able to do so in 2019 when they finally achieved a sizeable majority with many gains in the north of England.
Boundaries[]

1945–1950: The County Borough of Blackpool wards of Marton, Stanley, Victoria, and Waterloo, and the Borough of Lytham St Annes.
1950–1983: The County Borough of Blackpool wards of Alexandra, Marton, Stanley, Tyldesley, Victoria, and Waterloo.
1983–1997: The Borough of Blackpool wards of Alexandra, Clifton, Foxhall, Hawes Side, Highfield, Marton, Squires Gate, Stanley, Tyldesley, Victoria, and Waterloo.
1997–2010: The Borough of Blackpool wards of Alexandra, Brunswick, Clifton, Foxhall, Hawes Side, Highfield, Layton, Marton, Park, Squires Gate, Stanley, Talbot, Tyldesley, Victoria, and Waterloo.
2010–present: The Borough of Blackpool wards of Bloomfield, Brunswick, Clifton, Hawes Side, Highfield, Marton, Squires Gate, Stanley, Talbot, Tyldesley, Victoria, and Waterloo.
Members of Parliament[]
| Election | Member[3] | Party | |
|---|---|---|---|
| 1945 | Roland Robinson | Conservative | |
| 1964 | Sir Peter Blaker | Conservative | |
| 1992 | Nick Hawkins | Conservative | |
| 1997 | Gordon Marsden | Labour | |
| 2019 | Scott Benton | Conservative | |
Elections[]
Elections in the 2010s[]
| Party | Candidate | Votes | % | ±% | |
|---|---|---|---|---|---|
| Conservative | Scott Benton | 16,247 | 49.6 | ||
| Labour | Gordon Marsden | 12,557 | 38.3 | ||
| Brexit Party | David Brown | 2,009 | 6.1 | New | |
| Liberal Democrats | Bill Greene | 1,008 | 3.1 | ||
| Green | Becky Daniels | 563 | 1.7 | ||
| Independent | Gary Coleman | 368 | 1.1 | New | |
| Majority | 3,690 | 11.3 | N/A | ||
| Turnout | 32,752 | 56.8 | |||
| Conservative gain from Labour | Swing | ||||
| Party | Candidate | Votes | % | ±% | |
|---|---|---|---|---|---|
| Labour | Gordon Marsden | 17,581 | 50.3 | ||
| Conservative | Peter Anthony | 15,058 | 43.1 | ||
| UKIP | Noel Matthews | 1,339 | 3.8 | ||
| Liberal Democrats | Bill Greene | 634 | 1.8 | ||
| Green | John Warnock | 341 | 1.0 | ||
| Majority | 2,523 | 7.2 | |||
| Turnout | 34,953 | 59.8 | |||
| Labour hold | Swing | ||||
| Party | Candidate | Votes | % | ±% | |
|---|---|---|---|---|---|
| Labour | Gordon Marsden | 13,548 | 41.8 | +0.7 | |
| Conservative | Peter Anthony | 10,963 | 33.8 | −2.0 | |
| UKIP | Peter Wood | 5,613 | 17.3 | +13.5 | |
| Green | Duncan Royle | 841 | 2.6 | New | |
| Liberal Democrats | Bill Greene | 743 | 2.3 | −12.1 | |
| Independent | Andy Higgins | 655 | 2.0 | New | |
| Independent | Lawrence Chard | 73 | 0.2 | New | |
| Majority | 2,585 | 8.0 | +2.7 | ||
| Turnout | 32,436 | 56.5 | +0.7 | ||
| Labour hold | Swing | +1.3 | |||
| Party | Candidate | Votes | % | ±% | |
|---|---|---|---|---|---|
| Labour | Gordon Marsden | 14,449 | 41.1 | −7.5 | |
| Conservative | Ron Bell | 12,597 | 35.8 | +4.9 | |
| Liberal Democrats | Doreen Holt | 5,082 | 14.4 | −0.7 | |
| BNP | Roy Goodwin | 1,482 | 4.2 | +0.9 | |
| UKIP | Hugh Howitt | 1,352 | 3.8 | +1.7 | |
| Integrity UK | Si Thu Tun | 230 | 0.7 | New | |
| Majority | 1,852 | 5.3 | −15.4 | ||
| Turnout | 35,192 | 55.8 | +3.5 | ||
| Labour hold | Swing | −6.2 | |||
Elections in the 2000s[]
| Party | Candidate | Votes | % | ±% | |
|---|---|---|---|---|---|
| Labour | Gordon Marsden | 19,375 | 50.5 | −3.8 | |
| Conservative | Michael Winstanley | 11,453 | 29.9 | −3.1 | |
| Liberal Democrats | Doreen Holt | 5,552 | 14.5 | +3.9 | |
| BNP | Roy Goodwin | 1,113 | 2.9 | New | |
| UKIP | John Porter | 849 | 2.2 | +0.1 | |
| Majority | 7,922 | 20.6 | −0.7 | ||
| Turnout | 38,342 | 52.1 | −0.1 | ||
| Labour hold | Swing | −0.3 | |||
| Party | Candidate | Votes | % | ±% | |
|---|---|---|---|---|---|
| Labour | Gordon Marsden | 21,060 | 54.3 | −2.7 | |
| Conservative | David Morris | 12,798 | 33.0 | −1.4 | |
| Liberal Democrats | Doreen Holt | 4,115 | 10.6 | +2.0 | |
| UKIP | Valerie Cowell | 819 | 2.1 | New | |
| Majority | 8,262 | 21.3 | −1.3 | ||
| Turnout | 38,792 | 52.2 | −15.6 | ||
| Labour hold | Swing | −0.7 | |||
Elections in the 1990s[]
| Party | Candidate | Votes | % | ±% | |
|---|---|---|---|---|---|
| Labour | Gordon Marsden | 29,282 | 57.0 | +12.9 | |
| Conservative | Richard Booth | 17,666 | 34.4 | −9.0 | |
| Liberal Democrats | Doreen Holt | 4,392 | 8.6 | −3.5 | |
| Majority | 11,616 | 22.6 | N/A | ||
| Turnout | 51,340 | 67.8 | -6.5 | ||
| Labour gain from Conservative | Swing | −11.0 | |||
| Party | Candidate | Votes | % | ±% | |
|---|---|---|---|---|---|
| Conservative | Nick Hawkins | 19,880 | 45.2 | −2.8 | |
| Labour | Gordon Marsden | 18,213 | 41.5 | +9.4 | |
| Liberal Democrats | Robert E. Wynne | 5,673 | 12.9 | −7.0 | |
| Natural Law | Doug Henning | 173 | 0.4 | New | |
| Majority | 1,667 | 3.7 | −12.2 | ||
| Turnout | 43,939 | 77.3 | +3.8 | ||
| Conservative hold | Swing | −6.1 | |||
Elections in the 1980s[]
| Party | Candidate | Votes | % | ±% | |
|---|---|---|---|---|---|
| Conservative | Peter Blaker | 20,312 | 48.0 | −2.6 | |
| Labour | Sheilagh Baugh | 13,568 | 32.1 | +7.4 | |
| SDP | Julian Allitt | 8,405 | 19.9 | −4.1 | |
| Majority | 6,744 | 15.9 | -10.0 | ||
| Turnout | 42,285 | 73.5 | +3.7 | ||
| Conservative hold | Swing | −5.0 | |||
| Party | Candidate | Votes | % | ±% | |
|---|---|---|---|---|---|
| Conservative | Peter Blaker | 19,852 | 50.6 | −0.9 | |
| Labour | Fred J. Jackson | 9,714 | 24.7 | −5.9 | |
| SDP | Alex G. Cox | 9,417 | 24.0 | New | |
| National Front | Wilf Smith | 263 | 0.7 | −0.5 | |
| Majority | 10,138 | 25.9 | +5.0 | ||
| Turnout | 39,246 | 69.8 | -2.3 | ||
| Conservative hold | Swing | ||||
Elections in the 1970s[]
| Party | Candidate | Votes | % | ±% | |
|---|---|---|---|---|---|
| Conservative | Peter Blaker | 21,762 | 51.5 | +6.6 | |
| Labour | Pat Carrington | 12,914 | 30.6 | −1.4 | |
| Liberal | Edmund E. Wynne | 7,057 | 16.7 | −6.4 | |
| National Front | Alan Machin | 524 | 1.2 | New | |
| Majority | 8,848 | 20.9 | +8.0 | ||
| Turnout | 42,257 | 72.1 | +2.2 | ||
| Conservative hold | Swing | +4.0 | |||
| Party | Candidate | Votes | % | ±% | |
|---|---|---|---|---|---|
| Conservative | Peter Blaker | 18,188 | 44.9 | −0.7 | |
| Labour | Michael Atkins | 12,967 | 32.0 | +5.4 | |
| Liberal | Edmund E. Wynne | 9,327 | 23.1 | −4.2 | |
| Majority | 5,221 | 12.9 | -5.4 | ||
| Turnout | 40,482 | 69.9 | -6.7 | ||
| Conservative hold | Swing | −3.0 | |||
| Party | Candidate | Votes | % | ±% | |
|---|---|---|---|---|---|
| Conservative | Peter Blaker | 20,107 | 45.6 | −7.2 | |
| Liberal | Edmund E. Wynne | 12,016 | 27.3 | +13.1 | |
| Labour | Michael Atkins | 11,739 | 26.6 | −6.4 | |
| National Independence | Eric Mills | 229 | 0.5 | New | |
| Majority | 8,091 | 18.3 | -1.5 | ||
| Turnout | 44,091 | 76.6 | +8.3 | ||
| Conservative hold | Swing | ||||
| Party | Candidate | Votes | % | ±% | |
|---|---|---|---|---|---|
| Conservative | Peter Blaker | 21,273 | 52.8 | −1.5 | |
| Labour | Percy P Hall | 13,267 | 33.0 | −12.7 | |
| Liberal | David Chadwick | 5,730 | 14.2 | New | |
| Majority | 8,006 | 19.8 | +11.2 | ||
| Turnout | 40,270 | 68.3 | -1.8 | ||
| Conservative hold | Swing | ||||
Elections in the 1960s[]
| Party | Candidate | Votes | % | ±% | |
|---|---|---|---|---|---|
| Conservative | Peter Blaker | 21,564 | 54.3 | −4.0 | |
| Labour | Edward Pearce | 18,166 | 45.7 | +4.0 | |
| Majority | 3,398 | 8.6 | -8.0 | ||
| Turnout | 39,730 | 70.5 | -0.6 | ||
| Conservative hold | Swing | −4.0 | |||
| Party | Candidate | Votes | % | ±% | |
|---|---|---|---|---|---|
| Conservative | Peter Blaker | 23,769 | 58.3 | −7.5 | |
| Labour | Percy P Hall | 16,986 | 41.7 | +7.5 | |
| Majority | 6,783 | 16.6 | -15.0 | ||
| Turnout | 40,755 | 71.1 | -2.8 | ||
| Conservative hold | Swing | −7.6 | |||
Elections in the 1950s[]
| Party | Candidate | Votes | % | ±% | |
|---|---|---|---|---|---|
| Conservative | Roland Robinson | 25,767 | 65.8 | −0.6 | |
| Labour | Percy P Hall | 13,373 | 34.2 | +0.6 | |
| Majority | 12,430 | 31.6 | -1.2 | ||
| Turnout | 39,140 | 73.9 | +7.2 | ||
| Conservative hold | Swing | −0.6 | |||
| Party | Candidate | Votes | % | ±% | |
|---|---|---|---|---|---|
| Conservative | Roland Robinson | 24,773 | 66.4 | −0.8 | |
| Labour | Arthur Davidson | 12,548 | 33.6 | +0.8 | |
| Majority | 12,225 | 32.8 | -1.6 | ||
| Turnout | 37,321 | 67.7 | -7.3 | ||
| Conservative hold | Swing | −0.8 | |||
| Party | Candidate | Votes | % | ±% | |
|---|---|---|---|---|---|
| Conservative | Roland Robinson | 28,171 | 67.2 | +9.3 | |
| Labour | Kenneth Lomas | 13,750 | 32.8 | +2.1 | |
| Majority | 14,421 | 34.4 | +7.2 | ||
| Turnout | 41,921 | 75.0 | -7.1 | ||
| Conservative hold | Swing | +3.6 | |||
| Party | Candidate | Votes | % | ±% | |
|---|---|---|---|---|---|
| Conservative | Roland Robinson | 26,800 | 57.9 | +1.1 | |
| Labour | E.A. Machin | 14,190 | 30.7 | +6.5 | |
| Liberal | Michael Henry Woodward | 5,295 | 11.4 | −7.6 | |
| Majority | 12,610 | 27.2 | -5.4 | ||
| Turnout | 46,285 | 82.1 | -9.8 | ||
| Conservative hold | Swing | − | |||
Elections in the 1940s[]
| Party | Candidate | Votes | % | ±% | |
|---|---|---|---|---|---|
| Conservative | Roland Robinson | 27,957 | 56.8 | ||
| Labour | Charles Stanley Hilditch | 11,914 | 24.2 | ||
| Liberal | Adrian Liddell Hart | 9,359 | 19.0 | ||
| Majority | 16,043 | 32.6 | |||
| Turnout | 49,230 | 72.3 | |||
| Conservative win (new seat) | |||||
See also[]
Notes[]
References[]
- ^ "Blackpool South: Usual Resident Population, 2011". Neighbourhood Statistics. Office for National Statistics. Retrieved 31 January 2015.
- ^ England Parliamentary electorates Boundary Commission for England
- ^ Leigh Rayment's Historical List of MPs – Constituencies beginning with "B" (part 3)
- ^ "Blackpool South parliamentary constituency - Election 2019" – via www.bbc.com.
- ^ "Blackpool South parliamentary constituency - Election 2017" – via www.bbc.com.
- ^ "Election Data 2015". Electoral Calculus. Archived from the original on 17 October 2015. Retrieved 17 October 2015.
- ^ "Blackpool South". BBC News Online. Retrieved 8 May 2015.
- ^ "Election Data 2010". Electoral Calculus. Archived from the original on 26 July 2013. Retrieved 17 October 2015.
- ^ Blackpool South BBC Election 20`0
- ^ "Election Data 2005". Electoral Calculus. Archived from the original on 15 October 2011. Retrieved 18 October 2015.
- ^ "Election Data 2001". Electoral Calculus. Archived from the original on 15 October 2011. Retrieved 18 October 2015.
- ^ "Election Data 1997". Electoral Calculus. Archived from the original on 15 October 2011. Retrieved 18 October 2015.
- ^ "Politics Resources". Election 1997. Politics Resources. 1 May 1997. Archived from the original on 19 September 2011. Retrieved 7 January 2011.
- ^ C. Rallings & M. Thrasher, The Media Guide to the New Parliamentary Constituencies, p.35 (Plymouth: LGC Elections Centre, 1995)
- ^ The 1997 election result is calculated relative to the notional, not the actual, 1992 result.
- ^ "Election Data 1992". Electoral Calculus. Archived from the original on 15 October 2011. Retrieved 18 October 2015.
- ^ "Politics Resources". Election 1992. Politics Resources. 9 April 1992. Archived from the original on 24 July 2011. Retrieved 6 December 2010.
- ^ "Election Data 1987". Electoral Calculus. Archived from the original on 15 October 2011. Retrieved 18 October 2015.
- ^ "Election Data 1983". Electoral Calculus. Archived from the original on 15 October 2011. Retrieved 18 October 2015.
- ^ http://tools.assembla.com/svn/grodt/uk/thc/files/marked_up/1970_marked_up.txt
- ^ http://tools.assembla.com/svn/grodt/uk/thc/files/marked_up/1966_marked_up.txt
- ^ http://tools.assembla.com/svn/grodt/uk/thc/files/marked_up/1964_marked_up.txt
- ^ http://tools.assembla.com/svn/grodt/uk/thc/files/marked_up/1959_marked_up.txt
- ^ http://tools.assembla.com/svn/grodt/uk/thc/files/marked_up/1951_marked_up.txt
External links[]
| Authority control |
|---|
- Parliamentary constituencies in North West England
- Constituencies of the Parliament of the United Kingdom established in 1945
- Politics of Blackpool