Tornado intensity
This article's tone or style may not reflect the encyclopedic tone used on Wikipedia. (March 2021) |

Tornado intensity can be measured by in situ or remote sensing measurements, but since these are impractical for wide-scale use, intensity is usually inferred by proxies, such as damage. The Fujita scale and the Enhanced Fujita scale rate tornadoes by the damage caused.[1][2] The Enhanced Fujita scale was an upgrade to the older Fujita scale, with engineered (by expert elicitation) wind estimates and better damage descriptions, but was designed so that a tornado rated on the Fujita scale would receive the same numerical rating. An EF0 tornado will probably damage trees and peel some shingles off the roof. An EF5 tornado can rip well-anchored homes off their foundations, leaving them bare, and can even deform large skyscrapers. The similar TORRO scale ranges from a T0 for extremely weak tornadoes to T11 for the most powerful known tornadoes. Doppler radar data, photogrammetry, and ground swirl patterns (cycloidal marks) may also be analyzed to determine intensity and assign a rating.
Tornadoes vary in intensity regardless of shape, size, and location, though strong tornadoes are typically larger than weak tornadoes. The association with track length and duration also varies, although longer track (and longer-lived) tornadoes tend to be stronger.[3] In the case of violent tornadoes, only a small portion of the path area is of violent intensity; most of the higher intensity is from subvortices.[4] In the United States, 80% of tornadoes are rated EF0 or EF1 (equivalent to T0 through T3). The rate of occurrence drops off quickly with increasing strength; less than 1% are rated as violent (EF4 or EF5, equivalent to T8 through T11).[5]
History of tornado intensity measurements[]
For many years, before the advent of Doppler radar, scientists had nothing more than educated guesses as to the speed of the winds in a tornado. The only evidence indicating the wind speeds found in the tornado was the damage left behind by tornadoes that struck populated areas. Some believed they reach 400 mph (640 km/h); others thought they might exceed 500 mph (800 km/h), and perhaps even be supersonic. One can still find these incorrect guesses in some old (until the 1960s) literature, such as the original Fujita intensity scale developed by Dr. Tetsuya Theodore "Ted" Fujita in the early '70s. However, one can find accounts (e.g. [1]; be sure to scroll down) of some remarkable work done in this field by a U.S. Army soldier, Sergeant John Park Finley.
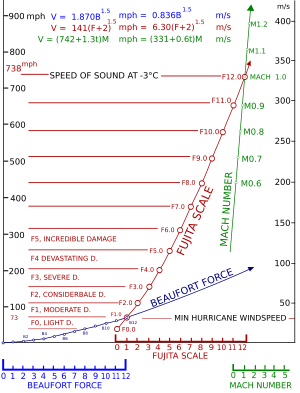
In 1971, Dr. Fujita introduced the idea for a scale of tornado winds. With the help of colleague Allen Pearson, he created and introduced what came to be called the Fujita scale in 1973. The F in F1, F2, etc. stands for Fujita. The scale was based on a relationship between the Beaufort scale and the Mach number scale; the low end of F1 on his scale corresponds to the low end of B12 on the Beaufort scale, and the low end of F12 corresponds to the speed of sound at sea level, or Mach 1. In practice, tornadoes are only assigned categories F0 through F5.
The TORRO scale, created by the Tornado and Storm Research Organisation (TORRO), was developed in 1974 and published a year later. The TORRO scale has 12 levels, which cover a broader range with tighter graduations. It ranges from a T0 for extremely weak tornadoes to T11 for the most powerful known tornadoes. T0–T1 roughly correspond to F0, T2–T3 to F1, and so on. While T10–T11 would be roughly equivalent to F5, the highest tornado rated to date on the TORRO scale was a T8.[6][7] Some debate exists as to the usefulness of the TORRO scale over the Fujita scale—while it may be helpful for statistical purposes to have more levels of tornado strength, often the damage caused could be created by a large range of winds, rendering it hard to narrow the tornado down to a single TORRO scale category.
Research conducted in the late 1980s and 1990s suggested that even with the implication of the Fujita scale, tornado winds were notoriously overestimated, especially in significant and violent tornadoes. Because of this, in 2006, the American Meteorological Society introduced the Enhanced Fujita scale, to help assign realistic wind speeds to tornado damage. The scientists specifically designed the scale so that a tornado assessed on the Fujita scale and the Enhanced Fujita scale would receive the same ranking. The EF-scale is more specific in detailing the degrees of damage on different types of structures for a given wind speed. While the F-scale goes from F0 to F12 in theory, the EF-scale is capped at EF5, which is defined as "winds ≥200 mph (320 km/h)".[8] In the United States, the Enhanced Fujita scale went into effect on February 2, 2007, for tornado damage assessments and the Fujita scale is no longer used.
The first observation confirming that F5 winds could occur happened on April 26, 1991. A tornado near Red Rock, Oklahoma, was monitored by scientists using a portable Doppler radar, an experimental radar device that measures wind speed. Near the tornado's peak intensity, they recorded a wind speed of 115–120 m/s (260–270 mph; 410–430 km/h). Though the portable radar had uncertainty of ±5–10 m/s (11–22 mph; 18–36 km/h), this reading was probably within the F5 range, confirming that tornadoes were capable of violent winds found nowhere else on earth.
Eight years later, during the 1999 Oklahoma tornado outbreak of May 3, another scientific team was monitoring an exceptionally violent tornado (one which eventually killed 36 people in the Oklahoma City metropolitan area). Around 7:00 pm, they recorded one measurement of 301 ± 20 mph (484 ± 32 km/h),[9] 50 mph (80 km/h) faster than the previous record. Though this reading is just short of the theoretical F6 rating, the measurement was taken more than 100 ft (30 m) in the air, where winds are typically stronger than at the surface.[citation needed] In rating tornadoes, only surface wind speeds, or the wind speeds indicated by the damage resulting from the tornado, are taken into account. Also, in practice, the F6 rating is not used.
While scientists have long theorized that extremely low pressures might occur in the center of tornadoes, no measurements confirm it. A few home barometers had survived close passes by tornadoes, recording values as low as 24 inHg (810 hPa), but these measurements were highly uncertain.[10] However, on June 24, 2003, a group of researchers successfully dropped devices called "turtles" into an F4 tornado near Manchester, South Dakota, one of which measured a pressure drop of more than 100 hPa (3.0 inHg) as the tornado passed directly overhead.[11] Still, tornadoes are widely varied, so meteorologists are still conducting research to determine if these values are typical or not.
Typical intensity[]
In the United States, F0 and F1 (T0 through T3) tornadoes account for 80% of all tornadoes. The rate of occurrence drops off quickly with increasing strength—violent tornadoes (stronger than F4, T8), account for less than 1% of all tornado reports.[5] Worldwide, strong tornadoes account for an even smaller percentage of total tornadoes. Violent tornadoes are extremely rare outside of the United States, Canada, and Bangladesh.
F5 and EF5 tornadoes are rare, occurring typically once every few years. An F5 tornado was reported in Elie, Manitoba, in Canada, on June 22, 2007. Before that, the last confirmed F5 was the 1999 Bridge Creek–Moore tornado, which killed 36 people on May 3, 1999.[12] Nine EF5 tornadoes have occurred in the United States, in Greensburg, Kansas, on May 4, 2007; Parkersburg, Iowa, on May 25, 2008; Smithville, Mississippi, Philadelphia, Mississippi, Hackleburg, Alabama, and Rainsville, Alabama, (four separate tornadoes) on April 27, 2011; Joplin, Missouri, on May 22, 2011, and El Reno, Oklahoma, on May 24, 2011. On May 20, 2013, a confirmed EF5 tornado again struck Moore, Oklahoma.
Typical damage[]
| T0 | T1 | T2 | T3 | T4 | T5 | T6 | T7 | T8 | T9 | T10 | T11 |
|---|---|---|---|---|---|---|---|---|---|---|---|
| F0 EF0 |
F1 EF1 |
F2 EF2 |
F3 EF3 |
F4 EF4 |
F5 EF5 | ||||||
| Weak | Strong | Violent | |||||||||
| Significant | |||||||||||
| Intense | |||||||||||
A typical tornado has winds of 110 mph (180 km/h) or less, is about 250 ft (76 m) across, and travels a mile (1.6 km) or so before dissipating.[citation needed] However, tornadic behavior is extremely variable; these figures represent only statistical probability.
Two tornadoes that look almost exactly the same can produce drastically different effects. Also, two tornadoes that look very different can produce similar damage, because tornadoes form by several different mechanisms and also follow a lifecycle that causes the same tornado to change in appearance over time. People in the path of a tornado should never attempt to determine its strength as it approaches. Between 1950 and 2014 in the United States, 222 people have been killed by EF1 tornadoes, and 21 have been killed by EF0 tornadoes.[15][16]
Weak tornadoes[]
Around 60-70% [17] of tornadoes are designated EF1 or EF0, also known as "weak" tornadoes, but weak is a relative term for tornadoes, as even these can cause significant damage. F0 and F1 tornadoes are typically short-lived; since 1980, almost 75% of tornadoes rated weak stayed on the ground for 1 mi (1.6 km) or less.[12] In this time, though, they can cause both damage and fatalities.
EF0 (T0–T1) damage is characterized by superficial damage to structures and vegetation. Well-built structures are typically unscathed, sometimes sustaining broken windows, with minor damage to roofs and chimneys. Billboards and large signs can be knocked down. Trees may have large branches broken off, and can be uprooted if they have shallow roots. Any tornado that is confirmed, but causes no damage (i.e. remains in open fields) is normally rated EF0, as well, even if the tornado has winds that would give it a higher rating. Some NWS offices, however, have rated these tornadoes EFU (EF-Unknown) due to the lack of damage. [18]
EF1 (T2–T3) damage has caused significantly more fatalities than those caused by EF0 tornadoes. At this level, damage to mobile homes and other temporary structures becomes significant, and cars and other vehicles can be pushed off the road or flipped. Permanent structures can suffer major damage to their roofs.
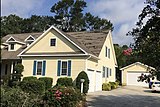
EF0 damage: This house only sustained minor loss of shingles. Though well-built structures are typically unscathed by EF0 tornadoes, falling trees and tree branches can injure and kill people, even inside a sturdy structure. Between 35 and 40% of all annual tornadoes in the U.S. are rated EF0.
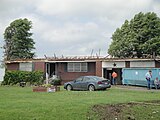
EF1 damage: Cause major damage to mobile homes and automobiles, and can cause minor structural damage to well-constructed homes. This frame home sustained major roof damage, but otherwise remained intact. Around 35% of all annual tornadoes in the U.S. rated EF1.


Significant tornadoes[]
EF2 (T4–T5) tornadoes are the lower end of "significant", yet are stronger than most tropical cyclones (though tropical cyclones affect a much larger area and their winds take place for a much longer duration). Well-built structures can suffer serious damage, including roof loss, and collapse of some exterior walls may occur at poorly built structures. Mobile homes, however, are totally destroyed. Vehicles can be lifted off the ground, and lighter objects can become small missiles, causing damage outside of the tornado's main path. Wooded areas have a large percentage of their trees snapped or uprooted.
EF3 (T6–T7) damage is a serious risk to life and limb and the point at which a tornado statistically becomes significantly more destructive and deadly. Few parts of affected buildings are left standing; well-built structures lose all outer and some inner walls. Unanchored homes are swept away, and homes with poor anchoring may collapse entirely. Small vehicles and similarly sized objects are lifted off the ground and tossed as projectiles. Wooded areas suffer almost total loss of vegetation, and some tree debarking may occur. Statistically speaking, EF3 is the maximum level that allows for reasonably effective residential sheltering in place in a first-floor interior room closest to the center of the house (the most widespread tornado sheltering procedure in America for those with no basement or underground storm shelter).
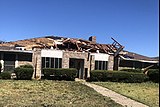
EF2 damage: At this intensity, tornadoes have a more significant impact on well-built structures, removing the roofs, and collapsing some exterior walls of poorly built structures. EF2 tornadoes are capable of completely destroying mobile homes, and generating large amounts of flying debris. This home completely lost its roof, but its walls remained intact. Between 15 and 19% of all annual tornadoes in the U.S. are rated EF2.
EF3 damage: Here, the roof and all but some inner walls of this frame home have been demolished. While taking shelter in a basement, cellar, or inner room improves one's odds of surviving a tornado drastically, occasionally even this is not enough. EF3 and stronger tornadoes only account for about 6% of all annual tornadoes in the United States, yet since 1980, they have accounted for more than 75% of tornado-related deaths.


Violent tornadoes[]
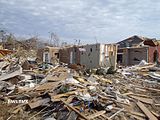
EF4 (T8–T9) damage typically results in a total loss of the affected structure. Well-built homes are reduced to a short pile of medium-sized debris on the foundation. Homes with poor or no anchoring are swept completely away. Large, heavy vehicles, including airplanes, trains, and large trucks, can be pushed over, flipped repeatedly, or picked up and thrown. Large, healthy trees are entirely debarked and snapped off close to the ground or uprooted altogether and turned into flying projectiles. Passenger cars and similarly sized objects can be picked up and flung for considerable distances. EF4 damage can be expected to level even the most robustly built homes, making the common practice of sheltering in an interior room on the ground floor of a residence insufficient to ensure survival. A storm shelter, reinforced basement, or other subterranean shelter is considered necessary to provide any reasonable expectation of safety against EF4 damage.
EF5 (T10–T11) damage represents the upper limit of tornado power, and destruction is almost always total. An EF5 tornado pulls well-built, well-anchored homes off their foundations and into the air before obliterating them, flinging the wreckage for miles and sweeping the foundation clean. Large, steel-reinforced structures such as schools are completely leveled. Tornadoes of this intensity tend to shred and scour low-lying grass and vegetation from the ground. Very little recognizable structural debris is generated by EF5 damage, with most materials reduced to a coarse mix of small, granular particles and dispersed evenly across the tornado's damage path. Large, multiple-ton steel frame vehicles and farm equipment are often mangled beyond recognition and deposited miles away or reduced entirely to unrecognizable component parts. The official description of this damage highlights the extreme nature of the destruction, noting that "incredible phenomena will occur"; historically, this has included such displays of power as twisting skyscrapers, leveling entire communities, and stripping asphalt from roadbeds. Despite their relative rarity, the damage caused by EF5 tornadoes represents a disproportionately extreme hazard to life and limb; since 1950 in the United States, only 59 tornadoes (0.1% of all reports) have been designated F5 or EF5, and yet these have been responsible for more than 1300 deaths and 14,000 injuries (21.5 and 13.6%, respectively).[12][19]
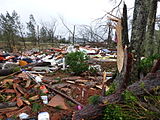
EF4 damage: Brick home reduced to piles of rubble. Above-ground structures are almost completely vulnerable to EF4 tornadoes, which level well-built structures, toss heavy vehicles through the air, and uproot trees, turning them into flying missiles. Around 1.1% of annual tornadoes in the U.S. are rated EF4.

EF5 damage: These tornadoes cause complete destruction, obliterating and sweeping away almost anything in their paths, including those sheltering in open basements. However, they are extremely rare (making up less than 0.1% of annual tornadoes in the U.S.), and even a tornado rated as EF5 usually only produces EF5 damage across a relatively small portion of the damage path (with EF0-EF4 damage zones surrounding the central EF5 core).[20]


See also[]
References[]
- ^ NOAA: Fujita Tornado Damage Scale
- ^ Tornado Damage Scales: Fujita Scale and Enhanced Fujita Scale
- ^ Brooks, Harold E. (2004-04-01). "On the Relationship of Tornado Path Length and Width to Intensity". Weather and Forecasting. 19 (2): 310–319. Bibcode:2004WtFor..19..310B. doi:10.1175/1520-0434(2004)019<0310:OTROTP>2.0.CO;2.
- ^ Jump up to: a b Grazulis, Thomas P. (July 1993). Significant Tornadoes 1680–1991. St. Johnsbury, Vermont: The Tornado Project of Environmental Films. ISBN 978-1-879362-03-1.
- ^ Jump up to: a b Edwards, Moller, Purpura; et al. (2005). "Basic Spotters' Field Guide" (PDF). US Department of Commerce, National Weather Service. Retrieved 2006-11-01.CS1 maint: multiple names: authors list (link)
- ^ Meaden, Dr. Terence (1985). "A Brief History of TORRO (to 1985)". TORRO. Retrieved 2006-11-01.
- ^ Various. "British Weather Extremes Summary". TORRO. Retrieved 2006-11-02.
- ^ Edwards, Roger (2006-04-04). "The Online Tornado FAQ". Storm Prediction Center. Retrieved 2006-09-08.
- ^ Center for Severe Weather Research (2006). "Doppler On Wheels". Archived from the original on 2007-02-05. Retrieved 2006-12-29.
- ^ Lyons, Walter A. The Handy Weather Answer Book. Detroit: Visible Ink Press, 1997.
- ^ Chasing Tornadoes @ National Geographic Magazine
- ^ Jump up to: a b c Data from the Storm Prediction Center archives, which are accessible through SvrPlot, free software created and maintained by , lead forecaster for the SPC.
- ^ The Fujita Scale of Tornado Intensity Archived 2011-12-30 at the Wayback Machine
- ^ Severe Thunderstorm Climatology
- ^ "Search Tornadoes". Tornadohistoryproject.com. Tornadohistoryproject.com. Retrieved 24 June 2015.
- ^ "Climatological or Past Storm Information and Archived Data." Storm Prediction Center. 2006.
- ^ https://www.britannica.com/science/tornado/Tornado-intensity#ref218368
- ^ Murphy, John D. (9 July 2018). "National Weather Service Instruction 10-1605" (PDF). National Weather Service. pp. A–74–75. Retrieved 6 March 2021.
- ^ http://www.norman.noaa.gov/nsww/wp-content/uploads/2012/03/LaDue_NSWW2012.pdf
- ^ WW2010 Project. "Tornadoes". University of Illinois at Urbana–Champaign Department of Atmospheric Sciences. Retrieved 2006-11-01.
- Edwards, Roger; J. G. LaDue; J. T. Ferree; K. Scharfenberg; C. Maier; W. L. Coulbourne (2013). "Tornado Intensity Estimation: Past, Present, and Future". Bull. Amer. Meteor. Soc. 94 (5): 641–53. Bibcode:2013BAMS...94..641E. doi:10.1175/BAMS-D-11-00006.1.
- Agee, Ernest; S. Childs (2014). "Adjustments in Tornado Counts, F-Scale Intensity, and Path Width for Assessing Significant Tornado Destruction". J. Appl. Meteorol. Climatol. 53 (6): 1494–505. Bibcode:2014JApMC..53.1494A. doi:10.1175/JAMC-D-13-0235.1.
Further reading[]
- Feuerstein, Bernold; P. Groenemeijer; E. Dirksen; M. Hubrig; A.M. Holzer; N. Dotzek (Jun 2011). "Towards an improved wind speed scale and damage description adapted for Central Europe". Atmos. Res. 100 (4): 547–64. Bibcode:2011AtmRe.100..547F. doi:10.1016/j.atmosres.2010.12.026.
- Tornado
- Tornadogenesis