Unitary Democratic Coalition
Unitary Democratic Coalition Coligação Democrática Unitária | |
|---|---|
 | |
| Abbreviation | PCP–PEV CDU (historical) |
| Leader | Jerónimo de Sousa |
| Founded | 1987 |
| Preceded by | United People Alliance |
| Headquarters | Rua Soeiro Pereira Gomes 3, 1600-019 Lisboa |
| Youth wing | Juventude CDU |
| Membership | 60,484 (PCP) c. 6,000 (PEV) |
| Ideology | Communism[1][2] Eco-socialism[3] |
| Political position | Left-wing to far-left |
| European Parliament group | European United Left–Nordic Green Left (PCP) Greens–European Free Alliance (PEV) |
| Colours | Red, Green, Blue, White |
| Member parties | PCP PEV ID |
| Assembly of the Republic | 12 / 230
|
| European Parliament | 2 / 21
|
| Regional Parliaments | 1 / 104
|
| Local government (Mayors) | 24 / 308
|
| Local government (Parishes) | 140 / 3,085
|
| Party flag | |
 | |
| Website | |
| www.cdu.pt | |
The Unitary Democratic Coalition[4] (Portuguese: CDU – Coligação Democrática Unitária, PCP–PEV) is an electoral and political coalition between the Portuguese Communist Party (Portuguese: Partido Comunista Português or PCP) and the Ecologist Party "The Greens" (Portuguese: Partido Ecologista "Os Verdes" or PEV). The coalition also integrates the political movement Democratic Intervention (Portuguese: Intervenção Democrática or ID).
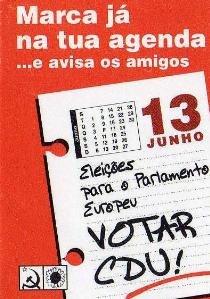
The coalition was formed for the first time in 1987 in order to run to the simultaneous legislative election and European Parliament election that were held on July 19 of that year.
Since the beginning of the coalition, the member parties have never participated separately in any election. The Communist Party is the major force inside it and has the majority of places in the electoral lists, however, the Greens also have an important presence and elected 2 members of parliament among the 17 elected by the coalition in the last legislative election. Each party has its own parliamentary group and counts as a separate party in official issues.
At a local level, the coalition usually presents lists in almost every municipality and both Communists and Greens may occupy first place on the lists. As the Greens have a smaller structure, the offices of the Communist Party are used as offices of the coalition.
The coalition supported the minority Socialist Costa Government (2015–2019) with a confidence and supply agreement.
Symbol[]

The present symbol of CDU shows the PCP's symbol and the PEV's symbol, a hammer and sickle and a sunflower, respectively, with the respective names below. That symbol replaced a former one that featured three hexagons with the inscription: CDU and was often used with a beehive. That was sometimes said to mean that CDU worked just like a bee (collectively and every day) and the hexagons were meant to represent the cell-based Leninist organization of the PCP.
Youth organization[]
The coalition has a youth wing, called Juventude CDU, that develops political work in youth related subjects, along with youth-oriented activities, mainly during the electoral campaigns. The Juventude CDU is mainly composed by members of the youth wings of the parties that compose the CDU, the Portuguese Communist Youth and the Ecolojovem.
Electoral results achieved by CDU[]
Assembly of the Republic[]

| Election year | # of overall votes |
% of overall vote |
# of overall seats won |
+/- | Notes |
|---|---|---|---|---|---|
| 1987 | 685,109 | 12.2 (#3) | 31 / 250
|
||
| 1991 | 501,840 | 8.8 (#3) | 17 / 230
|
||
| 1995 | 504,007 | 8.6 (#4) | 15 / 230
|
||
| 1999 | 483,716 | 9.0 (#3) | 17 / 230
|
||
| 2002 | 379,870 | 6.9 (#4) | 12 / 230
|
||
| 2005 | 433,369 | 7.5 (#3) | 14 / 230
|
||
| 2009 | 446,174 | 7.9 (#5) | 15 / 230
|
||
| 2011 | 440,850 | 7.9 (#4) | 16 / 230
|
||
| 2015 | 445,901 | 8.3 (#4) | 17 / 230
|
||
| 2019 | 332,018 | 6.3 (#4) | 12 / 230
|
(source: Portuguese Electoral Commission)
Note:
- In 1991 the overall number of MPs changed from the original 250 to 230.
Local elections[]
| Election year | # of overall votes |
% of overall vote |
# of overall councillors won |
+/- | # of overall mayors elected |
+/- | Notes |
|---|---|---|---|---|---|---|---|
| 1989 | 633,682 | 12.8 (#3) | 253 / 1,997
|
50 / 305
|
|||
| 1993 | 689,928 | 12.8 (#3) | 246 / 2,015
|
49 / 305
|
|||
| 1997 | 643,956 | 12.0 (#3) | 236 / 2,021
|
41 / 305
|
|||
| 2001 | 557,481 | 10.6 (#3) | 202 / 2,044
|
28 / 308
|
|||
| 2005 | 590,598 | 11.0 (#3) | 203 / 2,046
|
32 / 308
|
|||
| 2009 | 537,329 | 9.7 (#3) | 174 / 2,078
|
28 / 308
|
|||
| 2013 | 552,506 | 11.1 (#3) | 213 / 2,086
|
34 / 308
|
|||
| 2017 | 489,189 | 9.5 (#3) | 171 / 2,074
|
24 / 308
|
(source: Portuguese Electoral Commission)
European Parliament[]
| Election year | # of overall votes |
% of overall vote |
# of overall seats won |
+/- | Notes |
|---|---|---|---|---|---|
| 1987 | 646,640 | 11.50 (#4) | 3 / 24
|
||
| 1989 | 594,961 | 14.41 (#3) | 4 / 24
|
||
| 1994 | 339,283 | 11.19 (#4) | 3 / 25
|
||
| 1999 | 357,575 | 10.32 (#3) | 2 / 25
|
||
| 2004 | 309,406 | 9.09 (#3) | 2 / 24
|
||
| 2009 | 379,787 | 10.64 (#4) | 2 / 22
|
||
| 2014 | 416,925 | 12.69 (#3) | 3 / 21
|
||
| 2019 | 228,156 | 6.88 (#4) | 2 / 21
|
(source: Portuguese Electoral Commission)
References[]
- ^ THE STATE OF POPULISM IN EUROPE (2016) via Politico EU
- ^ The State of Populism in Europe 2017 via Academia
- ^ Nordsieck, Wolfram (2019). "Portugal". Parties and Elections in Europe.
- ^ "Elections for the National Parliament, 4th October 2015". 28 September 2015.
External links[]
| hide | |
|---|---|
| Parties represented in the Assembly of the Republic (230) |
|
| Legislative Assembly of the Azores Autonomous Region (57) |
|
| Legislative Assembly of the Madeira Autonomous Region (47) | |
| European Parliament (21) |
|
| Non-parliamentary parties | |
| |
- 1987 establishments in Portugal
- Communist parties in Portugal
- Ecosocialist parties
- Political parties established in 1987
- Political party alliances in Portugal
- Portuguese Communist Party