Warren County, Illinois
Warren County | |
|---|---|
U.S. county | |
 in Monmouth | |
 Location within the U.S. state of Illinois | |
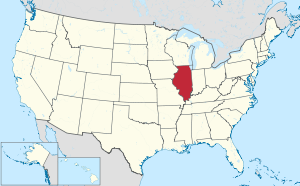 Illinois's location within the U.S. | |
| Coordinates: 40°51′N 90°37′W / 40.85°N 90.61°W | |
| Country | |
| State | |
| Founded | 1825 |
| Named for | Joseph Warren |
| Seat | Monmouth |
| Largest city | Monmouth |
| Area | |
| • Total | 543 sq mi (1,410 km2) |
| • Land | 542 sq mi (1,400 km2) |
| • Water | 0.6 sq mi (2 km2) 0.1% |
| Population (2010) | |
| • Total | 17,707 |
| • Estimate (2018) | 17,032 |
| • Density | 33/sq mi (13/km2) |
| Time zone | UTC−6 (Central) |
| • Summer (DST) | UTC−5 (CDT) |
| Congressional district | 17th |
| Website | www |

Warren County is a county in the U.S. state of Illinois. According to the 2010 census, it had a population of 17,707.[1] Its county seat is Monmouth.[2]
History[]
Warren County was organized in 1825 out of Pike County which consisted of all portions of the state north and west of the Illinois River before 1825. Henderson County was formed in 1841 from the western area of Warren County.
Warren County was named for Dr. Joseph Warren, killed at the Battle of Bunker Hill in 1775. He is believed to have been the first officer to die in the Revolutionary War.
The current courthouse, constructed of red Portage stone, was completed in 1895.

Warren County from the time of its creation to 1831
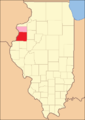
Between 1831 and 1835, Mercer County was temporarily attached to Warren until it could organize its own county government.[3]
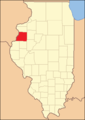
Warren County between 1835 and 1841

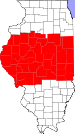
Warren County in 1841, reduced to its current borders by the creation of Henderson County


Geography[]
According to the U.S. Census Bureau, the county has a total area of 543 square miles (1,410 km2), of which 542 square miles (1,400 km2) is land and 0.6 square miles (1.6 km2) (0.1%) is water.[4]
Climate and weather[]
| Monmouth, Illinois | ||||||||||||||||||||||||||||||||||||||||||||||||||||||||||||
|---|---|---|---|---|---|---|---|---|---|---|---|---|---|---|---|---|---|---|---|---|---|---|---|---|---|---|---|---|---|---|---|---|---|---|---|---|---|---|---|---|---|---|---|---|---|---|---|---|---|---|---|---|---|---|---|---|---|---|---|---|
| Climate chart (explanation) | ||||||||||||||||||||||||||||||||||||||||||||||||||||||||||||
| ||||||||||||||||||||||||||||||||||||||||||||||||||||||||||||
| ||||||||||||||||||||||||||||||||||||||||||||||||||||||||||||
In recent years, average temperatures in the county seat of Monmouth have ranged from a low of 15 °F (−9 °C) in January to a high of 85 °F (29 °C) in July, although a record low of −27 °F (−33 °C) was recorded in February 1905 and a record high of 110 °F (43 °C) was recorded in July 1936. Average monthly precipitation ranged from 1.62 inches (41 mm) in January to 4.33 inches (110 mm) in July.[5]
Adjacent counties[]
- Mercer County (north)
- Knox County (east)
- Fulton County (southeast)
- McDonough County (south)
- Henderson County (west)
Demographics[]
| Historical population | |||
|---|---|---|---|
| Census | Pop. | %± | |
| 1830 | 308 | — | |
| 1840 | 6,739 | 2,088.0% | |
| 1850 | 8,176 | 21.3% | |
| 1860 | 18,336 | 124.3% | |
| 1870 | 23,174 | 26.4% | |
| 1880 | 22,933 | −1.0% | |
| 1890 | 21,281 | −7.2% | |
| 1900 | 23,163 | 8.8% | |
| 1910 | 23,313 | 0.6% | |
| 1920 | 21,488 | −7.8% | |
| 1930 | 21,745 | 1.2% | |
| 1940 | 21,286 | −2.1% | |
| 1950 | 21,981 | 3.3% | |
| 1960 | 21,587 | −1.8% | |
| 1970 | 21,595 | 0.0% | |
| 1980 | 21,943 | 1.6% | |
| 1990 | 19,181 | −12.6% | |
| 2000 | 18,735 | −2.3% | |
| 2010 | 17,707 | −5.5% | |
| 2018 (est.) | 17,032 | [6] | −3.8% |
| U.S. Decennial Census[7] 1790-1960[8] 1900-1990[9] 1990-2000[10] 2010-2013[1] | |||
At the 2010 United States Census, there were 17,707 people, 6,918 households and 4,617 families residing in the county.[11] The population density was 32.6 inhabitants per square mile (12.6/km2). There were 7,682 housing units at an average density of 14.2 per square mile (5.5/km2).[4] The racial makeup of the county was 91.3% white, 1.7% black or African American, 0.5% Asian, 0.2% American Indian, 0.1% Pacific islander, 4.5% from other races, and 1.6% from two or more races. Those of Hispanic or Latino origin made up 8.4% of the population.[11] In terms of ancestry, 25.2% were German, 14.7% were Irish, 11.3% were English, 10.0% were Swedish, and 5.5% were American.[12]
Of the 6,918 households, 29.6% had children under the age of 18 living with them, 52.2% were married couples living together, 9.7% had a female householder with no husband present, 33.3% were non-families, and 28.2% of all households were made up of individuals. The average household size was 2.40 and the average family size was 2.91. The median age was 39.6 years.[11]
The median household income was $41,636 and the median family income was $49,623. Males had a median income of $40,289 and females $25,460. The per capita incomewas $20,047. About 11.0% of families and 13.4% of the population were below the poverty line, including 18.1% of those under age 18 and 10.6% of those age 65 or over.[13]
Politics[]
Warren County is located in Illinois's 17th Congressional District and is currently represented by Democrat Cheri Bustos. For the Illinois House of Representatives, the county is split between the 93rd district, currently represented by Republican Norine Hammond, and the 94th district, currently represented by Randy Frese. The county is located in the 47th district of the Illinois Senate, and is currently represented by Republican Jil Tracy.
In presidential elections, Warren County voted for the Republican Party's candidate in every election from 1936 through 1988, often by a wide margin. From 1992 to 2012, the contest in Warren County was more competitive, with the Democratic Party's candidate winning four out of six times.
Transportation[]
Airport[]
- Monmouth Municipal Airport "info". Retrieved August 2, 2008.
Major highways[]
 U.S. Highway 34
 U.S. Highway 67
 Illinois Route 94
 Illinois Route 116
 Illinois Route 135
 Illinois Route 164
Law enforcement[]
State[]
- Illinois State Police District 14, Macomb
County[]
- Warren County Sheriff's Office
In a scene in the 2018 film "Halloween", the local sheriff drives a car that says Warren County Sheriff's Department. Confirming that the fictional town of Haddonfield is located in Warren County.
Municipal[]
- Alexis Police Department, Alexis
- Monmouth Police Department, Monmouth
Volunteer[]
Warren County/Monmouth Auxiliary Police Corps
Communities[]
City[]
- Monmouth
Villages[]
- Alexis (partly in Mercer County)
- Kirkwood
- Little York
- Roseville
Unincorporated communities[]
Townships[]
Warren County is divided into these townships:
See also[]
References[]
- ^ Jump up to: a b "State & County QuickFacts". United States Census Bureau. Archived from the original on July 22, 2011. Retrieved July 9, 2014.
- ^ "Find a County". National Association of Counties. Retrieved June 7, 2011.
- ^ White, Jesse. Origin and Evolution of Illinois Counties. State of Illinois, March 2010.
- ^ Jump up to: a b "Population, Housing Units, Area, and Density: 2010 - County". United States Census Bureau. Archived from the original on February 12, 2020. Retrieved July 12, 2015.
- ^ Jump up to: a b "Monthly Averages for Monmouth, Illinois". The Weather Channel. Retrieved January 27, 2011.
- ^ "Population and Housing Unit Estimates". Retrieved November 2, 2019.
- ^ "U.S. Decennial Census". United States Census Bureau. Retrieved July 9, 2014.
- ^ "Historical Census Browser". University of Virginia Library. Retrieved July 9, 2014.
- ^ "Population of Counties by Decennial Census: 1900 to 1990". United States Census Bureau. Retrieved July 9, 2014.
- ^ "Census 2000 PHC-T-4. Ranking Tables for Counties: 1990 and 2000" (PDF). United States Census Bureau. Retrieved July 9, 2014.
- ^ Jump up to: a b c "DP-1 Profile of General Population and Housing Characteristics: 2010 Demographic Profile Data". United States Census Bureau. Archived from the original on February 13, 2020. Retrieved July 12, 2015.
- ^ "DP02 SELECTED SOCIAL CHARACTERISTICS IN THE UNITED STATES – 2006-2010 American Community Survey 5-Year Estimates". United States Census Bureau. Archived from the original on February 13, 2020. Retrieved July 12, 2015.
- ^ "DP03 SELECTED ECONOMIC CHARACTERISTICS – 2006-2010 American Community Survey 5-Year Estimates". United States Census Bureau. Archived from the original on February 13, 2020. Retrieved July 12, 2015.
- ^ Leip, David. "Dave Leip's Atlas of U.S. Presidential Elections". uselectionatlas.org. Retrieved November 13, 2018.
| show Places adjacent to Warren County, Illinois |
|---|
External links[]
| show Municipalities and communities of Warren County, Illinois, United States |
|---|
| show Central Illinois |
|---|

| show Authority control |
|---|
- Illinois counties
- Warren County, Illinois
- 1825 establishments in Illinois
- Populated places established in 1825
- Galesburg, Illinois micropolitan area