1996 Atlantic hurricane season
| 1996 Atlantic hurricane season | |
|---|---|
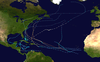
 Season summary map | |
| Seasonal boundaries | |
| First system formed | June 17, 1996 |
| Last system dissipated | November 26, 1996 |
| Strongest storm | |
| Name | Edouard |
| • Maximum winds | 145 mph (230 km/h) (1-minute sustained) |
| • Lowest pressure | 933 mbar (hPa; 27.55 inHg) |
| Seasonal statistics | |
| Total depressions | 13, 1 unofficial |
| Total storms | 13, 1 unofficial |
| Hurricanes | 9 |
| Major hurricanes (Cat. 3+) | 6 |
| Total fatalities | 256 total |
| Total damage | ~ $6.517 billion (1996 USD) |
| Related articles | |
The 1996 Atlantic hurricane season had the most major hurricanes since 1950, which are Category 3 or higher on the Saffir-Simpson scale.[1] The season was above-average, featuring a total of thirteen named storms, nine hurricanes, and six major hurricanes. The season officially began on June 1, 1996 and ended on November 30, 1996, dates which conventionally delimit the period of each year when most tropical cyclones form in the Atlantic basin. The season's first tropical cyclone, Tropical Storm Arthur, developed on June 17, while the final cyclone, Hurricane Marco dissipated on November 26. The most intense hurricane, Edouard, was a powerful Cape Verde-type hurricane that affected portions of the Mid-Atlantic states and New England. The season featured nine tropical cyclone landfalls, including six hurricanes, one of which was a major hurricane. In total, six major hurricanes formed during the 1996 Atlantic hurricane season—the highest number produced in a single season since 1950.
The four most notable tropical cyclones of the season were hurricanes Bertha, Cesar, Fran, and Hortense. Bertha made landfall as a Category 2 hurricane on the coast of North Carolina, causing a total of 12 deaths and $335 million (1996 USD) in damage. Hurricane Fran made landfall in the same general area a little over a month later as a Category 3 hurricane, causing 37 deaths and $5 billion in damage. Hurricane Cesar developed in the east Caribbean during late-July and crossed Nicaragua into the east Pacific as a strong tropical storm several days later, at which time it earned the name Douglas. The system produced strong winds and flooding, leading to 113 deaths and $202.96 million in damage. Finally, Hurricane Hortense formed in the east Atlantic during the month of September and crossed Hispaniola and Puerto Rico, causing 39 direct deaths and $158 million in damage. Collectively, the tropical cyclones of the 1996 Atlantic hurricane season caused $6.52 billion in damage and 256 deaths.
Seasonal forecasts[]
Pre-season forecasts[]
| Source | Date | Named storms |
Hurricanes | Major hurricanes |
Ref |
| CSU | December 1995 | 8 | 5 | 2 | [2] |
| WRC | Early 1996 | 11 | 5 | N/A | [3] |
| CSU | April | 11 | 7 | 3 | [2] |
| CSU | June | 10 | 6 | 2 | [2] |
| Record high activity | 30 | 15 | 7 | [4] | |
| Record low activity | 1 | 0 (tie) | 0 | [4] | |
| Actual activity | 13 | 9 | 6 | ||
Forecasts of hurricane activity are issued before each hurricane season by noted hurricane experts such as Dr. William M. Gray and his associates at Colorado State University (CSU) and the Weather Research Center (WRC). A normal season, as defined by the National Oceanic and Atmospheric Administration (NOAA), has 12.1 named storms, of these 6.4 reach hurricane strength, and 2.7 major hurricanes, which are Category 3 or higher on the Saffir–Simpson scale.[5] Additional, the 1950-2000 CSU average for a normal season is 9.6 named storms, of these 5.9 reach hurricane strength, and 2.3 become major hurricanes.[6] In December 1995, CSU predicted that only 8 named storms would form and 5 of those would become hurricanes; no specific number of major hurricanes was given. However, in April 1996, CSU revised their forecast, stating that 11 named storms would develop, with seven of those intensifying into a hurricane, and three reaching major hurricane intensity. In June, CSU predicted 10 named storms, 6 hurricanes, and 2 major hurricanes.[2] The forecast by the WRC in early 1996 was 10 named storms and 6 hurricanes, though there was no prediction on the number of major hurricanes.[3]
Seasonal summary[]


The 1996 Atlantic hurricane season officially began on June 1,[7] but the first named storm did not form until seventeen days later. It was an above average season in which 13 tropical cyclones formed, with all cyclones attaining tropical storm status. Nine of these sixteen attained hurricane status and six of those reached major hurricane status,[8] which was well above the 1980–2010 average of 2.7 per season.[5] Although there was neither an El Niño or a La Niña,[9] the above average activity in the season was likely due to abnormally warm sea surface temperatures.[8] Six hurricanes and three tropical storms made landfall during the season, causing 256 deaths and $6.52 billion in damage.[10] Hurricane Edouard and Hurricane Marco also caused damage and fatalities, but neither storm made an official landfall.[11][12]
Tropical cyclogenesis in the 1996 Atlantic hurricane season began with the development of Tropical Storm Arthur on June 17. In the month of July, two tropical cyclones formed, both of which later attained hurricane status. August was the most active month of the season, with a total of four storms developing in that period of time. The month of August also featured the strongest and costliest tropical cyclones of the season, Hurricane Edouard and Hurricane Fran, respectively.[8] Although September is the climatological peak of hurricane season,[13] only two tropical cyclones developed in that month. Despite this, both reached major hurricane status. Three tropical cyclones formed in October, with one attaining hurricane status. Finally, one tropical cyclone developed in November, Hurricane Marco. The storm lasted 10 days before dissipating on November 26,[8] only four days before the official end of the season on November 30.[7]
The season's activity was reflected with an Accumulated Cyclone Energy (ACE) index of 166.[1] ACE is, broadly speaking, a measure of the power of the hurricane multiplied by the length of time it existed, so storms that last a long time, as well as particularly strong hurricanes, have high ACEs. It is only calculated for full advisories on tropical systems at or exceeding 34 knots (39 mph, 63 km/h) or tropical storm strength.[14]
Systems[]
Tropical Storm Arthur[]
| Tropical storm (SSHWS) | |
  | |
| Duration | June 17 – June 21 |
|---|---|
| Peak intensity | 45 mph (75 km/h) (1-min) 1002 mbar (hPa) |
An area of increasing convection, possibly associated with a tropical wave, developed into Tropical Depression One on June 17 at 1800 UTC, while located near Grand Bahama. Initially, the depression moved north-northwestward and then northward around the western periphery of an Atlantic subtropical ridge. Despite moderately strong wind shear, the depression strengthened and was upgraded to Tropical Storm Arthur while re-curving northeastward at 0000 UTC on June 19. About 24 hours later, Arthur made landfall near Cape Lookout, North Carolina with winds of 45 mph (75 km/h). The storm weakened to a tropical depression early on June 20, before becoming extratropical the next day.[15]
As the center of Arthur passed east of Cape Romain, South Carolina, minor increases in surf were reported.[16] Rainfall peaked at 5.85 inches (149 mm) in Georgetown, South Carolina,[17] though because it fell gradually, no significant flooding was reported, other than minor ponding of water on roads.[15] In addition, Arthur also brought precipitation to Georgia and Virginia, though amounts rarely exceeded 3 inches (76 mm).[17] In North Carolina, swells ranged as high as 7 ft (2.1 m). A C-Man station located about 34.5 miles (55.5 km) southeast of Cape Fear reported sustained winds of 39 mph (64 km/h) and gusts up to 45 mph (75 km/h).[15] Overall, damage caused by Arthur was minimal, totaling only $1 million.[16]
Hurricane Bertha[]
| Category 3 hurricane (SSHWS) | |
  | |
| Duration | July 5 – July 14 |
|---|---|
| Peak intensity | 115 mph (185 km/h) (1-min) 960 mbar (hPa) |
A tropical wave developed into Tropical Depression Two at 0000 UTC on July 5, while located about 575 miles (925 km) east of Cape Verde. Twelve hours later, it was upgraded to Tropical Storm Bertha. Over the next few days, it continued to strengthen, becoming a hurricane on July 7, prior to moving through the northern Leeward Islands. A period of rapid intensification began late on July 8, with Bertha peaking as a Category 3 hurricane with winds of 115 mph (185 km/h) on the following day. Moving around the western periphery of a subtropical ridge, Bertha passed north of the Bahamas as a weakening hurricane before turning towards the north-northeast and re-strengthened. Late on July 12, Bertha made landfall between Wrightsville Beach and Topsail Beach, North Carolina with winds of 90 mph (140 km/h). Gradual weakening ensued the following day as Bertha moved up the Mid-Atlantic states and into New England before becoming extratropical on July 14.[18]
In the United States Virgin Islands, heavy rainfall and hurricane-force winds damaged about 2,500 homes, of which 43 lost their roofs. Many boats were destroyed. Total damage was estimated near $7.5 million.[19] The storm caused 3 deaths in Puerto Rico.[18] Additionally, damage in Puerto Rico totaled $7.5 million.[19] Two deaths were confirmed in Saint Martin.[18] The storm caused numerous power outages and damaged 10 homes in Antigua and Barbuda.[20] Four deaths occurred in Florida, three of which due to rip currents.[19] North Carolina bore the brunt of the hurricane in the United States. Storm surge destroyed several fishing piers, marinas, and boats. A combination of storm surge and strong winds damaged over 5,000 homes and buildings,[18] with at least 4 destroyed.[19] There were 2 deaths in the state. The remnants brought local flooding and minor wind damage to the Mid-Atlantic, New England,[18] and Atlantic Canada.[21] One surfer died in New Jersey.[18] Overall, the storm caused 12 deaths and about $285 million in damage, primarily in eastern North Carolina.[18][19]
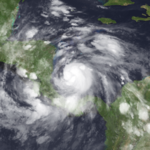
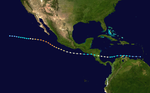
Hurricane Cesar[]
| Category 1 hurricane (SSHWS) | |
  | |
| Duration | July 24 – July 28 (Exited basin) |
|---|---|
| Peak intensity | 85 mph (140 km/h) (1-min) 985 mbar (hPa) |
A tropical wave emerged into the Atlantic from the west coast of Africa on July 17. It developed into Tropical Depression Three near Isla Margarita of Venezuela on July 24. The depression headed westward, steered by a strong high pressure area over the Bahamas. On July 25, the depression strengthened into Tropical Storm Cesar. Around that time, it struck Curaçao.[22] Cesar caused minor damage in the ABC islands to roofs and trees; one person drowned in heavy surf on Curçao.[23] An additional three people drowned offshore Venezuela.[24] In Colombia, heavy rainfall caused 3 deaths,[25] 2 of which were from a mudslide in Pueblo Bello.[26] Strong winds and significant amounts of precipitation lashed the Archipelago of San Andrés, Providencia and Santa Catalina, unroofing 60 homes,[27] and resulting in 11 fatalities,[28] and resulting in 800 million COP ($440,00 USD) in damage.[27] The storm continued westward and intensified into a hurricane on July 27.[22]
At 0400 UTC on July 28, Cesar made landfall near Bluefields, Nicaragua, with winds of 85 mph (140 km/h). After weakening to a tropical storm later that day, Cesar moved into the Pacific and was reclassified as Tropical Storm Douglas on July 29.[22] In Nicaragua, the storm wrought about $50.5 million in losses. More than 2,500 homes, 39 bridges and 25 miles (40 km) of roads were destroyed. The storm killed 42 people and left an estimated 100,000 homeless in Nicaragua.[29] In Costa Rica, river flooding damaged or destroyed 3,874 homes; 150 bridges were also destroyed. The road network was significantly damaged.[30] Across the country, at least 39 people were killed and damage amounted to $151 million.[31] Additionally, 12 people died in El Salvador.[32] Overall, Cesar caused 113 deaths and $202.96 million in damage.[33]
Hurricane Dolly[]
| Category 1 hurricane (SSHWS) | |
  | |
| Duration | August 19 – August 25 |
|---|---|
| Peak intensity | 80 mph (130 km/h) (1-min) 988 mbar (hPa) |
A tropical wave developed into Tropical Depression Four at 0600 UTC on August 19, while located west-southwest of Jamaica. The system strengthened into Tropical Storm Dolly about twelve hours later. Dolly headed westward and intensified into a Category 1 hurricane late on August 20. It then made landfall near Chetumal, Quintana Roo with winds of 75 mph (120 km/h). The system weakened to a tropical depression on August 21. Later that day or early on August 22, Dolly emerged into the Bay of Campeche and quickly re-strengthened into a tropical storm. The storm deepened further and was upgraded to a hurricane again at 1200 UTC on August 23; Dolly simultaneously peaked with winds of 80 mph (130 km/h). Around that time, it struck between Tuxpan, Veracruz and Tampico, Tamaulipas. Dolly quickly weakened to a tropical depression early on August 24, but remained intact while crossing Mexico and dissipated over the eastern Pacific Ocean on August 25.[34]
The storm brought heavy rainfall to much of Mexico, peaking at 37.41 inches (950 mm).[35] In Quintana Roo, flooding destroyed a large amount of farmlands. Widespread flooding occurred after a river in the Pueblo Viejo area overflowed its banks. Hundreds of homes were destroyed, displacing about 35,000 people. Large scale evacuations occurred in San Luis Potosí, while about 6,500 fled their homes in the Tampico area. Communications and power outages were reported as far west as Mazatlán, Sinaloa. Throughout Mexico, there were fourteen fatalities reported, six in Veracruz, three in Nuevo León, and one in Monterrey. Additionally, two people were left missing in Nuevo León.[34] The outer bands of Dolly brought rainfall to southern Texas, which caused minor flooding, but was mostly beneficial due to drought conditions in the state.[36]
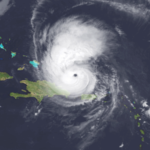
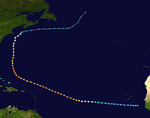
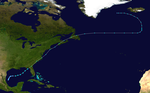
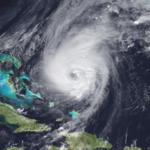
Hurricane Edouard[]
| Category 4 hurricane (SSHWS) | |
  | |
| Duration | August 19 – September 3 |
|---|---|
| Peak intensity | 145 mph (230 km/h) (1-min) 933 mbar (hPa) |
A tropical wave developed into Tropical Depression Five on August 19, while located about 345 miles (555 km) southeast of Cape Verde. The depression moved westward and strengthened into Tropical Storm Edouard on August 22. Further intensification occurred, with the storm being upgraded to a hurricane on the following day. Early on August 24, the storm re-curved west-northwestward and began to undergo rapid deepening. At 0600 UTC on August 25, Edouard attained its maximum sustained winds of 145 mph (230 km/h) and a minimum barometric pressure of 933 mbar (27.6 inHg); it was the most intense tropical cyclone of the season. The storm remained a major hurricane for nearly eight days. Edouard passed well north of the Lesser Antilles and then began re-curving northward on August 29. Later, the storm passed midway between Cape Hatteras and Bermuda on September 1.[11]
Edouard approached Nantucket, Massachusetts, but turned to the east before reaching land. On September 3, the storm weakened and became extratropical. It was absorbed by a larger system on September 7.[11] Edouard brought rough seas and gusty winds along the East Coast of the United States from South Carolina northward. Strong waves in New Jersey drowned 2 people. Minor erosion and coastal flooding also occurred in several states, especially in New York and Massachusetts.[36] In the latter, wind gusts up to 90 mph (145 km/h) left two-thirds of Nantucket, most of Cape Cod, and all of Martha's Vineyard without electricity. Gusty winds in Maine left about 1,900 without power in Portland.[37] Damage in the United States totaled about $20 million.[38] In Canada, the storm brought rainfall up to 5.35 inches (136 mm) and gusts to 75 mph (121 km/h). Rough seas disrupted ferry service and caused the closure of several beaches.[39]
Hurricane Fran[]
| Category 3 hurricane (SSHWS) | |
 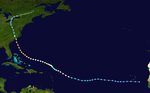 | |
| Duration | August 23 – September 8 |
|---|---|
| Peak intensity | 120 mph (195 km/h) (1-min) 946 mbar (hPa) |
A tropical wave developed into Tropical Depression Six on August 23, while located southeast of Cape Verde. The depression moved westward for several days and was upgraded to Tropical Storm Fran on August 27 while 1,035 miles (1,665 km) east of the Lesser Antilles. Fran tracked west-northwestward and intensified into a hurricane on August 29. However, Fran became less organized after a disruption to inflow due to Hurricane Edouard and weakened back to a tropical storm. Fran quickly re-intensified into a hurricane by August 31. While moving west-northwestward and then north-northwestward, the storm slowly strengthened. At 0000 UTC on September 5, Fran peaked as a Category 3 hurricane with maximum sustained winds of 120 mph (195 km/h) and a minimum barometric pressure of 946 mbar (27.9 inHg). Early on the following day, the storm made landfall near Cape Fear, North Carolina at the same intensity. Fran weakened and moved inland, becoming extratropical over Ontario on September 8. Its remnants moved over the Great Lakes and were absorbed by a front on September 10.[40]
In South Carolina, the outer bands of Fran produced high winds and light to moderate rainfall, downing numerous trees and power lines. As a result, a number of cars were damaged and over 63,000 people were left without electricity.[37] Damage in South Carolina reached about $40 million. The state of North Carolina bore the brunt of the storm. Wind gusts as strong as 137 mph (220 km/h) were reported. Additionally, storm tide heights ranging from 8 to 12 feet (2.4 to 3.7 m) lashed the coast.[40] Damage was most severe in the Raleigh area, exceeding $2 billion. Several hundred thousand falling trees damaged at least 10,000 homes. Throughout the state, approximately 1.7 million people were left without electricity. Damage in North Carolina reached about $5.1 billion, with about $2.3 billion to homes and businesses, $1.1 billion to public property, $1 billion to forestry and timber, and $700 million to agriculture.[41] Elsewhere, Fran brought flooding to several states, including Virginia, West Virginia, Maryland, Ohio, and Pennsylvania, as well as Washington, D.C. Outside North Carolina, effects were worst in Virginia, where flooding and winds left 400,000 people without electricity and caused about $350 million in damage.[37][40] Hurricane Fran was responsible for 37 deaths, with 24 of them in North Carolina.[42] Property damage in the United States was estimated at $5 billion.[43]
Tropical Storm Gustav[]
| Tropical storm (SSHWS) | |
  | |
| Duration | August 26 – September 2 |
|---|---|
| Peak intensity | 45 mph (75 km/h) (1-min) 1005 mbar (hPa) |
An area of disturbed weather, accompanied with a low-level circulation, emerged into the Atlantic from the west coast of Africa on August 24. It organized further over the next few days, becoming Tropical Depression Seven on August 26, while located about 150 miles (240 km) south of Cape Verde. With a ridge to its north, the system moved west-southwestward. Conditions were initially unfavorable for development due to outflow from Hurricane Fran. On August 28, the depression began moving northwestward due to an approaching trough. Around the same time, the influence from Fran decreased, allowing it to intensify into Tropical Storm Gustav on August 28.[44]
At 0000 UTC on August 29, Gustav reached its peak intensity as a 45 mph (75 km/h) and a minimum barometric pressure of 1,005 mbar (29.7 inHg). Thereafter, the trough previously causing the storm's northwestward motion transitioned into an upper-level low, increasing shear across the region. As a result, the storm slowly weakened and was downgraded to a tropical depression late on September 1. Gustav dissipated at 0600 UTC on the following day, while situated about 1,015 miles (1,633 km) east-northeast of the northernmost Lesser Antilles.[44]
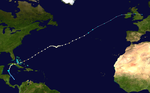
Hurricane Hortense[]
| Category 4 hurricane (SSHWS) | |
  | |
| Duration | September 3 – September 15 |
|---|---|
| Peak intensity | 140 mph (220 km/h) (1-min) 935 mbar (hPa) |
A tropical wave developed into Tropical Depression Eight on September 3, while located about halfway between the Lesser Antilles and Cape Verde. The depression headed westward and barely strengthened until becoming Tropical Storm Hortense early on September 7. Hortense passed over Guadeloupe on the following day and entered the Caribbean Sea. It strengthened into a hurricane on September 9 and then curved northwestward. The storm intensified slightly further, before making landfall near Guánica, Puerto Rico with winds of 80 mph (130 km/h) at 0600 UTC on September 10. It soon moved back offshore and brushed Dominican Republic while crossing the Mona Passage. After re-entering the Atlantic, Hortense substantially strengthened and peaked as a 140 mph (220 km/h) Category 4 hurricane early on September 13. Thereafter, the storm weakened as it tracked rapidly north-northeastward. Early on September 15, Hortense made landfall in Nova Scotia as a minimal Category 1 hurricane. It quickly weakened further to a tropical storm before re-entering the Atlantic and became extratropical later that day.[45]
The storm produced heavy rainfall and gusty winds as it passed through the Lesser Antilles.[45] On Guadeloupe, damage was most significant to crops, with over 50% of banana plantains destroyed.[46][47] Localized flooding was reported on Martinique.[48] Impact was most significant in Puerto Rico. Across the island, 11,463 houses were severely damaged.[45] About 1.4 million people on Puerto Rico were left without electricity – equivalent to about 40% of the island's population.[49] Damage in Puerto Rico was estimated at $153.4 million. There were also 19 deaths, most of which due to drowning during flash floods.[37] In the Dominican Republic, strong winds damaged a number of buildings and houses, and downed several power lines. Flooding also forced the closure of several roads and impacted 80% of crops in Samaná Province. At least 3 fatalities were confirmed in that country.[45] The storm brought strong winds to the Bahamas and Turks and Caicos Islands,[45][49] and lesser winds to Bermuda.[50][51] Later in its duration, Hortense struck Nova Scotia, bringing heavy rainfall and hurricane-force winds to isolated locations. There were many power outages, trees blown down, roofs torn away, and roads damaged in the province. New Brunswick, Newfoundland, and Prince Edward Island were also impacted, though not as severely as in Nova Scotia. Damage in Atlantic Canada reached approximately $3.64 million.[52]
Hurricane Isidore[]
| Category 3 hurricane (SSHWS) | |
  | |
| Duration | September 24 – October 1 |
|---|---|
| Peak intensity | 115 mph (185 km/h) (1-min) 960 mbar (hPa) |
A tropical wave with a well-defined circulation developed into Tropical Depression Nine at 1200 UTC on September 24, while located south of Cape Verde. Due to an anticyclone to its north, the depression initially moved west-northwestward. After convection wrapped around the circulation and banding features increased, the National Hurricane Center upgraded the depression to Tropical Storm Isidore on September 25. Isidore deepened further and began developing an eye feature. Early on September 26, the storm was upgraded to a hurricane. About 24 hours later, it reached Category 2 intensity. At 0000 UTC on September 28, Isidore attained its peak intensity with maximum sustained winds of 115 mph (185 km/h) and a minimum barometric pressure of 960 mbar (hPa; 28.35 inHg).[53]
After reaching peak intensity on September 28, steering current from a quasi-stationary mid- to upper-level low pressure area turned Isidore northward. Later that day, the eye feature disappeared and the storm began weakening due to strong upper-level winds. On September 28, Isidore weakened to a Category 2 hurricane. By the following day, it was downgraded to a Category 1 hurricane. Early on September 30, Isidore weakened to a tropical storm. The storm deteriorated further and was downgraded to a tropical depression at 1200 UTC on the following day. Because much of the deep convection diminished, Isidore was declared extratropical at 0000 UTC on October 1, while located about 490 miles (790 km) west-southwest of Flores Island in the Azores.[53]
Tropical Storm Josephine[]
| Tropical storm (SSHWS) | |
  | |
| Duration | October 4 – October 8 |
|---|---|
| Peak intensity | 70 mph (110 km/h) (1-min) 981 mbar (hPa) |
Tropical Depression Ten developed from the remnants of a cold front in the southwestern Gulf of Mexico on October 6. Moving generally eastward, the depression intensified into Tropical Storm Josephine on October 6. The next day, it peaked with winds of 70 mph (110 km/h). Josephine made landfall in Taylor County, Florida near peak intensity early on October 8. Shortly after moving inland, the storm became extratropical.[54] Early in its duration, the system interacted with a ridge, resulting in strong winds and high tides in Texas. The outer bands caused flooding rainfall in southern Texas,[55] and in Louisiana, high tides flooded roads and stranded residents on Grand Isle.[56] In Florida, the storm produced a storm surge reaching 9.3 feet (2.8 m) in Suwannee.[54] High tides flooded about 3,600 houses along the west coast.[55] Strong winds left about 400,000 people without power.[57] The storm also spawned at least 16 tornadoes, one of which damaged 130 homes.[55]
The extratropical remnants of Josephine moved along the eastern coast of the United States, producing wind gusts as strong as 77 mph (124 km/h) in St. Mary's County and in Ocean City, Maryland.[55] The winds caused widespread power outages, including 26,000 in Virginia and 31,000 in New Jersey.[55][58] Heavy rainfall flooded low-lying areas and rivers along the storm's path, including in North Carolina which had previously been affected by hurricanes Bertha and Fran earlier in the year.[55] In the Southeastern United States, the storm contributed to dozens of traffic accidents, which killed a person each in Georgia, North Carolina, and Virginia.[59] Damage throughout the United States totaled about $130 million.[54] Josephine later moved offshore, and after passing southeast of Cape Cod, moved through Atlantic Canada with moderate rainfall and gusty winds.[60]
Tropical Storm Kyle[]
| Tropical storm (SSHWS) | |
  | |
| Duration | October 11 – October 12 |
|---|---|
| Peak intensity | 50 mph (85 km/h) (1-min) 1001 mbar (hPa) |
A tropical wave exited the west coast of Africa on September 27 and crossed the Atlantic and Caribbean before eventually developing into Tropical Depression Eleven on October 11. The depression drifted slowly southwestward and strengthened into Tropical Storm Kyle later that day. Slightly further intensification occurred and Kyle peaked as a 50 mph (85 km/h) tropical storm early on October 12. However, upper-level southwesterly shear caused Kyle to quickly weaken back to a tropical depression later that day. At 1800 UTC on October 12, Kyle made landfall in eastern Guatemala with winds of 30 mph (45 km/h). By early on October 13, the storm had completely dissipated inland.[61]
Portions of the coasts of Belize, Guatemala, Honduras, and Mexico were under a tropical storm warning or hurricane watch as Kyle was approaching; however they were cancelled after Kyle weakened back to a tropical depression.[61] Impact from Kyle was minimal and limited to light rainfall in the countries of Belize, Guatemala, Honduras, and the Yucatán Peninsula of Mexico. In Belize, rainfall peaked at 2.32 inches (59 mm).[62] Rainfall to the northwest of the center of Kyle was heavier, with some areas of Mexico's Yucatán Peninsula receiving over 3 inches (76 mm); precipitation peaked at 5.71 inches (145 mm) in Tulum.[63]
Hurricane Lili[]
| Category 3 hurricane (SSHWS) | |
  | |
| Duration | October 14 – October 27 |
|---|---|
| Peak intensity | 115 mph (185 km/h) (1-min) 960 mbar (hPa) |
A tropical wave developed into Tropical Depression Twelve on October 14. After the storm formed, further strengthening of Lili was gradual, first to tropical storm status on October 16 and then to hurricane status on October 17. The next day, Lili made landfall in Matanzas Province, Cuba with winds of 100 mph (155 km/h) and moved across the central portion of the island;[64] it was first hurricane to hit the country since Kate in 1985.[65] After emerging into the Atlantic Ocean, the hurricane accelerated northeastward, briefly peaking as a Category 3 hurricane with winds of 115 mph (185 km/h) near the Bahamas on October 19. For almost an entire week, Hurricane Lili oscillated in intensity while fluctuating several times in forward speed. About two weeks passed before Lili transitioned into an extratropical storm north of the Azores on October 27, which subsequently moved across Ireland and Great Britain.[64]
Early in its duration, Lili caused flooding in Central America that left thousands homeless and killed 14 people.[64] In Cuba, 269,995 people were evacuated in advance of Lili, resulting in no deaths in the country.[66] Damage was heaviest in Cuba, mostly due to the hurricane's heavy rainfall peaking at 29.41 inches (747 mm).[67] The hurricane affected 11 Cuban provinces, damaging 92,542 houses and destroying another 6,369. The rains heavily damaged the sugar cane and banana crops.[68] Overall, damage in the country was estimated at $362 million.[69] In nearby Florida, one person died after being swept into a drain during the storm's heavy rains.[70] Moisture from Lili also fueled a storm that struck the northeastern United States, which contributed indirectly to a death when a man in Maine tried to drive across a flooded roadway.[55] Damage in the Bahamas was not severe and was limited to some damaged roofs and downed trees.[71] When the remnants of Lili struck Ireland and the United Kingdom, it produced strong winds and high seas that damaged hundreds of houses, causing $300 million in damage and six deaths.[72]
Hurricane Marco[]
| Category 1 hurricane (SSHWS) | |
  | |
| Duration | November 16 – November 26 |
|---|---|
| Peak intensity | 75 mph (120 km/h) (1-min) 983 mbar (hPa) |
A cold front interacted with several tropical waves, eventually spawning Tropical Depression Thirteen late on November 16, while southwest of Jamaica. Initially a tropical depression, it remained weak while tracking southwestward and eventually southward. On November 19, the depression intensified into Tropical Storm Marco. It re-curved eastward and continued to strengthen, briefly becoming a hurricane on November 20. Marco weakened back to a tropical storm later that day. The storm turned northeastward toward Hispaniola, but later became stationary before curing eastward. Afterwards Marco doubled-back to the west. After weakening to a tropical depression on November 23, Marco became a tropical storm again on the following day. Thereafter, it tracked northwestward while fluctuating in intensity, before dissipating on November 26.[12]
Although it did not make landfall, Marco produced heavy rainfall in the Greater Antilles and Central America, which caused significant flooding in some areas.[12] In Honduras, 4,000 homes were destroyed, 40 bridges washed away,[73] and nearly 50,000 acres of fruit plantations were flooded.[74] Nine deaths were also reported.[73] Flood damage in other Central American countries was also reported, though affects were less severe.[12] Heavy rainfall was also reported in Cuba.[75] Marco also contributed to an ongoing flood in Jamaica and caused three additional fatalities in Dominican Republic.[76][77] Overall, Marco caused 15 fatalities and approximately $8.2 million in damage.[73][76][77][78][79]
Other system[]

On September 13, a rare low-pressure area moved into Lake Huron where it gained subtropical characteristics. It reached its peak intensity of 73 mph (117 km/h) and a central pressure of 993 mbar (29.32 inHg), before making landfall in southwestern Ontario and dissipating soon afterward. The cyclone was dubbed "Hurricane Huron", as it maintained subtropical characteristics while situated over Lake Huron. The Lake Huron cyclone caused heavy rainfall and flooding across Michigan and Eastern Canada, as well as parts of Wisconsin, Pennsylvania, and the Northeast Coast.[80][81]
Storm names[]
The following names were used for named storms that formed in the north Atlantic in 1996.[82] The names not retired from this list were used again in the 2002 season.[83] This is the same list used for the 1990 season except for Dolly and Kyle, which replaced Diana and Klaus, respectively.[84] A storm was named Kyle for the first time in 1996. The name Dolly was previously used in 1953, 1954, 1968 and 1974. Names that were not assigned are marked in gray.
|
Retirement[]
The World Meteorological Organization retired three names in the spring of 1997: Cesar, Fran, and Hortense.[85] They were replaced in the 2002 season by Cristobal, Fay, and Hanna.[83]
Season effects[]
This is a table of all of the storms that formed in the 1996 Atlantic hurricane season. It includes their duration, names, landfall(s) – denoted by bold location names – damages, and death totals. Deaths in parentheses are additional and indirect (an example of an indirect death would be a traffic accident), but are still related to that storm. Damage and death include totals while a tropical cyclone was in its pre-formative or post-formative stages.
| Saffir–Simpson scale | ||||||
| TD | TS | C1 | C2 | C3 | C4 | C5 |
| Storm name |
Dates active | Storm category
at peak intensity |
Max 1-min wind mph (km/h) |
Min. press. (mbar) |
Areas affected | Damage (USD) |
Deaths | Ref(s)
| ||
|---|---|---|---|---|---|---|---|---|---|---|
| Arthur | June 17 – 21 | Tropical storm | 45 (75) | 1004 | North Carolina | $1 million | None | |||
| Bertha | July 5 – 14 | Category 3 hurricane | 115 (185) | 960 | Leeward Islands, Puerto Rico, Southeastern United States, Mid-Atlantic States, New England | $335 million | 12 | |||
| Cesar | July 24 – 28 | Category 1 hurricane | 85 (140) | 985 | Curaçao, Central America, Colombia, Venezuela, Mexico | $203 million | 113 | |||
| Dolly | August 19 – 26 | Category 1 hurricane | 80 (130) | 989 | East Mexico, Texas | None | 14 | |||
| Edouard | August 19 – September 3 | Category 4 hurricane | 145 (230) | 933 | Southeastern United States, Mid-Atlantic states, New England, Nova Scotia | $20 million | 2 | |||
| Fran | August 23 – September 8 | Category 3 hurricane | 120 (195) | 946 | Southeastern United States, Mid-Atlantic states, Midwestern United States, New England, Ontario | $5 billion | 37 | |||
| Gustav | August 26 – September 2 | Tropical storm | 45 (75) | 1005 | none | None | None | |||
| Hortense | September 3 – 16 | Category 4 hurricane | 140 (220) | 935 | Lesser Antilles, Puerto Rico, Dominican Republic, Bahamas, Atlantic Canada | $158 million | 39 | |||
| Isidore | September 24 – October 1 | Category 3 hurricane | 115 (185) | 960 | None | None | None | |||
| Josephine | October 4 – 8 | Tropical storm | 70 (110) | 981 | Gulf Coast of the United States, Southeastern United States, Mid-Atlantic states, New England, Atlantic Canada | $130 million | 0 (3) | |||
| Kyle | October 11 – 13 | Tropical storm | 50 (85) | 1001 | Central America, Mexico | None | None | |||
| Lili | October 14 – 27 | Category 3 hurricane | 115 (185) | 960 | Central America, Cuba, Bahamas, Ireland, United Kingdom | $662 million | 22 | |||
| Marco | November 16 – 26 | Category 1 hurricane | 75 (120) | 983 | Central America, Greater Antilles | $8.2 million | 14 | |||
| Season aggregates | ||||||||||
| 13 systems | June 17 – November 26 | 145 (230) | 933 | $6.52 billion | 253 (3) | |||||
See also[]
- Atlantic hurricane season
- List of Atlantic hurricanes
- 1996 Pacific hurricane season
- 1996 Pacific typhoon season
- 1996 North Indian Ocean cyclone season
- South-West Indian Ocean cyclone seasons: 1995–96, 1996–97
- Australian region cyclone seasons: 1995–96, 1996–97
- South Pacific cyclone seasons: 1995–96, 1996–97
- Mediterranean tropical-like cyclone
References[]
- ^ a b Atlantic basin Comparison of Original and Revised HURDAT. Hurricane Research Division (Report). National Oceanic and Atmospheric Administration. March 2011. Retrieved July 23, 2011.
- ^ a b c d Forecast Verifications (Report). Colorado State University. 2012. Archived from the original on December 14, 2013. Retrieved August 3, 2013.
- ^ a b Jill F. Hasling (May 1, 2008). Comparison of Weather Research Center's OCSI Atlantic Annual Seasonal Hurricane Forecasts with Colorado State Professor Bill Gray's Seasonal Forecast (PDF) (Report). Weather Research Center. Archived from the original (PDF) on July 18, 2011. Retrieved August 3, 2013.
- ^ a b "Atlantic hurricane best track (HURDAT version 2)" (Database). United States National Hurricane Center. May 25, 2020.
- ^ a b Background information: the North Atlantic Hurricane Season. Climate Prediction Center (Report). National Oceanic and Atmospheric Administration. August 4, 2011. Retrieved September 17, 2011.
- ^ Philip J. Klotzbach; William M. Gray (December 8, 2006). Extended Range Forecast of Atlantic Seasonal Hurricane Activity and U.S. Landfall Strike Probability for 2007 (Report). Colorado State University. Archived from the original on December 18, 2006. Retrieved July 1, 2012.
- ^ a b "Expert: 7 hurricanes are on tap". The Daily News. Associated Press. April 5, 1996. Retrieved August 3, 2013.
- ^ a b c d Pasch, Richard; Avila, Lixion (May 1999). "Atlantic Hurricane Season of 1996" (PDF). National Hurricane Center. Retrieved September 25, 2011.
- ^ Cold and Warm Episode by Season. Climate Prediction Center (Report). National Oceanic and Atmospheric Administration. July 5, 2013. Retrieved August 3, 2013.
- ^ Storm Data and Unusual Weather Phenomena (PDF). National Climatic Data Center (Report). National Oceanic and Atmospheric Administration. June 1996. Archived from the original (PDF) on May 13, 2021. Retrieved May 13, 2021.
- Storm Data and Unusual Weather Phenomena (PDF). National Climatic Data Center (Report). National Oceanic and Atmospheric Administration. July 1996. pp. 39–40, 194–195. Archived from the original (PDF) on May 13, 2021. Retrieved May 13, 2021.
- Miles B. Lawrence (November 9, 1996). Preliminary Report: Hurricane Bertha (PDF). National Hurricane Center (Report). National Oceanic and Atmospheric Administration. Retrieved May 19, 2021.
- Richard J. Quirk III (October 15, 1999). Annex B to USCINCSO FuncPlan 6150-98 (Report). Center for Disaster Management and Humanitarian Assistance. Archived from the original (DOC) on July 25, 2011. Retrieved September 26, 2010.
- "Hurricane Douglas leaves at least 35 dead as it crosses from Caribbean to Pacific". ReliefWeb. Associated Press. July 30, 1996. Retrieved September 26, 2010.
- "Three dead after Cesar storms Caracas". Hamilton Spectator. July 27, 1996.
- "San Andrés Toma Aire Luego Del Huracán César" (in Spanish). El Tiempo. July 29, 1996. Archived from the original on September 29, 2012. Retrieved September 27, 2010.
- Hurricanes and tropical storms in the Netherlands Antilles and Aruba (PDF) (Report). Meteorological Service of the Netherlands Antilles and Aruba. Archived from the original (PDF) on April 2, 2012. Retrieved November 6, 2011.
- Effects of the Damage Caused by Hurricane Cesar on the Development of Costa Rica in 1996 (PDF) (Report). United Nations Economic Commission for Latin America and the Caribbean. October 23, 1996. Archived from the original (PDF) on February 10, 2016. Retrieved January 14, 2013.
- International Disaster Database (Report). Centre for Research on the Epidemiology of Disasters. 2013. Retrieved January 14, 2013.
- Hurricane Cesar Nicaragua 1996 (Report). Global Facility for Disaster Reduction and Recovery. 2013. Archived from the original on February 1, 2014. Retrieved January 14, 2013.
- "Three dead after Cesar storms Caracas". Hamilton Spectator. July 27, 1996.
- Edward N. Rappaport (October 3, 1996). Preliminary Report: Hurricane Dolly (PDF). National Hurricane Center (Report). National Oceanic and Atmospheric Administration. Retrieved May 19, 2021.
- Richard J. Pasch (December 20, 1996). Preliminary Report: Hurricane Edouard (PDF). National Hurricane Center (Report). National Oceanic and Atmospheric Administration. Retrieved May 19, 2021.
- Storm Data and Unusual Weather Phenomena (PDF). National Climatic Data Center (Report). National Oceanic and Atmospheric Administration. August 1996. Archived from the original (PDF) on May 13, 2021. Retrieved May 13, 2021.
- Storm Data and Unusual Weather Phenomena (PDF). National Climatic Data Center (Report). National Oceanic and Atmospheric Administration. September 1996. Archived from the original (PDF) on May 13, 2021. Retrieved May 13, 2021.
- Eric S. Blake; Ethan J. Gibney (August 2011). The deadliest, costliest and most intense United States tropical cyclones from 1851 to 2010 (and other frequently requested hurricane facts) (PDF). National Hurricane Center (Report). National Oceanic and Atmospheric Administration. Retrieved August 2, 2013.
- B. Max Mayfield (October 10, 1996). Preliminary Report: Hurricane Fran (PDF). National Hurricane Center (Report). National Oceanic and Atmospheric Administration. Retrieved May 19, 2021.
- North Carolina Hit By Frantastic Storm!. National Climatic Data Center (Report). National Oceanic and Atmospheric Administration. Retrieved August 2, 2013.
- Jonathan Blaes. Hurricane Fran, September 1996 (Report). North Carolina State University. Retrieved August 2, 2013.
- Lixion A. Avila (October 23, 1996). Preliminary Report: Hurricane Hortense (PDF). National Hurricane Center (Report). National Oceanic and Atmospheric Administration. Retrieved May 19, 2021.
- 1996-Hortense (Report). Environment Canada. September 14, 2010. Archived from the original on March 13, 2013. Retrieved May 13, 2021.
- Richard J. Pasch (February 21, 1997). Preliminary Report: Tropical Storm Josephine (PDF). National Hurricane Center (Report). National Oceanic and Atmospheric Administration. Retrieved May 19, 2021.
- Storm Data and Unusual Weather Phenomena (PDF). National Climatic Data Center (Report). National Oceanic and Atmospheric Administration. October 1996. Archived from the original (PDF) on May 13, 2021. Retrieved May 13, 2021.
- "Floridians Mop Up After Josephine". The Deseret News. Associated Press. October 9, 1996. Retrieved August 2, 2013.
- Roger Pielke; Jose Rubiera; Christopher W. Landsea; Mario Fernandez; Roberta Klein (August 2003). "Hurricane Vulnerability in Latin America and The Caribbean: Normalized Damage and Loss Potentials" (PDF). Natural Hazards Review. National Oceanic and Atmospheric Administration. Retrieved August 3, 2013.
- David Longshore (1998). Encyclopedia of Hurricanes, Typhoons, and Cyclones, New Edition. Facts on File. p. 110. ISBN 9781438118796. Retrieved August 3, 2013.
- "Hurricane Marco weakens; Flooding Kills 9 In Honduras". Syracuse Herald-Journal. November 23, 1996.
- "Marco, downgraded to tropical storm, nears Jamaica". Reliefweb. Reuters. November 20, 1996. Retrieved March 21, 2013.
- "Haiti, Dominican Republic may face floods, mudslides". News and Record. November 23, 1996.
- Llyod Williams (November 20, 1996). "Marco swamps homes in Honduras". Star-Banner. Associated Press. Retrieved March 21, 2013.
- Honduras Floods Situation Report No. 5. UN Department of Humanitarian Affairs (Report). ReliefWeb. December 5, 1996. Retrieved March 21, 2013.
- ^ a b c Richard J. Pasch (December 20, 1996). Preliminary Report: Hurricane Edouard (PDF). National Hurricane Center (Report). National Oceanic and Atmospheric Administration. Retrieved May 19, 2021.
- ^ a b c d Lixion A. Avila (December 3, 1996). Preliminary Report: Hurricane Marco (PDF). National Hurricane Center (Report). National Oceanic and Atmospheric Administration. Retrieved May 19, 2021.
- ^ Dorst, Neal (January 21, 2010). "Subject: G1) When is hurricane season ?". National Oceanic and Atmospheric Administration. Retrieved September 25, 2011.
- ^ David Levinson (August 20, 2008). 2005 Atlantic Ocean Tropical Cyclones. National Climatic Data Center (Report). National Oceanic and Atmospheric Administration. Retrieved July 23, 2011.
- ^ a b c B. Max Mayfield (August 19, 1996). Preliminary Report: Tropical Storm Arthur (PDF). National Hurricane Center (Report). National Oceanic and Atmospheric Administration. Retrieved May 19, 2021.
- ^ a b Storm Data and Unusual Weather Phenomena (PDF). National Climatic Data Center (Report). National Oceanic and Atmospheric Administration. June 1996. Archived from the original (PDF) on May 13, 2021. Retrieved May 13, 2021.
- ^ a b David M. Roth (November 25, 2011). Tropical Storm Arthur June 17–20, 1996 (Report). Weather Prediction Center. Retrieved November 26, 2011.
- ^ a b c d e f g Miles B. Lawrence (November 9, 1996). Preliminary Report: Hurricane Bertha (PDF). National Hurricane Center (Report). National Oceanic and Atmospheric Administration. Retrieved May 19, 2021.
- ^ a b c d e Storm Data and Unusual Weather Phenomena: July 1996 (PDF). National Climatic Data Center (Report). National Oceanic and Atmospheric Administration. pp. 39–40, 194–195. Archived from the original (PDF) on May 13, 2021. Retrieved May 13, 2021.
- ^ Caribbean Hurricane Bertha, DHA-Geneva Information Report No 3, 9 July 1996. UN Department of Humanitarian Affairs (Report). ReliefWeb. July 9, 1996. Retrieved February 22, 2013.
- ^ 1996-Bertha (Report). Environment Canada. September 14, 2010. Archived from the original on March 13, 2013. Retrieved May 13, 2021.
- ^ a b c Miles B. Lawrence (August 27, 1996). Preliminary Report: Hurricane Cesar (PDF). National Hurricane Center (Report). National Oceanic and Atmospheric Administration. Retrieved May 19, 2021.
- ^ Hurricanes and tropical storms in the Netherlands Antilles and Aruba (PDF) (Report). Meteorological Service of the Netherlands Antilles and Aruba. Archived from the original (PDF) on April 2, 2012. Retrieved November 6, 2011.
- ^ "Three dead after Cesar storms Caracas". Hamilton Spectator. July 27, 1996.
- ^ Richard J. Quirk III (October 15, 1999). Annex B to USCINCSO FuncPlan 6150-98 (Report). Center for Disaster Management and Humanitarian Assistance. Archived from the original (DOC) on July 25, 2011. Retrieved September 26, 2010.
- ^ "Caesar Blamed for Avalanche". Lakeland Ledger. July 28, 1996. Retrieved August 3, 2013.
- ^ a b "San Andrés Toma Aire Luego Del Huracán César" (in Spanish). El Tiempo. July 29, 1996. Archived from the original on September 29, 2012. Retrieved September 27, 2010.
- ^ "Hurricane Douglas leaves at least 35 dead as it crosses from Caribbean to Pacific". ReliefWeb. Associated Press. July 30, 1996. Retrieved September 26, 2010.
- ^ (in Spanish) Análisis Probabilista De Amenazas y Riesgos Naturales Revisión De Eventos Históricos Importantes (PDF) (Report). Enfoque Integral Para El Análisis Probabilista Del Riesgo. 2009. p. 53. Archived from the original (PDF) on March 13, 2012. Retrieved September 27, 2010.
- ^ Costa Rica - Hurricane Cesar Situation Report No. 5, 23 August 1996. United Nations Department of Humanitarian Affairs (Report). ReliefWeb. August 23, 1996. Retrieved January 22, 2010.
- ^ Effects of the Damage Caused by Hurricane Cesar on the Development of Costa Rica in 1996 (PDF) (Report). United Nations Economic Commission for Latin America and the Caribbean. October 23, 1996. Archived from the original (PDF) on February 10, 2016. Retrieved January 14, 2013.
- ^ Hurricane Cesar Kills 28 in Central America (Report). ReliefWeb. Reuters. July 29, 1996. Retrieved January 22, 2010.
- ^ Hurricanes and tropical storms in the Netherlands Antilles and Aruba (PDF) (Report). Meteorological Service of the Netherlands Antilles and Aruba. Archived from the original (PDF) on April 2, 2012. Retrieved November 6, 2011.
- "Three dead after Cesar storms Caracas". Hamilton Spectator. July 27, 1996.
- Richard J. Quirk III (October 15, 1999). Annex B to USCINCSO FuncPlan 6150-98 (Report). Center for Disaster Management and Humanitarian Assistance. Archived from the original (DOC) on July 25, 2011. Retrieved September 26, 2010.
- "Hurricane Douglas leaves at least 35 dead as it crosses from Caribbean to Pacific". ReliefWeb. Associated Press. July 30, 1996. Retrieved September 26, 2010.
- "San Andrés Toma Aire Luego Del Huracán César" (in Spanish). El Tiempo. July 29, 1996. Archived from the original on September 29, 2012. Retrieved September 27, 2010.
- (in Spanish) Análisis Probabilista De Amenazas y Riesgos Naturales Revisión De Eventos Históricos Importantes (PDF) (Report). Enfoque Integral Para El Análisis Probabilista Del Riesgo. 2009. p. 53. Archived from the original (PDF) on March 13, 2012. Retrieved September 27, 2010.
- Hurricane Cesar Kills 28 in Central America (Report). ReliefWeb. Reuters. July 29, 1996. Retrieved January 22, 2010.
- Effects of the Damage Caused by Hurricane Cesar on the Development of Costa Rica in 1996 (PDF) (Report). United Nations Economic Commission for Latin America and the Caribbean. October 23, 1996. Archived from the original (PDF) on February 10, 2016. Retrieved January 14, 2013.
- ^ a b Edward N. Rappaport (October 3, 1996). Preliminary Report: Hurricane Dolly (PDF). National Hurricane Center (Report). National Oceanic and Atmospheric Administration. Retrieved May 19, 2021.
- ^ Roth, David M. (October 18, 2017). "Tropical Cyclone Point Maxima". Tropical Cyclone Rainfall Data. United States Weather Prediction Center. Retrieved November 26, 2017.
- ^ a b Storm Data and Unusual Weather Phenomena (PDF). National Climatic Data Center (Report). National Oceanic and Atmospheric Administration. August 1996. Archived from the original (PDF) on May 13, 2021. Retrieved May 13, 2021.
- ^ a b c d Storm Data and Unusual Weather Phenomena (PDF). National Climatic Data Center (Report). National Oceanic and Atmospheric Administration. September 1996. Archived from the original (PDF) on May 13, 2021.
- ^ Eric S. Blake; Ethan J. Gibney (August 2011). The deadliest, costliest and most intense United States tropical cyclones from 1851 to 2010 (and other frequently requested hurricane facts) (PDF). National Hurricane Center (Report). National Oceanic and Atmospheric Administration. Retrieved August 2, 2013.
- ^ 1996-Edouard (Report). Environment Canada. September 14, 2010. Archived from the original on March 13, 2013. Retrieved May 13, 2021.
- ^ a b c B. Max Mayfield (October 10, 1996). Preliminary Report: Hurricane Fran (PDF). National Hurricane Center (Report). National Oceanic and Atmospheric Administration. Retrieved May 19, 2021.
- ^ North Carolina Hit By Frantastic Storm!. National Climatic Data Center (Report). National Oceanic and Atmospheric Administration. Retrieved August 2, 2013.
- ^ Jonathan Blaes. Hurricane Fran, September 1996 (Report). North Carolina State University. Retrieved August 2, 2013.
- ^ Costliest U.S. tropical cyclones tables updated (PDF) (Report). Miami, Florida: National Hurricane Center. January 26, 2018. Retrieved February 4, 2018.
- ^ a b Miles B. Lawrence (November 28, 1996). Preliminary Report: Tropical Storm Gustav (PDF). National Hurricane Center (Report). National Oceanic and Atmospheric Administration. Retrieved May 19, 2021.
- ^ a b c d e Lixion A. Avila (October 23, 1996). Preliminary Report: Hurricane Hortense (PDF). National Hurricane Center (Report). National Oceanic and Atmospheric Administration. Retrieved May 19, 2021.
- ^ (in French) M. Louis-Ferdinand (June 26, 2000). Session ordinaire de 1999-2000: Rapport d'information (PDF) (Report). SÉNAT. p. 56. Retrieved August 3, 2013.
- ^ Aain Yacou (January 1999). Les catastrophes naturelles aux Antilles: D'une Soufrière à une autre (in French). KARTHALA Editions, 1999. p. 200. ISBN 9782865378654.
- ^ Pascal Saffache (2006). Dossier spécial environnement: Micro insularité et dégradations des milieux marins : l'exemple de la Caraïbe (in French). Editions Publibook, 2006. p. 36. ISBN 9782748331677. Retrieved October 19, 2011.
- ^ a b "Hortense Grows Stronger, Moves North Through Atlantic". The Augusta Chronicle. September 12, 1996.
- ^ History for Saint David's, Bermuda (Report). Weather Underground. Archived from the original on November 4, 2014. Retrieved May 13, 2021.
- ^ History for Saint David's, Bermuda (Report). Weather Underground. Archived from the original on November 4, 2014. Retrieved May 13, 2021.
- ^ 1996-Hortense (Report). Environment Canada. September 14, 2010. Archived from the original on March 13, 2013. Retrieved May 13, 2021.
- ^ a b Edward N. Rappaport (November 1, 1996). Preliminary Report: Hurricane Isidore (PDF). National Hurricane Center (Report). National Oceanic and Atmospheric Administration. Retrieved May 19, 2021.
- ^ a b c Richard J. Pasch (February 21, 1997). Preliminary Report: Tropical Storm Josephine (PDF). National Hurricane Center (Report). National Oceanic and Atmospheric Administration. Retrieved May 19, 2021.
- ^ a b c d e f g Storm Data and Unusual Weather Phenomena (PDF). National Climatic Data Center (Report). National Oceanic and Atmospheric Administration. October 1996. Archived from the original (PDF) on May 13, 2021. Retrieved May 13, 2021.
- ^ "Storm hits Gulf Coast". The Southeast Missourian. Associated Press. October 7, 1996. Retrieved August 2, 2013.
- ^ "Hurricane Josephine Leaves Behind Soggy Coast". Williamson Daily News. Associated Press. October 9, 1996. Retrieved June 30, 2013.
- ^ (subscription required) Jon Frank (October 9, 1996). "Speedy Storm Stirs up a Mess Tropical Storm Josephine Dumped 5 Inches of Rain Tuesday on Hampton Roads, Flooding Streets and Knocking Out Power to 26,000 Customers. Its Winds, Which Exceeded 60 MPH, Caused Scattered Damage But No Fatalities". The Virginian Pilot. Archived from the original on October 22, 2012. Retrieved August 2, 2013.
- ^ "Floridians Mop Up After Josephine". The Deseret News. Associated Press. October 9, 1996. Retrieved August 2, 2013.
- ^ 1996-Josephine (Report). Environment Canada. September 14, 2010. Archived from the original on March 13, 2013. Retrieved May 13, 2021.
- ^ a b B. Max Mayfield (November 5, 1996). Preliminary Report: Tropical Storm Kyle (PDF). National Hurricane Center (Report). National Oceanic and Atmospheric Administration. Retrieved May 19, 2021.
- ^ Amy Benoit Frappier; Dork Sahagian; Scott J. Carpenter; Luis A. González; Brian R. Frappier (February 2007). "Stalagmite stable isotope record of recent tropical cyclone events". Geology. 35 (2): 111–114. Bibcode:2007Geo....35..111B. doi:10.1130/G23145A.1. Retrieved February 5, 2021.
- ^ David M. Roth (May 6, 2009). Tropical Storm Kyle – October 10–13, 1996 (Report). Weather Prediction Center. Retrieved August 3, 2013.
- ^ a b c Miles B. Lawrence (November 18, 1996). Preliminary Report: Hurricane Lili (PDF). National Hurricane Center (Report). National Oceanic and Atmospheric Administration. Retrieved May 19, 2021.
- ^ "Hurricane Lili closes in on Cuba". ReliefWeb. Agence France-Presse. October 17, 1996. Retrieved September 7, 2013.
- ^ Hurricane Lili Situation Report No. 2. International Federation of Red Cross and Red Crescent Societies (Report). ReliefWeb. March 4, 1997. Retrieved August 3, 2013.
- ^ (in Spanish) Lluvias intensas observadas y grandes inundaciones reportadas (Report). Instituto Nacional de Recursos Hidráulicos. 2003. Archived from the original on June 3, 2012. Retrieved August 3, 2013.
- ^ Hurricane Lili Situation Report No. 8. United Nations Department of Humanitarian Affairs (Report). ReliefWeb. October 28, 1996. Retrieved August 3, 2013.
- ^ Roger Pielke; Jose Rubiera; Christopher W. Landsea; Mario Fernandez; Roberta Klein (August 2003). "Hurricane Vulnerability in Latin America and The Caribbean: Normalized Damage and Loss Potentials" (PDF). Natural Hazards Review. National Oceanic and Atmospheric Administration. Retrieved August 3, 2013.
- ^ Pablo Alfonso; Peter Whoriskey; Cyril T. Zaneski (October 19, 1996). "S. Florida dodges another one". The Miami Herald. Archived from the original on September 19, 2012. Retrieved August 3, 2013.
- ^ John Garver (January 3, 2003). Some effects of Hurricane Lili (Oct 1996) (Report). Union College. Archived from the original on May 14, 2011. Retrieved August 3, 2013.
- ^ David Longshore (1998). Encyclopedia of Hurricanes, Typhoons, and Cyclones, New Edition. Facts on File. p. 110. ISBN 9781438118796. Retrieved August 3, 2013.
- ^ a b c "Hurricane Marco weakens; Flooding Kills 9 In Honduras". Syracuse Herald-Journal. November 23, 1996.
- ^ "Marco sputters; rain pelts Honduras". Sarasota Herald-Tribune. Associated Press. November 21, 1996. Retrieved March 21, 2013.
- ^ "Stubborn Marco keeps raining on Cuba". Portsmouth Daily Times. Associated Press. November 26, 1996. Retrieved March 21, 2013.
- ^ a b "Marco, downgraded to tropical storm, nears Jamaica". Reliefweb. Reuters. November 20, 1996. Retrieved March 21, 2013.
- ^ a b "Haiti, Dominican Republic may face floods, mudslides". News and Record. November 23, 1996.
- ^ Llyod Williams (November 20, 1996). "Marco swamps homes in Honduras". Star-Banner. Associated Press. Retrieved March 21, 2013.
- ^ Honduras Floods Situation Report [sic] No.5. UN Department of Humanitarian Affairs (Report). ReliefWeb. December 5, 1996. Retrieved March 21, 2013.
- ^ Todd J. Miner (Penn State University); Peter J. Sousounis; James Wallman; Greg Mann (2000). "Hurricane Huron". Bulletin of the American Meteorological Society. AMS Online Journals. 81 (2): 223–236. Bibcode:2000BAMS...81..223M. doi:10.1175/1520-0477(2000)081<0223:HH>2.3.CO;2.
- ^ Brandon James (September 13, 2018). "Yes, a 'hurricane' once formed on the Great Lakes, and it was an epic storm". 95.3 WBCKFM. Retrieved February 18, 2021.
- ^ "Storm Names". The Philadelphia Inquirer. June 3, 1996. p. F12. Retrieved May 13, 2021 – via Newspapers.com.

- ^ a b "Worldwide Tropical Cyclone Names". National Hurricane Center. March 3, 2003. Archived from the original on April 11, 2003. Retrieved September 25, 2011.
- ^ "Familiar cast will be named in windy sags". Miami Herald. June 1, 1990. p. 11A. Retrieved May 13, 2021 – via Newspapers.com.
- ^ "Tropical Cyclone Naming History and Retired Names". National Hurricane Center. September 9, 2011. Retrieved September 25, 2011.
External links[]
| Wikimedia Commons has media related to 1996 Atlantic hurricane season. |
- 1996 Atlantic hurricane season