1968 Atlantic hurricane season
| 1968 Atlantic hurricane season | |
|---|---|
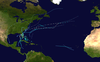
 Season summary map | |
| Seasonal boundaries | |
| First system formed | June 1, 1968 |
| Last system dissipated | October 21, 1968 |
| Strongest storm | |
| Name | Gladys |
| • Maximum winds | 85 mph (140 km/h) (1-minute sustained) |
| • Lowest pressure | 965 mbar (hPa; 28.5 inHg) |
| Seasonal statistics | |
| Total depressions | 14 |
| Total storms | 8 |
| Hurricanes | 5 (1 unofficial) |
| Major hurricanes (Cat. 3+) | 0 |
| Total fatalities | 17 |
| Total damage | $21.9 million (1968 USD) |
| Related articles | |
The 1968 Atlantic hurricane season was one of five Atlantic hurricane seasons during the satellite era not to feature a major hurricane,[nb 1] the others being 1972, 1986, 1994, and 2013, and was one of two to not feature a category 2 hurricane either, with the other being 2013. The season officially began on June 1 and lasted until November 30, dates which conventionally delimit the period of each year when most tropical cyclones form in the Atlantic basin. It was a below average season in terms of tropical storms, with a total of eight nameable storms. The first system, Hurricane Abby, developed in the northwestern Caribbean on June 1. Abby moved northward and struck Cuba, bringing heavy rainfall and flooding to western portions of the island. Making landfall in Florida on June 4, Abby caused flooding and spawned four tornadoes, but left behind little damage. Overall, the hurricane resulted in six deaths and about $450,000 (1968 USD) in damage.[nb 2] In late June, Tropical Storm Candy brought minor flooding and spawned several tornadoes across portions of the Southern United States. Overall damage from the cyclone reached approximately $2.7 million.
Despite three named storms in June, cyclone activity slowed throughout the subsequent month, with only one tropical depression. During late August and early September, Tropical Depression Eleven brought flooding to the Jacksonville area of Florida. Hurricane Gladys, the final and also the strongest named storm of the season, developed in the southwestern Caribbean Sea on October 13. Peaking as a Category 1 on the Saffir–Simpson hurricane wind scale, the system resulted in flooding across western Cuba, particularly in Havana, where the storm caused six deaths and about $12 million in damage. Rough seas, gusty winds, tornadoes, and heavy rainfall resulted in generally minor impact in Florida, with three fatalities and damage totaling $6.7 million. Gladys also provided relief for one of North Carolina's worst droughts. Several other storms left negligible impact on land. Overall, the storms of the season collectively caused approximately $21.8 million in damage and killed 17 people.
Season summary[]

The Atlantic hurricane season officially began on June 1,[2] with Hurricane Abby developing that day.[3] It was a below average season in which eight tropical storms formed,[4] compared to the 1966–2009 average of 11.3 named storms.[5] Four of these reached hurricane status,[3] slightly below the 1966–2009 average of 6.2.[5] None of the hurricanes strengthened into a major hurricane; only four other seasons since the satellite era began featured no major hurricanes: 1972, 1986, 1994, and 2013.[6] Further, no hurricanes exceeded Category 1 intensity on the Saffir–Simpson hurricane wind scale; this would not occur again until 2013.[7] Despite an active beginning, this season had the fewest hurricane days since 1962.[3] Four hurricanes and one tropical storm made landfall during the season,[4] causing 17 deaths and about $21.8 million in damage.[3][8][9][10] The last storm of the season, a tropical depression, dissipated on November 25,[4] five days before the official end of hurricane season on November 30.[2]
Tropical cyclogenesis began in June, with three named storms during that month – hurricanes Abby and Brenda and Tropical Storm Candy – tying the record set in 1886, 1936, 1959, and later 2021.[3] Despite the quick start, activity abruptly slowed, with only a tropical depression in July.[4] The next named storm, Hurricane Dolly, existed from August 10 to August 17, while Tropical Depression Eleven formed later that month.[3] September was the most active month, with five tropical depressions, two tropical storms, and one subtropical storm, which peaked with an intensity equivalent to a Category 1. In October, Hurricane Gladys became the strongest tropical cyclone of the season, despite maximum sustained winds of only 85 mph (135 km/h) and a minimum barometric pressure of 965 mbar (28.5 inHg).[4]
The season's activity was reflected with an accumulated cyclone energy (ACE) rating of 45.[6] ACE is, broadly speaking, a measure of the power of the hurricane multiplied by the length of time it existed, so storms that last a long time, as well as particularly strong hurricanes, have high ACEs. It is only calculated for full advisories on tropical systems at or exceeding 39 mph (63 km/h), which is tropical storm strength.[11]
Systems[]
Hurricane Abby[]
| Category 1 hurricane (SSHWS) | |
  | |
| Duration | June 1 – June 13 |
|---|---|
| Peak intensity | 75 mph (120 km/h) (1-min) 992 mbar (hPa) |
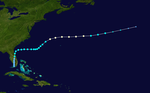
The interaction of a mid-tropospheric trough and a cold front spawned a tropical depression on June 1. The initial circulation was not embedded within the convection, but as it moved slowly north-northeastward, it was able to strengthen and become better organized, reaching tropical storm strength on June 2. It crossed the western tip of Cuba, and upon reaching the southeast Gulf of Mexico, Abby achieved hurricane strength. It weakened to a tropical storm before landfall in Punta Gorda, Florida on June 4. Abby moved across the state and then reached the western Atlantic. On June 6, it made another landfall near Jacksonville. Abby weakened to a tropical depression as it moved over Georgia, and over the next six days, it drifted over The Carolinas, finally dissipating on June 13 east of Virginia.[3]
As Abby crossed Cuba, moderate rainfall and relatively high winds were reported.[3] In addition, Abby dropped heavy rainfall across the state of Florida, peaking at 14.65 in (372 mm) in Hart Lake.[12] However, the rain was almost entirely beneficial, as Florida was suffering from a severe drought. Despite winds gusts up to 100 mph (160 km/h), no significant wind damage was reported. Abby spawned several tornadoes in Florida, though losses rarely exceeded $5,000.[3] One twister in Monroe, North Carolina, damaged 20 cars, and destroyed three homes and impacted 20 others. Elsewhere, the storm dropped relatively light rainfall and produced a few tornadoes throughout the Southeastern United States.[13] Overall, the storm caused approximately $450,000 in damage and led to six indirect fatalities.[3]
Hurricane Brenda[]
| Category 1 hurricane (SSHWS) | |
  | |
| Duration | June 17 – June 26 |
|---|---|
| Peak intensity | 75 mph (120 km/h) (1-min) 990 mbar (hPa) |
The trough that spawned Abby persisted, with another tropical depression developing over the Straits of Florida on June 17. Early the following day, the depression crossed the Florida Keys and later made landfall in a rural area of Monroe County. Wind shear levels became increasingly favorable, causing the depression to maintain its intensity while crossing Florida. Because the heaviest shower and thunderstorm activity remained well offshore the state, little impact was reported.[3] Up to 8.61 in (219 mm) of precipitation fell at the Homestead Experiment Station.[14] Early on June 20, the depression emerged into the Atlantic Ocean near Flagler Beach. Shortly thereafter, a weak trough in the westerlies forced the storm to curve eastward. Intensification then occurred, with the depression becoming Tropical Storm Brenda early on June 21.[3]
Later on June 21 and into June 22, the Bermuda high built southwestward as a weak trough passed to the north, resulting in Brenda turning northeastward. With persistent favorable conditions,[3] the storm reached hurricane status at 12:00 UTC on June 23. Early the next day, Brenda attained its peak intensity with maximum sustained winds of 75 mph (120 km/h) and a minimum barometric pressure of 990 mbar (29 inHg).[4] Thereafter, a ridge of high pressure blocked moist air from reaching the storm, causing it to weaken.[3] By June 25, Brenda fell to tropical storm intensity and deteriorated further to a tropical depression on June 26.[4] Later that day, it was absorbed by a large extratropical cyclone,[3] while located about 360 mi (580 km) west-southwest of Flores Island in the Azores.[4]
Tropical Storm Candy[]
| Tropical storm (SSHWS) | |
  | |
| Duration | June 22 – June 25 |
|---|---|
| Peak intensity | 70 mph (110 km/h) (1-min) 996 mbar (hPa) |
A tropical disturbance located in the southwestern Gulf of Mexico developed into a tropical depression on June 22.[3][4] Gradual strengthening occurred, with the depression being upgraded to Tropical Storm Candy on the following day. On June 23, the storm peaked with maximum sustained winds of 70 mph (110 km/h) and a minimum barometric pressure of 996 mbar (29.4 inHg). Hours later, Candy made landfall near Port Aransas, Texas at the same intensity, before quickly weakening to a tropical depression by early on June 24. However, it persisted for a few more days, until transitioning into an extratropical cyclone over Michigan on June 26.[4]
Due to rainfall from a previous weather system, the ground was already saturated throughout Texas.[3] As a result, Candy caused flooding, with precipitation exceeding 11 in (280 mm) in some areas.[14] Minor damage to crops, roads, and bridges was reported in the eastern portions of the state. Agricultural losses alone were slightly less than $2 million. Storm surge along the coast of Texas caused "cuts" on Padre Island. The storm spawned 24 tornadoes, though only one caused significant impact.[3] Candy and its remnants dropped rainfall in 24 other states,[15] reaching as far north as New Hampshire. Overall, Candy caused $2.7 million in damage and no fatalities.[3]
Hurricane Dolly[]
| Category 1 hurricane (SSHWS) | |
  | |
| Duration | August 10 – August 17 |
|---|---|
| Peak intensity | 80 mph (130 km/h) (1-min) 985 mbar (hPa) |
In late July, a tropical wave emerged into the Atlantic Ocean from the west coast of Africa. After tracking west-northwestward and westward, the wave reached the Straits of Florida on August 9, where it began interacting with an upper-level low. Early on August 10, the system developed into a tropical depression, while located near Andros Island in the Bahamas. Shortly thereafter, the depression made landfall near Fort Lauderdale, Florida. The depression quickly re-emerged into the Atlantic. Initially, the depression did not strengthen and was nearly absorbed by a cold front. After paralleling part of the East Coast of the United States, the depression moved further out to sea. By early on August 12, the depression finally strengthened into Tropical Storm Dolly, and further developed into a hurricane later that day.[3]
Dolly briefly weakened back to a tropical storm on August 13 amid unfavorable atmospheric conditions, only to reattain hurricane intensity later that day.[3] On August 14, Dolly peaked with maximum sustained winds of 80 mph (130 km/h).[4] After remaining a minimal hurricane until August 16, the unfavorable conditions prevailed, causing Dolly to rapidly weaken to a tropical depression. By early on August 17, Dolly became extratropical while about 300 mi (480 km) north of the Azores.[3] Impact from Hurricane Dolly was minimal, with only rainfall being reported on land. Precipitation peaked at 3.89 in (99 mm) at Palm Beach International Airport in West Palm Beach, Florida. Although it was mostly limited to the east coast of Florida, isolated areas of rain were reported in the Panhandle and on the west coast. Elsewhere, rainfall from Dolly was also recorded in North and South Carolina, though it did not exceed or reach 3 in (76 mm).[16]
Tropical Storm Edna[]
| Tropical storm (SSHWS) | |
  | |
| Duration | September 11 – September 19 |
|---|---|
| Peak intensity | 65 mph (100 km/h) (1-min) 1005 mbar (hPa) |
A tropical wave emerged into the Atlantic Ocean from the west coast of Africa on September 10. A weak high-level trough and a warm anticyclone to the east-northeast generated low wind shear,[3] allowing a tropical depression to develop at 18:00 UTC on September 11, while located about 225 mi (360 km) southeast of Praia, Cape Verde.[4] Although satellite imagery indicated a well-defined tropical depression, it did not organize further until at least September 13. Two days later, the ship Sal Mela observed wind speeds of 69 mph (111 km/h). Thus, the depression was upgraded to Tropical Storm Edna on September 15.[3] Around that time, Edna attained its peak intensity with maximum sustained winds of 65 mph (105 km/h) and a minimum barometric pressure of 1001 mbar (29.6 inHg).[4] By September 18, upper level cold trough began producing unfavorable conditions, with the storm weakening to a tropical depression that day.[3] Edna degenerated into a tropical wave early the following day, while situated about 395 mi (635 km) east of Barbuda.[4]
Subtropical Cyclone One[]
| Subtropical storm (SSHWS) | |
  | |
| Duration | September 14 – September 23 |
|---|---|
| Peak intensity | 80 mph (130 km/h) (1-min) 979 mbar (hPa) |
A subtropical depression developed at 12:00 UTC on September 14, while located about 295 mi (475 km) southeast of Cape Hatteras, North Carolina and initially moved east-northeastward. Early on September 16, it briefly curved north-northwestward and strengthened into a subtropical storm, before turning back to the east-northeastward later that day. By September 17, the storm re-curved to the southeast and decelerated but began to accelerate on September 19. Strengthened continued, with the storm becoming a Category 1 subtropical cyclone early the following day. At 00:00 UTC on September 12, it peaked with maximum sustained winds of 80 mph (130 km/h) and a minimum barometric pressure of 979 mbar (28.9 inHg). Accelerating northeastward, a weakening trend soon commenced. The subtropical storm became extratropical by 12:00 UTC on September 23, while located about 320 mi (510 km) northwest of Corvo Island in the Azores.[4]
Tropical Storm Frances[]
| Tropical storm (SSHWS) | |
  | |
| Duration | September 23 – September 29 |
|---|---|
| Peak intensity | 60 mph (95 km/h) (1-min) 1001 mbar (hPa) |
A tropical depression developed east of the Bahamas at 12:00 UTC on September 23.[4] Convection was enhanced by a mid-tropospheric trough, though further strengthening was initially slow.[3] Initially, the depression headed northward, but curved northeastward on September 25.[4] A reconnaissance aircraft late on September 26 reported a warm core, sustained winds of 52 mph (84 km/h) and a minimum barometric pressure of 1,001 mbar (29.6 inHg).[3] Therefore, it is estimated that the depression strengthened into Tropical Storm Frances around that time.[4] The storm intensified slightly further to winds of 60 mph (95 km/h), before beginning to weaken on September 28. Later that day, steering flow from an upper low-pressure area caused Frances to curve almost due eastward.[3] The storm weakened further to a tropical depression early on September 29, shortly before transitioning into an extratropical cyclone.[4]
Hurricane Gladys[]
| Category 1 hurricane (SSHWS) | |
  | |
| Duration | October 13 – October 21 |
|---|---|
| Peak intensity | 85 mph (140 km/h) (1-min) 965 mbar (hPa) |
In early October, a tropical wave interacted with the Intertropical Convergence Zone while located in the southwestern Caribbean Sea, spawning multiple low-pressure areas. One of the lows developed into a tropical depression while centered near San Andrés on October 13.[3][4] The depression moved north-northwestward and strengthened into Tropical Storm Gladys on October 15. By the following day, it became a hurricane, shortly before striking Cuba. Gladys later peaked with maximum sustained winds of 85 mph (135 km/h), just before making landfall near Homosassa, Florida on October 19. The hurricane crossed the state and continued northeastward, passing just east of Cape Hatteras on October 20. The next day, Gladys became extratropical and was absorbed by a cold front over Nova Scotia.[4]
In Cuba, Gladys caused flash flooding and heavily damaged the tobacco crop.[3] Damage in the country was estimated at $12 million, and there were six deaths.[8] While passing west of the Florida Keys, the hurricane produced strong winds that briefly cut communications to the Dry Tortugas,[17] but damage was minor.[9] Near where Gladys made landfall, winds gusted to 100 mph (160 km/h) and tides reached 6.5 ft (2.0 m) above normal. There was heavy beach erosion and flooding along the coast,[3] while the winds knocked down trees and caused power outages. Across the state, damage was estimated at $6.7 million, and three people were indirectly killed. Heavy rainfall in South Carolina caused minor river flooding.[9] When paralleling just off the coast of North Carolina, Gladys was responsible for breaking the state's worst drought since 1932, and proved more beneficial than the minor storm damage there.[3] Later, Gladys killed two people in Atlantic Canada and caused coastal damage in Prince Edward Island.[10]
Tropical depressions[]

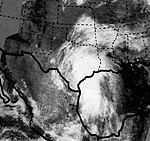
A total of seven tropical cyclones remained below tropical storm intensity during the 1968 Atlantic hurricane season. The first such system formed in the north-central Gulf of Mexico at 00:00 UTC on July 4. Moving east-northeastward, it dissipated offshore St. George Island, Florida, about 24 hours later.[4] On August 26, Tropical Depression Eleven developed in the northeastern Gulf of Mexico. Drifting northeastward, the depression was situated offshore Central Florida on August 28, shortly before it trekked southward and made three landfalls in Florida near Clearwater, Holmes Beach, and Venice. By early on August 29, the depression began moving northeast to north-northeastward across the state. Late on August 31, the system emerged into the Atlantic Ocean near Atlantic Beach and dissipated shortly thereafter. Due to the depression's slow movement across Florida,[3] heavy rainfall was observed, including 15.46 in (393 mm) of rainfall in Jacksonville.[14] Considerable flooding was reported in Clay and Duval counties. Along the upper Cedar River in the latter, many homes and businesses were flooded. Eleven bridges were inundated with water ranging from a few inches to 4.5 ft (1.4 m). Peak discharge amounts were higher than during Hurricane Dora in 1964. However, soil moisture and streamflow conditions during Dora were much more conducive to producing floods than antecedent conditions associated with this depression.[18] Further south in Daytona Beach, a tornado destroyed a motel and several homes.[3]
The next tropical depression formed on September 7, while centered about 820 mi (1,320 km) north-northeast of Fortaleza, Ceará. Moving generally west to west-northwestward, the depression approached the Lesser Antilles, but dissipated well east-southeast of the islands on September 10. Another tropical depression developed on September 17, while situated about 205 mi (330 km) south of Santiago, Cape Verde. The depression moved northwestward and did not strengthen. By September 21, it dissipated about 1,135 mi (1,830 km) west-northwest of the northernmost islands of Cape Verde. The next tropical depression originated on September 23, while located approximately 670 mi (1,080 km) east-northeast of Cayenne, French Guiana. Approaching the Windward Islands, it crossed through Saint Vincent and the Grenadines, before dissipating on September 25. That day, Tropical Depression Eighteen formed in the northwestern Caribbean Sea. While a tropical cyclone, it struck Cuba and Florida.[4] Generally light rainfall was reported in the state, with up to 7.53 in (191 mm) at the Royal Palm Ranger Station in Everglades National Park.[14] Thereafter, the depression tracked northeastward and dissipated on September 29. The final tropical depression developed on November 24 near Mayaguana. Moving north-northeastward to northeastward, the depression dissipated southwest of Bermuda about 24 hours later.[4]
Additionally, another tropical depression was tracked during the season, though it was not included in the Atlantic hurricane best track.[4] Classified as Tropical Depression Fourteen, the system developed from a low-pressure area offshore the Southeastern United States on September 8. It headed generally north-northeastward ahead of a mid-level cyclone that moved south-southeastward into the central Appalachian Mountains. While the storm passed just offshore the Outer Banks of North Carolina, the depression dropped 5.8 in (150 mm) of precipitation on Bodie Island. Thereafter, the cyclone began losing tropical characteristics and became extratropical on September 11 while making landfall on Long Island, New York. Winds gusts of 33 and 46 mph (53 and 74 km/h) were observed between Boston and New York City. The remnants of this storm entered Atlantic Canada and was absorbed by a larger extratropical cyclone shortly before emerging into the Gulf of Saint Lawrence on September 12.[19]
Storm names[]
The following names were used for named storms that formed in the North Atlantic in 1968.[2] The list is mostly the same as the 1964 season,[20] except for Candy, Dolly, Edna, Frances, Hannah, and Ingrid.[2] A storm was named Candy for the first time in 1968. No names were retired this season. However, the name Edna was later retroactively retired because of the Hurricane Edna of the 1954 season, and has not been used since.[21] Names that were not assigned are marked in gray.
|
|
Season effects[]
This is a table of the storms in 1968 and their landfall(s), if any. Deaths in parentheses are additional and indirect (an example of an indirect death would be a traffic accident), but are still storm-related. Damage and deaths include totals while the storm was extratropical or a wave or low.
| Name | Dates active | Peak classification | Sustained wind speeds |
Pressure | Areas affected | Damage (USD) |
Deaths | Refs |
|---|---|---|---|---|---|---|---|---|
| Abby | June 1–13 | Category 1 hurricane | 75 mph (120 km/h) | 992 hPa (29.29 inHg) | Cuba, Florida, Georgia, Carolinas | $450,000 | 0 (6) | |
| Brenda | June 17–26 | Category 1 hurricane | 75 mph (120 km/h) | 990 hPa (29.23 inHg) | Florida | Minor | None | |
| Candy | June 22–25 | Tropical storm | 70 mph (115 km/h) | 996 hPa (29.41 inHg) | Texas, Arkansas, Louisiana, Missouri, Illinois, Ohio | $2.7 million | None | |
| Unnumbered | July 4–5 | Tropical depression | 30 mph (50 km/h) | Unknown | None | None | None | |
| Dolly | August 10–17 | Category 1 hurricane | 80 mph (130 km/h) | 985 hPa (29.09 inHg) | Carolinas, Florida, Azores | Minor | None | |
| Unnumbered | August 26 – September 1 | Tropical depression | 30 mph (50 km/h) | Unknown | Florida | Minor | None | |
| Unnumbered | September 7–10 | Tropical depression | 35 mph (55 km/h) | Unknown | None | None | None | |
| Edna | September 11–19 | Tropical storm | 65 mph (105 km/h) | 1005 hPa (29.68 inHg) | None | None | None | |
| One | September 14–23 | Category 1 subtropical cyclone | 80 mph (130 km/h) | 979 hPa (28.91 inHg) | None | None | None | |
| Unnumbered | September 17–21 | Tropical depression | 30 mph (50 km/h) | Unknown | None | None | None | |
| Unnumbered | September 23–25 | Tropical depression | 35 mph (55 km/h) | Unknown | Saint Vincent and the Grenadines | None | None | |
| Frances | September 23–29 | Tropical storm | 60 mph (95 km/h) | 1001 hPa (29.56 inHg) | None | None | None | |
| Unnumbered | September 25–29 | Tropical depression | Unknown | Unknown | Cuba, Florida | None | None | |
| Gladys | October 13–21 | Category 1 hurricane | 85 mph (135 km/h) | 965 hPa (28.50 inHg) | Cuba, Southeastern United States, Nova Scotia | $18.7 million | 8 (3) | |
| Season aggregates | ||||||||
| 14 | June 1 – October 21 | 85 mph (135 km/h) | 965 hPa (28.50 inHg) | $21.9 million | 17 | |||
See also[]
- Lists of Atlantic hurricanes
- Atlantic hurricane season
- 1968 Pacific hurricane season
- 1968 Pacific typhoon season
- 1968 North Indian Ocean cyclone season
- 1967–68 South-West Indian Ocean cyclone season
- 1968–69 South-West Indian Ocean cyclone season
- 1960s Australian region cyclone seasons
- 1960s South Pacific cyclone seasons
Notes[]
- ^ A major hurricane is a storm that ranks as Category 3 or higher on the Saffir–Simpson hurricane wind scale.[1]
- ^ All damage figures are in 1968 USD, unless otherwise noted
References[]
- ^ Saffir–Simpson Hurricane Wind Scale. National Hurricane Center (Report). Miami, Florida: National Oceanic and Atmospheric Administration. May 23, 2013. Retrieved August 28, 2014.
- ^ a b c d "Abby? Brenda? Candy? They All Kick Up a Storm". Pittsburgh Post-Gazette. Miami, Florida. Associated Press. May 25, 1968. Retrieved July 20, 2014.
- ^ a b c d e f g h i j k l m n o p q r s t u v w x y z aa ab ac ad ae af ag ah Arnold L. Sugg and Paul J. Hebert (March 1969). The Atlantic Hurricane Season of 1968 (PDF). National Hurricane Center; Weather Bureau (Report). Miami, Florida: National Oceanic and Atmospheric Administration; Atlantic Oceanographic and Meteorological Laboratory. Retrieved July 19, 2014.
- ^ a b c d e f g h i j k l m n o p q r s t u v w x y "Atlantic hurricane best track (HURDAT version 2)" (Database). United States National Hurricane Center. May 25, 2020.
- ^ a b Tropical Cyclone Climatology. National Hurricane Center (Report). Miami, Florida: National Oceanic and Atmospheric Administration. March 19, 2014. Retrieved August 27, 2014.
- ^ a b Atlantic basin Comparison of Original and Revised HURDAT. Hurricane Research Division; Atlantic Oceanographic and Meteorological Laboratory (Report). Miami, Florida: National Oceanic and Atmospheric Administration. March 2011. Retrieved March 6, 2012.
- ^ Jeff Masters (November 29, 2013). The Unusually Quiet Atlantic Hurricane Season of 2013 Ends (Report). Weather Underground. Archived from the original on December 8, 2013. Retrieved August 27, 2014.
- ^ a b Roger A. Pielke Jr.; et al. (August 2003). Hurricane Vulnerability in Latin America and The Caribbean: Normalized Damage and Loss Potentials (PDF). National Hazards Review (Report). National Oceanic and Atmospheric Administration. Retrieved July 20, 2014.
- ^ a b c Climatological Data October 1968. National Oceanic and Atmospheric Administration. 1968. pp. 117, 97, 514, 516. Retrieved July 20, 2014.
- ^ a b 1968-Gladys (Report). Moncton, New Brunswick: Environment Canada. September 14, 2010. Archived from the original on July 3, 2013. Retrieved July 20, 2014.
- ^ David Levinson (August 20, 2008). 2005 Atlantic Ocean Tropical Cyclones. National Climatic Data Center (Report). Asheville, North Carolina: National Oceanic and Atmospheric Administration. Archived from the original on December 1, 2005. Retrieved March 6, 2012.
- ^ David M. Roth (February 15, 2009). Hurricane Abby – June 2-13, 1968. Weather Prediction Center (Report). College Park, Maryland: National Oceanic and Atmospheric Administration. Retrieved July 19, 2014.
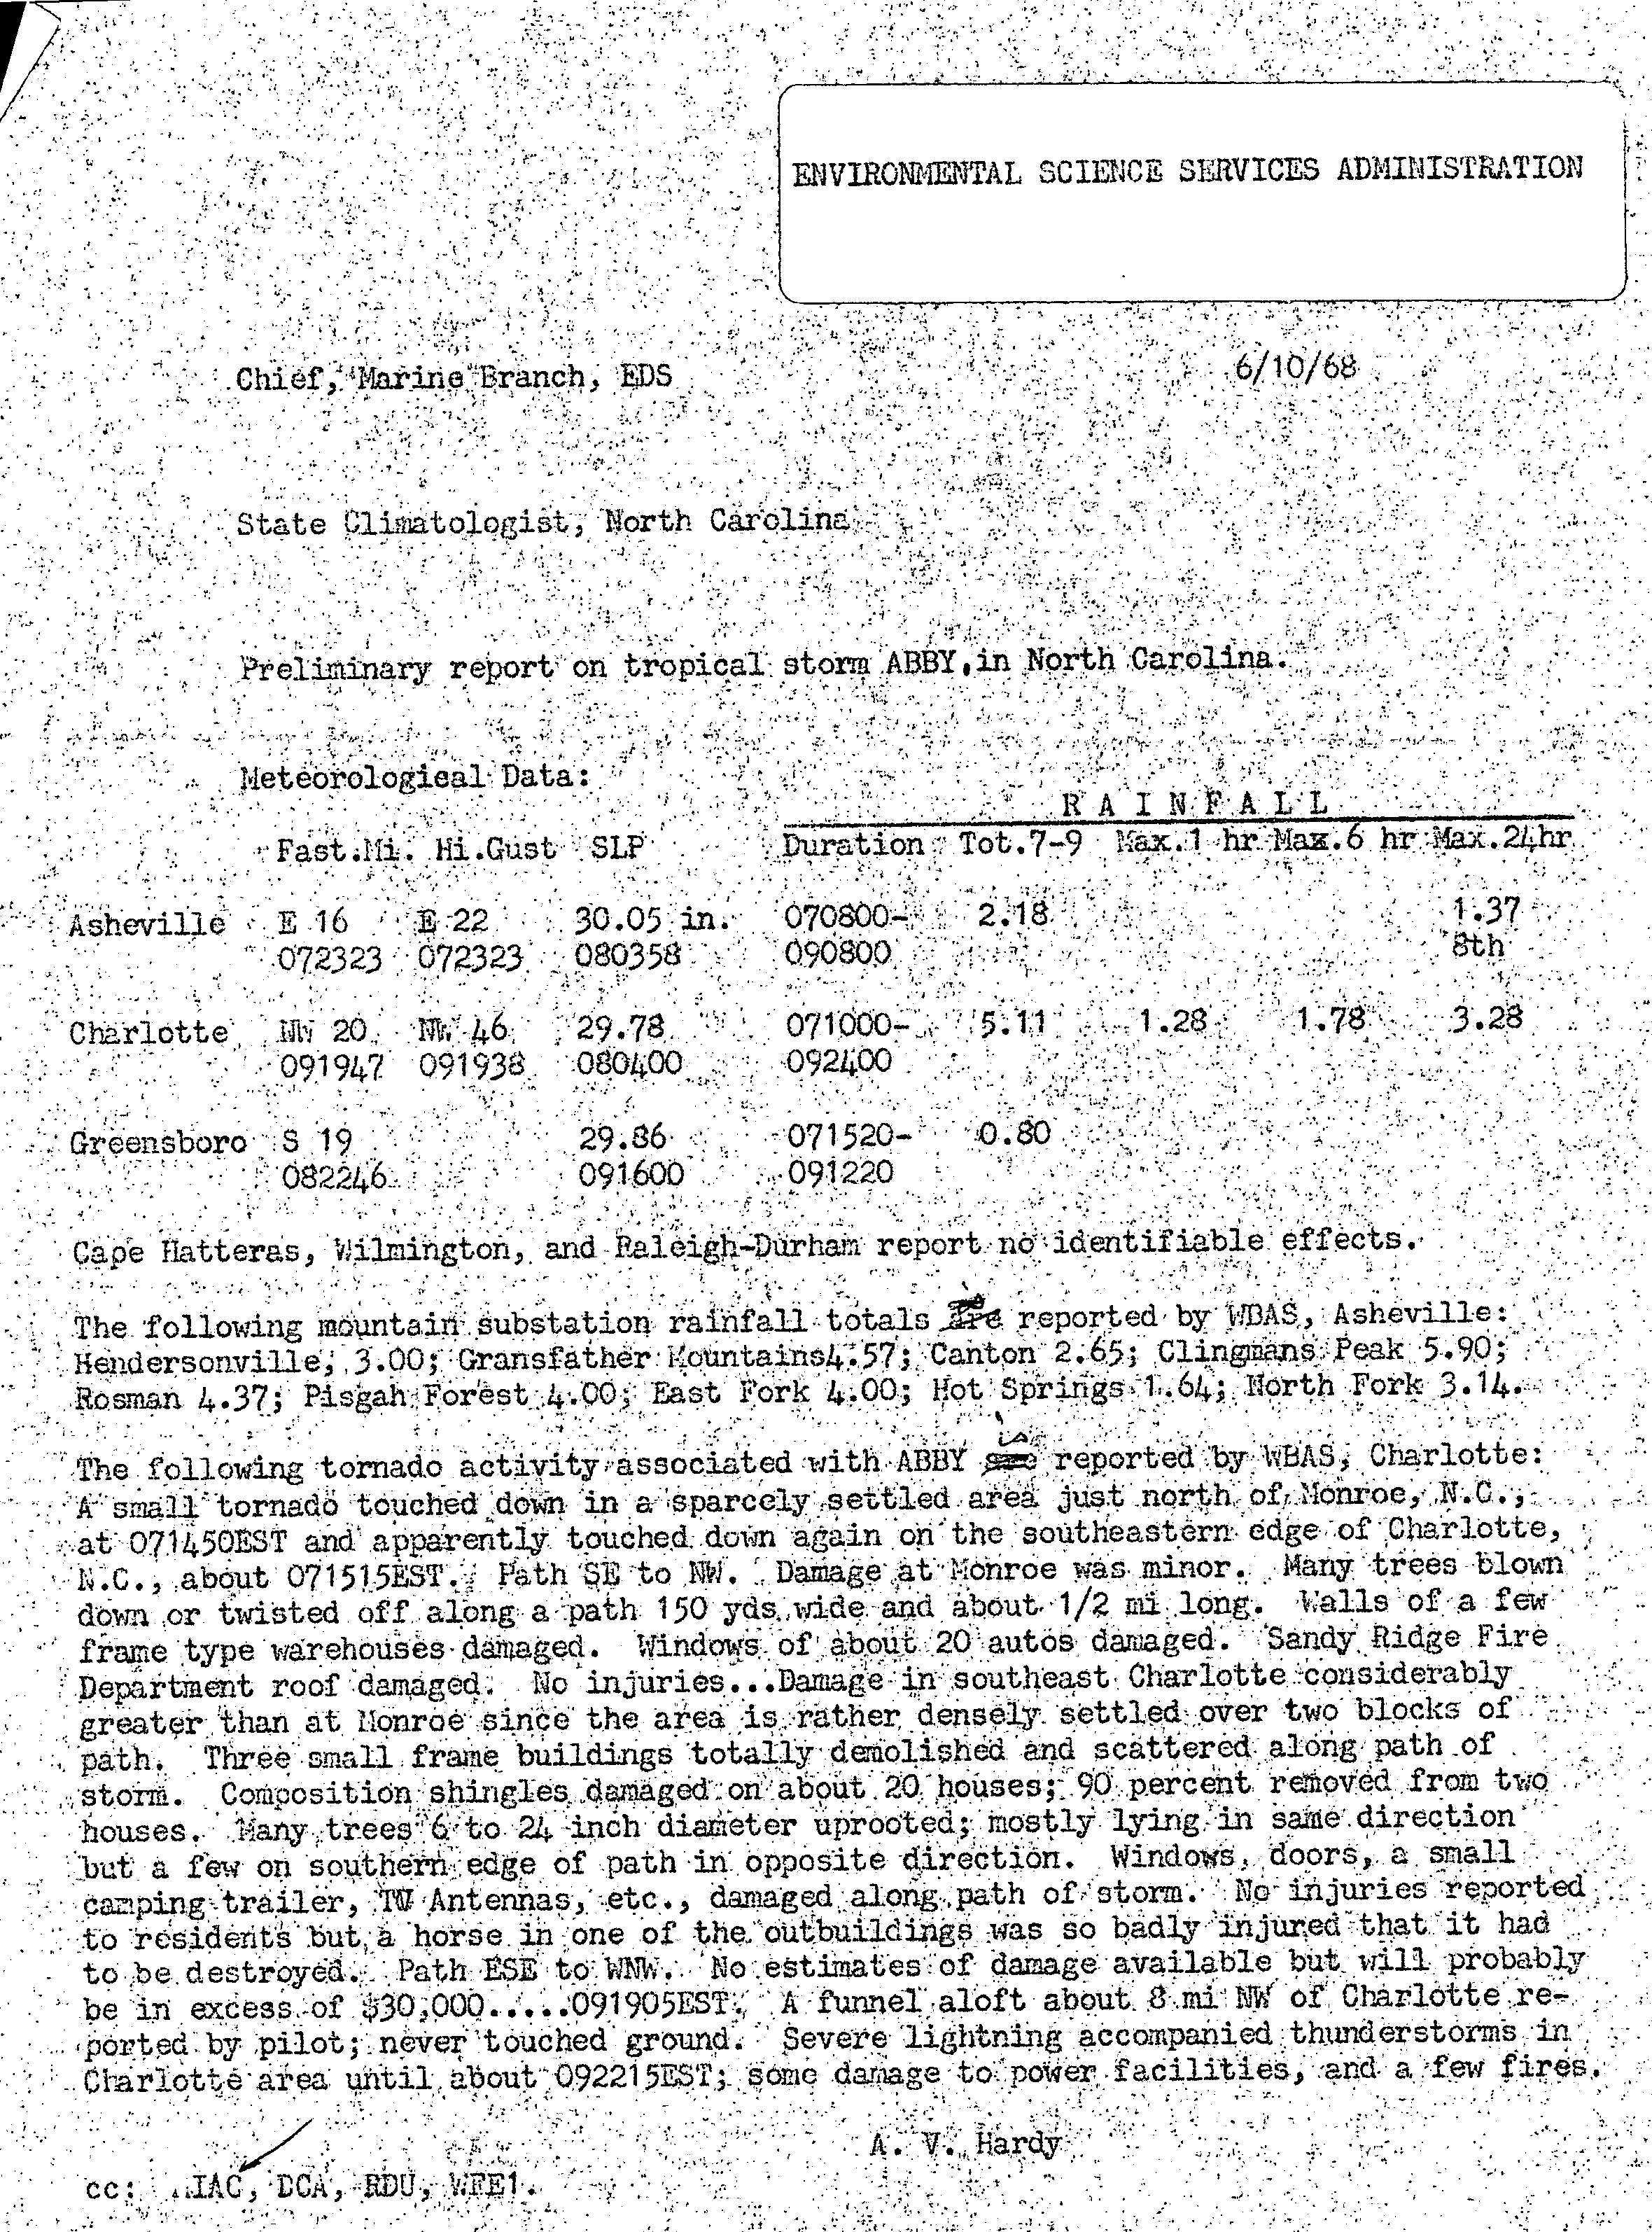
- ^ A. V. Hardy (June 10, 1968). Preliminary report on tropical storm Abby, in North Carolina. Environmental Science Services Administration (Report). Silver Spring, Maryland: National Hurricane Center. Retrieved January 30, 2013.
- ^ a b c d Roth, David M. (October 18, 2017). "Tropical Cyclone Point Maxima". Tropical Cyclone Rainfall Data. United States Weather Prediction Center. Retrieved November 26, 2017.
- ^ David M. Roth (April 19, 2009). Tropical Storm Candy – June 22-26, 1968. Weather Prediction Center (Report). College Park, Maryland: National Oceanic and Atmospheric Administration. Retrieved July 19, 2014.
- ^ David M. Roth (February 3, 2009). Tropical Storm Dolly – August 9-11, 1968. Weather Prediction Center (Report). College Park, Maryland: National Oceanic and Atmospheric Administration. Retrieved July 19, 2014.
- ^ "Gladys Hits Keys; Tampa in Sights". The Palm Beach Post. Associated Press. October 17, 1968. p. A-1. Retrieved September 28, 2021 – via Newspapers.com.

- ^ J. O. Rostvedt; et al. (1972). Summary of Floods in the United States during 1968 (PDF). United States Geological Survey (Report). Washington, D.C.: United States Department of the Interior. pp. 64–68. Retrieved July 19, 2014.
- ^ David M. Roth (March 6, 2013). Tropical Depression Eighteen – September 25-28, 1968. Weather Prediction Center (Report). Silver Spring, Maryland: National Oceanic and Atmospheric Administration. Retrieved August 7, 2014.
- ^ "Odds In Favor Of Hurricanes". Star-News. Washington, D.C. United Press International. June 20, 1964. Retrieved July 20, 2014.
- ^ Tropical Cyclone Naming History and Retired Names. National Hurricane Center (Report). Miami, Florida: National Oceanic and Atmospheric Administration. April 10, 2014. Retrieved July 20, 2014.
External links[]
Tropical cyclones of the 1968 Atlantic hurricane season | ||
|---|---|---|
 | ||
| ||
- 1968 Atlantic hurricane season