2000 United States presidential election in Maryland
| ||||||||||||||||||||||||||
| ||||||||||||||||||||||||||
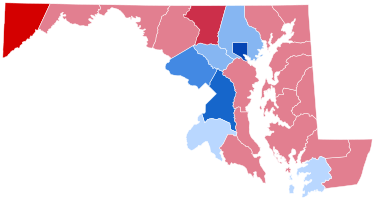 County Results
| ||||||||||||||||||||||||||
| ||||||||||||||||||||||||||

| Elections in Maryland |
|---|
 |
|
show |
|
show |
|
show |
|
show |
|
|
The 2000 United States presidential election in Maryland took place on November 7, 2000. Maryland participated in the 2000 United States presidential election along with the 49 other U.S. states and Washington, D.C. Voters chose 10 representatives, or electors, to the Electoral College, who voted for the President and Vice President.
Maryland was easily won by Vice President Al Gore by a safe margin of victory. Maryland was furthermore the only state which, along with Washington, D.C., swung more Democratic than it had been in 1996, even though Gore improved upon Bill Clinton percentage wise in several other states.[1] Gore's strong performance in the most highly-populated counties in the state, which are home to many urban and African American communities, contributed to his victory in the state. Gore became the first Democrat to carry Charles County since 1976; it was one of only two counties in the country to vote for Gore after having voted for Bob Dole in 1996, the other being Orange County, Florida.
Results[]
| 2000 United States presidential election in Maryland | ||||||
|---|---|---|---|---|---|---|
| Party | Candidate | Running mate | Votes | Percentage | Electoral votes | |
| Democratic | Al Gore | Joe Lieberman | 1,145,782 | 56.6% | 10 | |
| Republican | George W. Bush | Dick Cheney | 813,797 | 40.2% | 0 | |
| Green | Ralph Nader | Winona LaDuke | 53,768 | 2.7% | 0 | |
| Libertarian | Harry Browne | Wayne Allyn Root | 5,310 | 0.3% | 0 | |
| Reform | Pat Buchanan | Ezola Foster | 4,248 | 0.2% | 0 | |
| Write Ins | 1,480 | 0.1% | 0 | |||
| Constitution | Howard Phillips | Michael Peroutka | 919 | 0.1% | 0 | |
| Write In | John Hagelin | – | 176 | 0.0% | 0 | |
| Totals | 2,025,480 | 100.00% | 10 | |||
| Voter turnout (Voting age/Registered) | 51%/74% | |||||
Results by county[]
| County | Albert Arnold Gore Jr. Democratic |
George Walker Bush Republican |
Ralph Nader Green |
Various candidates Other parties |
Margin | Total votes cast | |||||
|---|---|---|---|---|---|---|---|---|---|---|---|
| # | % | # | % | # | % | # | % | # | % | ||
| Allegany | 10,894 | 41.31% | 14,656 | 55.58% | 610 | 2.31% | 211 | 0.80% | -3,762 | -14.27% | 26,371 |
| Anne Arundel | 89,624 | 44.67% | 104,209 | 51.93% | 5,493 | 2.74% | 1,331 | 0.66% | -14,585 | -7.27% | 200,657 |
| Baltimore County | 160,635 | 52.83% | 133,033 | 43.75% | 8,544 | 2.81% | 1,872 | 0.62% | 27,602 | 9.08% | 304,084 |
| Baltimore City | 158,765 | 82.52% | 27,150 | 14.11% | 5,512 | 2.86% | 977 | 0.51% | 131,615 | 68.41% | 192,404 |
| Calvert | 12,986 | 43.57% | 16,004 | 53.69% | 660 | 2.21% | 156 | 0.52% | -3,018 | -10.13% | 29,806 |
| Caroline | 3,396 | 37.94% | 5,300 | 59.20% | 198 | 2.21% | 58 | 0.65% | -1,904 | -21.27% | 8,952 |
| Carroll | 20,146 | 31.46% | 41,742 | 65.19% | 1,681 | 2.63% | 458 | 0.72% | -21,596 | -33.73% | 64,027 |
| Cecil | 12,327 | 42.69% | 15,494 | 53.66% | 794 | 2.75% | 261 | 0.90% | -3,167 | -10.97% | 28,876 |
| Charles | 21,873 | 49.05% | 21,768 | 48.82% | 755 | 1.69% | 196 | 0.44% | 105 | 0.24% | 44,592 |
| Dorchester | 5,232 | 45.93% | 5,847 | 51.33% | 222 | 1.95% | 91 | 0.80% | -615 | -5.40% | 11,392 |
| Frederick | 30,725 | 39.06% | 45,350 | 57.65% | 2,052 | 2.61% | 534 | 0.68% | -14,625 | -18.59% | 78,661 |
| Garrett | 2,872 | 26.95% | 7,514 | 70.52% | 203 | 1.91% | 66 | 0.62% | -4,642 | -43.57% | 10,655 |
| Harford | 35,665 | 39.01% | 52,862 | 57.82% | 2,298 | 2.51% | 599 | 0.66% | -17,197 | -18.81% | 91,424 |
| Howard | 58,556 | 51.92% | 49,809 | 44.17% | 3,643 | 3.23% | 771 | 0.68% | 8,747 | 7.76% | 112,779 |
| Kent | 3,627 | 44.86% | 4,155 | 51.39% | 270 | 3.34% | 33 | 0.41% | -528 | -6.53% | 8,085 |
| Montgomery | 232,453 | 62.54% | 124,580 | 33.52% | 12,485 | 3.36% | 2,170 | 0.58% | 107,873 | 29.02% | 371,688 |
| Prince George's | 216,119 | 79.48% | 49,987 | 18.38% | 4,497 | 1.65% | 1,306 | 0.48% | 166,132 | 61.10% | 271,909 |
| Queen Anne's | 6,257 | 37.33% | 9,970 | 59.48% | 446 | 2.66% | 88 | 0.53% | -3,713 | -22.15% | 16,761 |
| Somerset | 3,785 | 49.78% | 3,609 | 47.46% | 142 | 1.87% | 68 | 0.89% | 176 | 2.31% | 7,604 |
| St. Mary's | 11,912 | 40.38% | 16,856 | 57.14% | 568 | 1.93% | 165 | 0.56% | -4,944 | -16.76% | 29,501 |
| Talbot | 5,854 | 38.43% | 8,874 | 58.25% | 424 | 2.78% | 82 | 0.54% | -3,020 | -19.82% | 15,234 |
| Washington | 18,221 | 38.38% | 27,948 | 58.88% | 1,027 | 2.16% | 274 | 0.58% | -9,727 | -20.49% | 47,470 |
| Wicomico | 14,469 | 45.51% | 16,338 | 51.39% | 762 | 2.40% | 226 | 0.71% | -1,869 | -5.88% | 31,795 |
| Worcester | 9,389 | 45.24% | 10,742 | 51.76% | 482 | 2.32% | 140 | 0.67% | -1,353 | -6.52% | 20,753 |
| Totals | 1,145,782 | 56.57% | 813,797 | 40.18% | 53,768 | 2.65% | 12,133 | 0.60% | 331,985 | 16.39% | 2,025,480 |
Results by congressional district[]
Gore won 5 of the state's 8 congressional districts, including one that elected a Republican to congress. [2]
| District | Gore | Bush | Representative |
|---|---|---|---|
| 1st | 44% | 53% | Wayne Gilchrest |
| 2nd | 41% | 55% | Bob Ehrlich |
| 3rd | 63% | 34% | Ben Cardin |
| 4th | 84% | 13% | Albert Wynn |
| 5th | 55% | 42% | Steny Hoyer |
| 6th | 38% | 58% | Roscoe Bartlett |
| 7th | 84% | 14% | Elijah Cummings |
| 8th | 60% | 36% | Connie Morella |
Electors[]
Technically the voters of Maryland cast their ballots for electors: representatives to the Electoral College. Maryland is allocated 10 electors because it has 8 congressional districts and 2 senators. All candidates who appear on the ballot or qualify to receive write-in votes must submit a list of 10 electors, who pledge to vote for their candidate and his or her running mate. Whoever wins a plurality of votes in the state is awarded all ten electoral votes. Their chosen electors then vote for president and vice president. Although electors are pledged to their candidate and running mate, they are not obligated to vote for them. An elector who votes for someone other than his or her candidate is known as a faithless elector.
The electors of each state and the District of Columbia met on December 18, 2000[3] to cast their votes for president and vice president. The Electoral College itself never meets as one body. Instead the electors from each state and the District of Columbia met in their respective capitols.
The following were the members of the Electoral College from the state. All were pledged to and voted for Gore and Lieberman:[4]
- Clarence W. Blount
- Gene W. Counihan
- Howard Friedman
- Mary Ann E. Love
- Thomas V. Mike Miller
- Mary Butler Murphy
- Mary Jo Neville
- Gregory Pecoraro
- Ina Taylor
See also[]
References[]
- ^ Dave Leip's Atlas of U.S. Presidential Elections; 2000 Presidential General Election Results – Maryland. Retrieved on 2011-06-17.
- ^ https://elections.maryland.gov/elections/2000/results/preg01pre.html
- ^ 2000 Post-Election Timeline of Events. Uselectionatlas.org. Retrieved on 2011-06-17.
- ^ 2000 Archived 2012-02-12 at the Wayback Machine. President Elect. Retrieved on 2011-06-17.
| show State and district results of the 2000 United States presidential election |
|---|

- United States presidential elections in Maryland
- 2000 United States presidential election by state
- 2000 Maryland elections