Election in Montana
Main article: 2012 United States presidential election
2012 United States presidential election in Montana
Nominee
Mitt Romney Barack Obama
Party
Republican
Democratic
Home state
Massachusetts
Illinois
Running mate
Paul Ryan Joe Biden
Electoral vote
3
0
Popular vote
267,928
201,839
Percentage
55.35%
41.70%
County Results
Romney
50-60%
60-70%
70-80%
80-90%
Obama
40-50%
50-60%
60-70%
President before election Barack Obama Democratic
Elected President Barack Obama Democratic
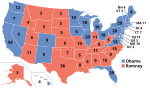
The 2012 United States presidential election in Montana took place on November 6, 2012, as part of the 2012 United States presidential election in which all 50 states plus the District of Columbia participated. Montana voters chose three electors to represent them in the Electoral College via a popular vote pitting incumbent Democratic President Barack Obama and his running mate, Vice President Joe Biden , against Republican challenger and former Massachusetts Governor Mitt Romney and his running mate, Congressman Paul Ryan .
Romney carried Montana with 55.35% of the vote to Obama's 41.70%, with a 13.65% margin of victory. Montana was the second-best state performance for Libertarian candidate Gary Johnson , carrying about 3% of the vote.
Romney performed much better than John McCain had in 2008 , when he narrowly won over Obama with only a 2.38% margin of victory. Romney also won over five counties that voted for Obama in 2008. Most of the counties Obama won were either majority Native American (such as Big Horn , Blaine , Glacier , and Roosevelt ) or have some of Montana's most populous cities and towns, such as Missoula County (containing its namesake city , the second largest in the state and home of the University of Montana ) and Silver Bow County (home to Butte and Montana Tech ).
As of 2020 this is the last time a Republican won Gallatin County and the Democrats won Hill County and Roosevelt County .
Republican primary [ ] 2012 Montana Republican caucuses
Candidate
Mitt Romney
Ron Paul
Rick Santorum
Home state
Massachusetts
Texas
Pennsylvania
Montana results by county
Mitt Romney
(Note:
Italicization indicates a withdrawn candidacy)
Members of the Montana delegation at the
2012 Republican National Convention The Republican caucuses took place on June 14 to 16, 2012 as the Montana state convention. Ten days before, the state delegates were selected by the central committee in each county[1] [2] [3] Republican National Convention in August.
2012 Montana Republican primary[4]
Candidate
Votes
Percentage
Delegates
Mitt Romney
96,121
68.4%
Ron Paul
20,227
14.4%
Rick Santorum 12,546
8.9%
Newt Gingrich 6,107
4.3%
No Preference
5,456
3.9%
Unpledged delegates:
25
Total:
140,457
26
Key: Withdrew prior to contest
General election [ ] The Republican ticket won by a margin of 13.65%
U.S. presidential election in Montana, 2012[5]
Party
Candidate
Votes
%
Republican Mitt Romney 267,928
55.35
Democratic
Barack Obama
201,839
41.70
Libertarian
Gary Johnson
14,165
2.93
Others
Others
116
0.02
Total votes
484,048
100.0
By county [ ]
Beaverhead 28.49%
1,371
68.35% 3,289 3.16%
152
4,812
Big Horn 62.30% 2,882 36.04%
1,667
1.66%
77
4,626
Blaine 56.52% 1,616 41.20%
1,178
2.27%
65
2,859
Broadwater 25.37%
764
71.47% 2,152 3.16%
95
3,011
Carbon 36.71%
2,146
60.43% 3,533 2.86%
167
5,846
Carter 12.09%
96
85.39% 678 2.52%
20
794
Cascade 44.07%
15,232
53.08% 18,345 2.86%
987
34,564
Chouteau 34.67%
978
62.32% 1,758 3.01%
85
2,821
Custer 34.17%
1,833
62.87% 3,373 2.96%
159
5,365
Daniels 23.54%
237
73.49% 740 2.98%
30
1,007
Dawson 27.56%
1,219
68.48% 3,029 3.96%
175
4,423
Deer Lodge 64.13% 2,860 32.47%
1,448
3.41%
152
4,460
Fallon 16.87%
237
80.28% 1,128 2.85%
40
1,405
Fergus 27.01%
1,640
70.12% 4,257 2.87%
174
6,071
Flathead 31.95%
13,892
65.11% 28,309 2.93%
1,275
43,476
Gallatin 45.86%
21,961
50.87% 24,358 3.26%
1,563
47,882
Garfield 09.43%
66
88.86% 622 1.71%
12
700
Glacier 65.68% 2,924 31.78%
1,415
2.54%
113
4,452
Golden Valley 22.96%
110
73.28% 351 3.76%
18
479
Granite 31.26%
533
64.93% 1,107 3.81%
65
1,705
Hill 49.90% 3,403 46.39%
3,164
3.71%
253
6,820
Jefferson 34.85%
2,272
62.19% 4,055 2.96%
193
6,520
Judith Basin 27.74%
337
70.29% 854 1.98%
24
1,215
Lake 43.63%
5,805
53.63% 7,135 2.74%
364
13,304
Lewis and Clark 46.88%
15,620
50.43% 16,803 2.69%
895
33,318
Liberty 26.01%
257
71.05% 702 2.94%
29
988
Lincoln 28.71%
2,552
68.14% 6,057 3.15%
280
8,889
Madison 28.45%
1,289
69.09% 3,130 2.45%
111
4,530
McCone 22.46%
223
75.03% 745 2.52%
25
993
Meagher 27.67%
269
68.93% 670 3.4%
33
972
Mineral 34.71%
700
60.29% 1,216 5.01%
101
2,017
Missoula 57.39% 32,824 39.61%
22,652
3.%
1,716
57,192
Musselshell 20.44%
492
76.15% 1,833 3.41%
82
2,407
Park 43.15%
3,783
53.71% 4,709 3.15%
276
8,768
Petroleum 16.44%
49
80.54% 240 3.02%
9
298
Phillips 21.14%
471
75.76% 1,688 3.1%
69
2,228
Pondera 35.86%
975
61.53% 1,673 2.61%
71
2,719
Powder River 16.55%
170
81.11% 833 2.34%
24
1,027
Powell 31.99%
888
65.06% 1,806 2.95%
82
2,776
Prairie 23.76%
167
73.97% 520 2.28%
16
703
Ravalli 32.81%
7,285
64.43% 14,307 2.77%
614
22,206
Richland 21.57%
1,002
75.57% 3,510 2.86%
133
4,645
Roosevelt 56.81% 2,086 41.23%
1,514
1.96%
72
3,672
Rosebud 40.36%
1,422
56.88% 2,004 2.75%
97
3,523
Sanders 29.15%
1,720
67.45% 3,980 3.41%
201
5,901
Sheridan 34.49%
665
62.60% 1,207 2.9%
56
1,928
Silver Bow 64.79% 10,857 32.41%
5,430
2.8%
469
16,756
Stillwater 26.54%
1,248
70.97% 3,337 2.49%
117
4,702
Sweet Grass 22.44%
475
75.30% 1,594 2.27%
48
2,117
Teton 32.98%
1,082
64.40% 2,113 2.62%
86
3,281
Toole 27.69%
582
68.51% 1,440 3.81%
80
2,102
Treasure 25.05%
114
70.11% 319 4.84%
22
455
Valley 35.89%
1,385
60.56% 2,337 3.55%
137
3,859
Wheatland 27.42%
272
69.86% 693 2.72%
27
992
Wibaux 18.01%
98
77.39% 421 4.6%
25
544
Yellowstone 38.37%
26,403
58.86% 40,500 2.77%
1,904
68,807
Counties that flipped from Democratic to Republican [ ] Cascade (largest city: Great Falls )Gallatin (largest city: Bozeman )Lake (largest city: Polson )Lewis and Clark (largest city: Helena )Rosebud (largest city: Colstrip )See also [ ] References [ ] External links [ ] hide State and district results of the 2012 United States presidential election
Alabama Alaska Arizona Arkansas California Colorado Connecticut Delaware District of Columbia Florida Georgia Hawaii Idaho Illinois Indiana Iowa Kansas Kentucky Louisiana Maine Maryland Massachusetts Michigan Minnesota Mississippi Missouri Montana Nebraska Nevada New Hampshire New Jersey New Mexico New York North Carolina North Dakota Ohio Oklahoma Oregon Pennsylvania Rhode Island South Carolina South Dakota Tennessee Texas Utah Vermont Virginia Washington West Virginia Wisconsin Wyoming
show (2008 ← ) 2012 United States presidential election (→ 2016 )
Democratic Party
Candidates
Incumbent nominee
Barack Obama
campaign endorsements positions Incumbent VP nominee
Joe Biden
positions Challengers
Bob Ely Keith Judd Warren Mosler Darcy Richardson
Vermin Supreme Randall Terry John Wolfe
Republican Party
Candidates
Nominee
Mitt Romney
campaign endorsements positions VP nominee
Paul Ryan
positions Candidates
Michele Bachmann
campaign Herman Cain
campaign positions Mark Callahan Jack Fellure Newt Gingrich
campaign positions Stewart Greenleaf Jon Huntsman
campaign Gary Johnson
campaign Fred Karger Andy Martin Thaddeus McCotter
campaign Jimmy McMillan Roy Moore Ron Paul
campaign positions Tim Pawlenty
campaign Rick Perry
campaign positions Buddy Roemer
campaign Rick Santorum
campaign
Libertarian Party
Candidates
Nominee
Gary Johnson
campaign VP nominee
Jim Gray Candidates
Carl Person Sam Sloan R. Lee Wrights
Green Party
Candidates
Nominee
Jill Stein
campaign VP nominee
Cheri Honkala Candidates
Stewart Alexander Roseanne Barr
show Other third-party and independent candidates
American Independent Party
Nominee
Tom Hoefling Candidates
Wiley Drake Virgil Goode
campaign Edward C. Noonan Laurie Roth American Third Position Party
Nominee
Merlin Miller VP nominee
Virginia Abernethy Constitution Party
Convention Nominee
Virgil Goode (campaign )VP nominee
Jim Clymer
Candidates
Darrell Castle
Laurie Roth Robby Wells Freedom Socialist Party Grassroots Party Justice Party
Nominee
Rocky Anderson VP nominee
Luis J. Rodriguez Socialism and Liberation Peace and Freedom Party
Nominee
Roseanne Barr VP nominee
Cindy Sheehan Candidates
Stewart Alexander Rocky Anderson Stephen Durham
Peta Lindsay Prohibition Party
Nominee
Jack Fellure Candidates
James Hedges Reform Party
Nominee
Andre Barnett Candidates
Laurence Kotlikoff Darcy Richardson
Buddy Roemer
campaign Robby Wells Socialist Equality Party Socialist Workers Party Socialist Party
Nominee
Stewart Alexander (campaign )VP nominee
Alejandro Mendoza Independents and others
Objectivist Party
Tom Stevens Independents
Lee Abramson Randy Blythe Jeff Boss Robert Burck Terry Jones Joe Schriner Michael Bloomberg
draft
Other 2012 elections :House Senate Gubernatorial
show United States presidential primaries and caucuses
Election timelines National polling
Democratic Party
2008 2016 2020 Republican Party
2008 2012 2016 2020 State polling
Democratic Party
2004 2008 2016 2020 Republican Party
2008 2012 2016 2020 Fundraising Debates and forums
Democratic Party 2004 2008 2016 2020
debates forums Republican Party 2008 2012 2016 2020 Libertarian Party
2016 Green Party
2016 Straw polls Major events
Iowa caucuses New Hampshire primary Nevada caucuses South Carolina primary Super Tuesday Caucuses primaries
Democratic Party
1912 1916 1920 1924 1928 1932 1936 1940 1944 1948 1952 1956 1960 1964 1968 1972 1976 1980 1984 1988 1992 1996 2000 2004 2008 2012 2016 2020 Republican Party Libertarian Party Green Party Reform Party Constitution Party
Results breakdown National
Democratic Party
1832 1835 1840 1844 1848 1852 1856 1860 1864 1868 1872 1876 1880 1884 1888 1892 1896 1900 1904 1908 1912 1916 1920 1924 1928 1932 1936 1940 1944 1948 1952 1956 1960 1964 1968 1972 1976 1980 1984 1988 1992 1996 2000 2004 2008 2012 2016 2020 Republican Party Libertarian Party
1983 1987 1991 1996 2000 2004 2008 2010 2012 2014 2016 2020 Green Party Defunct
Whig Party Greenback Party Populist Party
1892 1896 1900 • 1904 • 1908 Progressive Party
Reforms