Election in Mississippi
Main article: 2016 United States presidential election
2016 United States presidential election in Mississippi
Nominee
Donald Trump Hillary Clinton
Party
Republican
Democratic
Home state
New York
New York
Running mate
Mike Pence Tim Kaine
Electoral vote
6
0
Popular vote
700,714
485,131
Percentage
County Results
Trump
40–50%
50–60%
60–70%
70–80%
80–90%
Clinton
40–50%
50–60%
60–70%
70–80%
80–90%
President before election Barack Obama Democratic
Elected President Donald Trump Republican
Treemap of the popular vote by county.
The 2016 United States presidential election in Mississippi was held on Tuesday, November 8, 2016, as part of the 2016 United States presidential election in which all 50 states plus the District of Columbia participated. Mississippi voters chose electors to represent them in the Electoral College via a popular vote, pitting the Republican Party 's nominee, businessman Donald Trump , and running mate Indiana Governor Mike Pence against Democratic Party nominee, former Secretary of State Hillary Clinton , and her running mate Virginia Senator Tim Kaine . Mississippi has six electoral votes in the Electoral College.[1]
Mississippi has not voted Democratic since 1976 . Since that time, Republicans have dominated the state's political elections, and so Trump was widely expected to win the state. Indeed, Trump carried it with 57.86% of the vote, while Clinton received 40.06%.[2] Mitt Romney won the state over Barack Obama in 2012 . This also marked the first time since 1988 that Madison County voted more Democratic than the state as a whole.
Primary elections [ ] Democratic primary [ ] 2016 Mississippi primary
Candidate
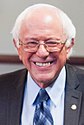
Hillary Clinton Bernie Sanders
Home state
New York
Vermont
Delegate count
31
5
Popular vote
187,334
37,748
Percentage
82.47%
16.62%
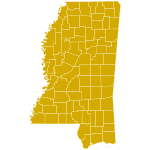
Mississippi results by county
Hillary Clinton
Main article: 2016 Mississippi Democratic primary
Mississippi Democratic primary, March 8, 2016
Candidate
Popular vote
Estimated delegates
Count
Percentage
Pledged
Unpledged
Total
Hillary Clinton
187,334
82.47%
31
3
34
Bernie Sanders
37,748
16.62%
5
2
7
Willie Wilson
919
0.40%
Martin O'Malley (withdrawn)
672
0.30%
Rocky De La Fuente
481
0.21%
Write-in
10
0.00%
Total
227,164
100%
36
5
41
Source: The Green Papers Mississippi Secretary of State
Republican primary [ ] Main article: 2016 Mississippi Republican primary
Republican primary results by county.
Trump
Cruz
Twelve candidates appeared on the Republican presidential primary ballot:[3]
Donald Trump Jeb Bush (withdrawn)Ben Carson (withdrawn)Chris Christie (withdrawn)Ted Cruz Carly Fiorina (withdrawn)Mike Huckabee (withdrawn)John Kasich Rand Paul (withdrawn)Marco Rubio Rick Santorum (withdrawn)Lindsey Graham (withdrawn)George Pataki (withdrawn)
Mississippi Republican primary, March 8, 2016
Candidate
Votes
Percentage
Actual delegate count
Bound
Unbound
Total
Donald Trump
196,659
47.24%
25
0
25
Ted Cruz
150,364
36.12%
15
0
15
John Kasich
36,795
8.84%
0
0
0
Marco Rubio
21,885
5.26%
0
0
0
Ben Carson (withdrawn)
5,626
1.35%
0
0
0
Jeb Bush (withdrawn)
1,697
0.41%
0
0
0
Mike Huckabee (withdrawn)
1,067
0.26%
0
0
0
Rand Paul (withdrawn)
643
0.15%
0
0
0
Rick Santorum (withdrawn)
510
0.12%
0
0
0
Chris Christie (withdrawn)
493
0.12%
0
0
0
Carly Fiorina (withdrawn)
224
0.05%
0
0
0
Lindsey Graham (withdrawn)
172
0.04%
0
0
0
George Pataki (withdrawn)
135
0.03%
0
0
0
Unprojected delegates:
0
0
0
Total:
416,270
100.00%
40
0
40
Source: The Green Papers
Polling [ ] See also: Statewide opinion polling for the United States presidential election, 2016 § Mississippi
General election [ ] Predictions [ ] The following are final 2016 predictions from various organizations for Mississippi as of Election Day.
Source
Ranking
As of
Los Angeles Times [4] Safe R
November 6, 2016
CNN [5] Safe R
November 8, 2016
Rothenberg Political Report [6] Safe R
November 7, 2016
Sabato's Crystal Ball [7] Safe R
November 7, 2016
NBC [8] Likely R
November 7, 2016
RealClearPolitics [9] Safe R
November 8, 2016
Fox News [10] Safe R
November 7, 2016
ABC [11] Safe R
November 7, 2016
Statewide results [ ] By congressional district [ ] Trump won 3 of 4 congressional districts.[13]
District
Trump
Clinton
Representative
1st 65%
32%
Trent Kelly
2nd 35%
64%
Bennie Thompson
3rd 61%
37%
Gregg Harper
4th 69%
28%
Steven Palazzo
By county [ ]
County
Clinton%
Clinton#
Trump%
Trump#
Others%
Others#
Total
Adams 56.06% 7,757 42.45%
5,874
1.48%
205
13,836
Alcorn 18.16%
2,684
79.95% 11,819 1.89%
280
14,783
Amite 38.26%
2,697
60.84% 4,289 0.91%
64
7,050
Attala 39.27%
3,242
59.31% 4,897 1.42%
117
8,256
Benton 42.84%
1,719
56.09% 2,251 1.07%
43
4,013
Bolivar 65.44% 9,046 33.20%
4,590
1.36%
188
13,824
Calhoun 29.86%
1,910
68.64% 4,390 1.50%
96
6,396
Carroll 30.39%
1,680
68.72% 3,799 0.89%
49
5,528
Chickasaw 46.25%
3,649
52.31% 4,127 1.44%
114
7,890
Choctaw 29.96%
1,218
68.59% 2,788 1.45%
59
4,065
Claiborne 86.80% 3,708 12.64%
540
0.56%
24
4,272
Clarke 33.18%
2,585
65.94% 5,137 0.89%
69
7,791
Clay 57.20% 5,722 41.49%
4,150
1.31%
131
10,003
Coahoma 71.57% 6,378 27.22%
2,426
1.21%
108
8,912
Copiah 51.93% 6,741 47.01%
6,103
1.06%
138
12,982
Covington 37.18%
3,276
61.68% 5,435 1.13%
100
8,811
DeSoto 31.34%
20,591
65.59% 43,089 3.07%
2,015
65,695
Forrest 41.75%
11,716
55.09% 15,461 3.16%
887
28,064
Franklin 35.01%
1,502
63.43% 2,721 1.56%
67
4,290
George 10.38%
1,027
87.92% 8,696 1.70%
168
9,891
Greene 18.14%
974
80.74% 4,335 1.12%
60
5,369
Grenada 42.08%
4,424
56.79% 5,970 1.13%
119
10,513
Hancock 18.96%
3,344
78.31% 13,811 2.73%
482
17,637
Harrison 33.44%
21,169
63.74% 40,354 2.83%
1,790
63,313
Hinds 71.39% 67,594 26.69%
25,275
1.91%
1,812
94,681
Holmes 82.83% 6,689 16.21%
1,309
0.97%
78
8,076
Humphreys 72.21% 3,071 27.06%
1,151
0.73%
31
4,253
Issaquena 56.51% 395 42.63%
298
0.86%
6
699
Itawamba 11.47%
1,117
86.99% 8,470 1.54%
150
9,737
Jackson 29.57%
14,657
67.85% 33,629 2.58%
1,281
49,567
Jasper 51.54% 4,368 47.65%
4,038
0.81%
69
8,475
Jefferson 86.45% 3,337 12.69%
490
0.85%
33
3,860
Jefferson Davis 59.64% 3,720 39.54%
2,466
0.82%
51
6,237
Jones 27.48%
7,791
71.01% 20,133 1.51%
428
28,352
Kemper 60.94% 2,827 38.33%
1,778
0.73%
34
4,639
Lafayette 40.57%
7,969
55.35% 10,872 4.08%
802
19,643
Lamar 21.10%
5,190
76.25% 18,751 2.65%
651
24,592
Lauderdale 38.19%
11,269
60.13% 17,741 1.68%
496
29,506
Lawrence 34.49%
2,195
64.28% 4,091 1.23%
78
6,364
Leake 42.42%
3,584
56.60% 4,782 0.98%
83
8,449
Lee 30.47%
10,029
67.51% 22,220 2.02%
664
32,913
Leflore 69.90% 7,787 28.83%
3,212
1.27%
141
11,140
Lincoln 29.34%
4,458
69.44% 10,550 1.22%
185
15,193
Lowndes 46.21%
11,819
51.89% 13,271 1.90%
485
25,575
Madison 40.85%
20,343
56.75% 28,265 2.40%
1,194
49,802
Marion 31.45%
3,677
67.01% 7,836 1.54%
180
11,693
Marshall 54.07% 8,023 44.39%
6,587
1.54%
229
14,839
Monroe 34.78%
5,524
64.01% 10,167 1.22%
193
15,884
Montgomery 42.33%
2,115
56.41% 2,818 1.26%
63
4,996
Neshoba 25.73%
2,715
72.77% 7,679 1.51%
159
10,553
Newton 29.20%
2,756
69.38% 6,548 1.42%
134
9,438
Noxubee 77.99% 4,347 21.53%
1,200
0.48%
27
5,574
Oktibbeha 48.88% 8,859 47.32%
8,576
3.80%
689
18,124
Panola 49.33%
7,431
49.45% 7,449 1.22%
184
15,064
Pearl River 16.47%
3,604
81.26% 17,782 2.27%
497
21,883
Perry 22.46%
1,220
76.12% 4,135 1.42%
77
5,432
Pike 49.31% 8,043 49.10%
8,009
1.58%
258
16,310
Pontotoc 18.38%
2,386
79.61% 10,336 2.02%
262
12,984
Prentiss 20.94%
2,067
77.47% 7,648 1.59%
157
9,872
Quitman 68.71% 2,312 29.75%
1,001
1.55%
52
3,365
Rankin 22.48%
14,110
75.16% 47,178 2.36%
1,480
62,768
Scott 40.56%
4,268
58.18% 6,122 1.25%
132
10,522
Sharkey 67.53% 1,479 31.60%
692
0.87%
19
2,190
Simpson 33.93%
3,874
64.74% 7,393 1.33%
152
11,419
Smith 21.20%
1,617
77.72% 5,928 1.08%
82
7,627
Stone 22.33%
1,573
75.32% 5,306 2.36%
166
7,045
Sunflower 70.07% 6,725 29.11%
2,794
0.82%
79
9,598
Tallahatchie 56.85% 3,337 41.94%
2,462
1.21%
71
5,870
Tate 33.77%
3,926
64.46% 7,495 1.77%
206
11,627
Tippah 19.95%
1,842
78.40% 7,240 1.66%
153
9,235
Tishomingo 11.93%
999
85.61% 7,166 2.46%
206
8,371
Tunica 74.77% 2,667 23.91%
853
1.32%
47
3,567
Union 17.50%
2,012
80.33% 9,235 2.17%
249
11,496
Walthall 40.32%
2,790
58.62% 4,056 1.06%
73
6,919
Warren 47.82%
9,284
50.30% 9,767 1.88%
365
19,416
Washington 67.64% 11,380 31.17%
5,244
1.19%
201
16,825
Wayne 36.71%
3,524
62.40% 5,990 0.89%
85
9,599
Webster 20.10%
1,019
78.44% 3,976 1.46%
74
5,069
Wilkinson 67.73% 2,857 31.25%
1,318
1.02%
43
4,218
Winston 43.35%
3,850
55.29% 4,910 1.36%
121
8,881
Yalobusha 42.49%
2,582
55.55% 3,376 1.96%
119
6,077
Yazoo 53.32% 5,369 45.66%
4,598
1.02%
103
10,070
Counties that flipped from Democratic to Republican [ ] Benton (largest town: Hickory Flat )Chickasaw (largest city: Houston )Panola (largest city: Batesville )Warren (largest city: Vicksburg )See also [ ] Democratic Party presidential debates, 2016 Democratic Party presidential primaries, 2016 Republican Party presidential debates, 2016 Republican Party presidential primaries, 2016 References [ ]
^ "Distribution of Electoral Votes" . National Archives and Records Administration . Retrieved November 29, 2020 .^ a b "Mississippi Election Results 2016" . August 1, 2017 – via NYTimes.com.^ Journal, Daily. "New Albany" . Daily Journal . ^ "Our final map has Clinton winning with 352 electoral votes. Compare your picks with ours" . Los Angeles Times . Retrieved 2016-11-13 .^ "Road to 270: CNN's general election map - CNNPolitics.com" . Cnn.com . 2016-11-08. Retrieved 2016-11-13 .^ "Presidential Ratings" . The Rothenberg Political Report. Retrieved August 16, 2021 .^ "Larry J. Sabato's Crystal Ball » 2016 President" . Centerforpolitics.org . 2016-11-07. Retrieved 2016-11-13 .^ Todd, Chuck. "NBC's Final Battleground Map Shows Clinton With a Significant Lead" . NBC News . Retrieved 2016-11-13 . ^ "2016 Election Maps - Battle for White House" . RealClearPolitics. Retrieved 2016-11-13 .^ "Electoral Scorecard: Map shifts again in Trump's favor, as Clinton holds edge" . Fox News . 2016-11-07. Retrieved 2016-11-13 .^ "The Final 15: The Latest Polls in the Swing States That Will Decide the Election" . Abcnews.go.com . 2016-11-07. Retrieved 2016-11-13 .^ "2016 Presidential General Election Results - Mississippi" .^ Walter, Amy; Wasserman, David; Cook, Charlie; Walter, Amy (2017-04-07). "Introducing the 2017 Cook Political Report Partisan Voter Index" . The Cook Political Report . Retrieved 2020-06-26 .
External links [ ]
State and district results of the 2016 United States presidential election
(← 2012 ) 2016 United States presidential election (2020 → )
Republican Party ▌ AIP · ▌ CPNY
Debates and forums Endorsements Primaries Polls (national · statewide · straw )
Results Convention VP candidate selection Candidates
Nominee
Donald Trump campaign endorsements
primary positions protests GOP opposition VP nominee: Mike Pence Other candidates
Jeb Bush
campaign positions Ben Carson
campaign Chris Christie
campaign Ted Cruz
campaign endorsements positions Mark Everson Carly Fiorina
campaign Jim Gilmore
campaign Lindsey Graham
campaign Mike Huckabee
campaign positions Bobby Jindal
campaign John Kasich
campaign endorsements Jimmy McMillan George Pataki
campaign Rand Paul
campaign positions Rick Perry
campaign positions Marco Rubio
campaign positions Rick Santorum
campaign Scott Walker
campaign
Democratic Party ▌ WEP · ▌ WFP
Political positions Endorsements Debates and forums Primaries Polls
Results Convention
VP candidate selection Candidates
Nominee
Hillary Clinton campaign endorsements
political non-political celebrities performers
positions Democratic opposition VP nominee: Tim Kaine Other candidates
Lincoln Chafee
campaign Rocky De La Fuente
campaign Paul T. Farrell Jr. Lawrence Lessig
campaign Martin O'Malley
campaign Bernie Sanders
campaign endorsements positions Jim Webb
campaign Willie Wilson
Libertarian Party ▌ IPNY
Debates and forums Primaries Convention Candidates
Nominee
Gary Johnson campaign endorsements positions VP nominee: Bill Weld Other candidates
John McAfee Austin Petersen Vermin Supreme
Green Party
Debates and forums Primaries Convention Candidates
Nominee
Jill Stein campaign endorsements VP nominee: Ajamu Baraka Other candidates
Darryl Cherney
Independents
Other third-party and independent candidates
American Delta Party ▌ Reform American Party (South Carolina) American Solidarity Party America's Party Constitution Party
Nominee
Darrell Castle
campaign VP nominee: Scott Bradley Other candidates
Tom Hoefling Nutrition Party Peace and Freedom Party ▌ PSL
Nominee: Gloria La Riva VP nominee: Dennis Banks PSL VP nominee: Eugene Puryear *Other candidates: Monica Moorehead Jill Stein Prohibition Party Socialist Action Socialist Equality Party Socialist Party USA
Nominee: Mimi Soltysik
VP nominee: Angela Nicole Walker Socialist Workers Party
Nominee: Alyson Kennedy VP nominee: Osborne Hart Pacifist Party Workers World Party
Nominee: Monica Moorehead Other Independent candidates * : These candidates were constitutionally ineligible to serve as President or Vice President.
United States presidential primaries and caucuses
Election timelines National polling
Democratic Party
2008 2016 2020 Republican Party
2008 2012 2016 2020 State polling
Democratic Party
2004 2008 2016 2020 Republican Party
2008 2012 2016 2020 Fundraising Debates and forums
Democratic Party 2004 2008 2016 2020
debates forums Republican Party 2008 2012 2016 2020 Libertarian Party
2016 Green Party
2016 Straw polls Major events
Iowa caucuses New Hampshire primary Nevada caucuses South Carolina primary Super Tuesday Caucuses primaries
Democratic Party
1912 1916 1920 1924 1928 1932 1936 1940 1944 1948 1952 1956 1960 1964 1968 1972 1976 1980 1984 1988 1992 1996 2000 2004 2008 2012 2016 2020 Republican Party Libertarian Party Green Party Reform Party Constitution Party
Results breakdown National
Democratic Party
1832 1835 1840 1844 1848 1852 1856 1860 1864 1868 1872 1876 1880 1884 1888 1892 1896 1900 1904 1908 1912 1916 1920 1924 1928 1932 1936 1940 1944 1948 1952 1956 1960 1964 1968 1972 1976 1980 1984 1988 1992 1996 2000 2004 2008 2012 2016 2020 Republican Party Libertarian Party
1983 1987 1991 1996 2000 2004 2008 2010 2012 2014 2016 2020 Green Party Defunct
Whig Party Greenback Party Populist Party
1892 1896 1900 • 1904 • 1908 Progressive Party
Reforms