Councillors for Birmingham City Council in the West Midlands , England are elected every 4 years (known as all-out elections ). The next elections are in 2022. Changes to ward boundaries were made in 2018. 101 councillors are elected from 69 wards .[1]
Political control [ ] Since 1973, political control of the council has been held by the following parties:[2]
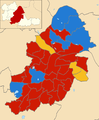
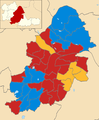
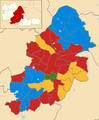
Council elections [ ] Result maps [ ] By-election results [ ] 2013–2017 [ ] Resignation of Labour Cllr Sam Burden.
Hall Green By-election, 4 May 2017
Party
Candidate
Votes
%
Labour Liz Clements
3,138
42.0
Liberal Democrats
Tanveer Choudhry
1,889
25.2
Conservative
Obaid Khan
1,683
22.5
UKIP
Alan Blumenthal
462
6.1
Green
Gareth Courage
307
4.1
Majority
1,249
16.7
Turnout
7,479
39.0
Death of Lib Dem Cllr Ray Hassall. [4]
Perry Barr By-election, 4 May 2017[5]
Party
Candidate
Votes
%
Liberal Democrats Morriam Jan
2,387
44.1
Labour
Mohammed Hanif
2,156
39.8
Conservative
Minu Sungu
558
10.3
Green
Matthew Ford
314
5.8
Majority
231
4.3
Turnout
5,415
33.7
Resignation of Labour Cllr Cath Grundy.
Kingstanding By-election, 13 February 2014
Party
Candidate
Votes
%
Conservative Gary Sambrook 1,571
47.0
Labour
Lorraine Owen
1,433
42.8
UKIP
Roger Tempest
266
7.9
N/A
Liberal Democrats
Graham Lippiatt
43
1.3
National Front
Terry Williams
33
1.0
Majority
138
4.1
Turnout
3,355
19
Conservative gain from Labour
Swing
2009-2013 [ ]
Sparkbrook By-election, 10 November 2011[6]
Party
Candidate
Votes
%
Labour Victoria Quinn
3,932
56.7
Respect
Mohammed Ishtiaq
2,301
33.2
Liberal Democrats
Adil Rashid
395
5.7
Green
Peter Tinsley
179
2.6
Conservative
Sahar Rezazadeh
133
1.9
Majority
1,631
23.5
Turnout
6,965
33.0
Labour gain from Respect
Swing
Sutton New Hall By-election, 22 October 2009[7]
Party
Candidate
Votes
%
Conservative David Barrie
1,633
58.3
Labour
Robert Pocock
505
18.0
UKIP
Maddy Westrop
344
12.3
Liberal Democrats
Robert Hardware
319
11.4
Majority
1,128
40.3
Turnout
2,801
15.9
Conservative hold
Swing
Sparkbrook By-election, 17 September 2009[8]
Party
Candidate
Votes
%
Respect Shokat Ali
2,495
39.6
Labour
Mohammed Azim
2,228
35.4
Conservative
Abdul Kadir
799
12.7
Liberal Democrats
Naeem Qureshi
506
8.0
Green
Charles Alldrick
213
3.4
Independent
Sakander Mahmood
55
0.9
Majority
267
4.2
Turnout
6,296
32.3
Respect hold
Swing
Lozells and East Handsworth By-election, 4 June 2009[9]
Party
Candidate
Votes
%
Labour Hendrina Quinnen
3,018
42.2
Liberal Democrats
Sabirul Islam
2,000
28.0
Conservative
Raja Khan
1,622
22.7
Green
Ankaret Harmer
297
4.2
UKIP
Melvin Ward
208
2.9
Majority
1,018
14.2
Turnout
7,145
38.8
Labour hold
Swing
2005-2009 [ ]
Brandwood By-election, 20 September 2007[10]
Party
Candidate
Votes
%
Labour Michael Leddy
1,998
42.7
Conservative
Ken Axford
1,663
35.6
BNP
Robert Purcell
290
6.2
Liberal Democrats
Brian Peace
285
6.1
Green
Anna Masters
193
4.1
Independent
Frank Chance
157
3.4
UKIP
Francois Jones
64
1.4
New Nationalist Party
Keith Axon
25
0.5
Majority
335
7.1
Turnout
4,675
26.2
Labour gain from Conservative
Swing
Tyburn By-election, 8 September 2005[11]
Party
Candidate
Votes
%
Labour Lynda Clinton
1,451
52.4
Conservative
Gerald Brien
982
35.5
Liberal Democrats
John Line
334
12.1
Majority
469
16.9
Turnout
2,767
15.0
Labour hold
Swing
Aston By-election, 28 July 2005 (3 seats)[12]
Party
Candidate
Votes
%
Liberal Democrats Ayoub Khan
2,081
Liberal Democrats Abdul Aziz
2,044
Liberal Democrats Abdul Khalique
1,905
Labour
Ziaul Islam
1,896
Labour
Anthony Kennedy
1,843
Labour
Changese Khan
1,578
Conservative
Raja Iqbal
282
Green
Anna Dunstan
182
Conservative
David Williams-Masinda
166
Conservative
Mohammed Mushtaq
148
Turnout
12,125
25.9
Liberal Democrats gain from Labour
Swing
Liberal Democrats gain from Labour
Swing
Liberal Democrats gain from Labour
Swing
Bordesley Green By-election, 28 July 2005 (3 seats)[12]
Party
Candidate
Votes
%
People's Justice Shaukat Ali
2,241
Labour Shafique Shah
2,183
People's Justice Saeed Mohammed
2,065
People's Justice
Choudhry Ullah
2,041
Labour
Zulfiqar Khan
2,009
Labour
Stewart Stacey
1,875
Liberal Democrats
Qamar Nawaz
1,372
Liberal Democrats
Nazar Hussain
1,117
Liberal Democrats
Azad Aslam
1,058
Green
Alan Clawley
314
Conservative
David Fazakerley
251
Conservative
Mohammed Shariff-Malik
154
Conservative
Jasbir Singh
153
Turnout
16,833
31.3
People's Justice gain from Labour
Swing
Labour hold
Swing
People's Justice gain from Labour
Swing
Moseley & Kings Heath By-election, 5 May 2005[13]
Party
Candidate
Votes
%
Labour Barry Henley
4,162
37.4
Liberal Democrats
Zaman Khan
3,898
35.1
Conservative
Barry Hands
1,889
16.9
Green
Stuart Masters
1,184
10.6
Majority
264
2.3
Turnout
11,133
61.1
Labour hold
Swing
2001-2005 [ ]
Stockland Green By-election, 20 November 2003[14]
Party
Candidate
Votes
%
Labour Sarah-Jayne Plant
1,377
43.0
Liberal Democrats
Anthony Foley
759
23.7
Conservative
Derek Green
512
16.0
BNP
Robert Purcell
503
15.7
Socialist Alliance
Maria Werson
48
1.5
Majority
618
19.3
Turnout
3,199
18.1
Labour hold
Swing
Hodge Hill By-election, 28 February 2002[15]
Party
Candidate
Votes
%
Labour
1,172
42.5
Conservative
1,044
37.9
Liberal Democrats
287
10.4
UKIP
255
9.2
Majority
128
4.6
Turnout
2,758
15.0
Labour gain from Conservative
Swing
Kingsbury By-election, 11 October 2001[16]
Party
Candidate
Votes
%
Labour Michael Sharpe
1,113
57.2
Conservative
Craig Smeaton
679
34.9
Liberal Democrats
Emily Rohaise
105
5.4
Socialist Alliance
Steven Godward
37
1.9
UKIP
Alan Ware
13
0.7
Majority
434
22.3
Turnout
1,947
16.6
Labour hold
Swing
Fox Hollies By-election, 7 June 2001[16]
Party
Candidate
Votes
%
Labour Matthew Redmond
4,311
52.5
Liberal Democrats
Penelope Wagg
2,838
34.6
Conservative
Paul Burke
1,010
12.3
Majority
1,473
17.9
Turnout
8,159
48.2
Labour gain from Liberal Democrats
Swing
1997-2001 [ ] Death of Labour Cllr David Wells.
Stockland Green By-election, 15 July 1999[16]
Party
Candidate
Votes
%
Labour Margaret Langley
1,369
70.2
Conservative
Paul Valdmanis
432
22.1
Justice for the Elderly
Christopher F S Rose
229
11.7
Liberal Democrats
Derek P Parsons
148
7.6
Majority
937
48.1
Turnout
2,178
12.0
Labour hold
Swing
Death of Labour Cllr Anthony Rust.
Harborne By-election, 11 September 1997[16]
Party
Candidate
Votes
%
Conservative Mike Whitby 2,719
53.4
Labour
Stephen Cormell
1,859
36.5
Liberal Democrats
Conall Boyle
420
8.2
Green
Peter Beck
96
1.9
Majority
860
16.9
Turnout
5,094
29.0
Conservative gain from Labour
Swing
Aston By-election, 10 July 1997[16]
Party
Candidate
Votes
%
Labour
2,623
80.2
Liberal Democrats
426
13.0
Conservative
221
6.8
Majority
2,197
67.2
Turnout
3,270
Labour hold
Swing
King's Norton By-election, 10 July 1997[16]
Party
Candidate
Votes
%
Labour
1,731
64.9
Conservative
700
26.3
Liberal Democrats
184
6.9
BNP
50
1.9
Majority
1,031
38.6
Turnout
2,665
16.4
Labour hold
Swing
1993-1997 [ ] Death of Lib Dem Cllr Neil Biddlestone.
By-election, 30 January 1997[16]
Party
Candidate
Votes
%
Liberal Democrats James Whorwood
3,134
59.9
Labour
Brenden O'Brien
1,626
31.1
Conservative
Peter Osborn
407
7.8
UKIP
Alan Ware
60
1.1
Majority
1,508
26.1
Turnout
5,227
26.2
Liberal Democrats hold
Swing
Yardley By-election, 7 November 1996[16]
Party
Candidate
Votes
%
Liberal Democrats Barbara Jackson
3,285
67.5
Labour
Lewis Berry
1,191
24.4
Conservative
Bryan Brooke
395
8.1
Majority
2,094
42.9
Turnout
4,871
27.5
Liberal Democrats hold
Swing
Death of Labour Cllr Edward Rochford.
Hodge Hill By-election, 11 January 1996[16]
Party
Candidate
Votes
%
Labour Anita Ward
1,240
52.0
Conservative
Barry Hands
790
33.2
Liberal Democrats
Sean Hagan
352
14.8
Majority
450
18.9
Turnout
2,382
12.6
Labour hold
Swing
Death of Labour Cllr Paul Haymeraj.
Small Heath By-election, 12 May 1994[16]
Party
Candidate
Votes
%
Labour Douglas McCarrick
3,268
62.0
Small Heath Res
Kenneth Greaves
920
17.5
Conservative
Nasreen Kayani
861
16.3
Green
Alan Clawley
181
3.4
Natural Law
Tessa Portsmouth
37
0.7
Majority
2,348
44.6
Turnout
5,267
25.6
Labour hold
Swing
Death of Conservative Cllr Arthur Walker.
Quinton By-election, 24 March 1994[16]
Party
Candidate
Votes
%
Labour Richard Bashford
2,919
46.6
Conservative
Edward Grant
2,625
41.9
Liberal Democrats
Susan Sherwen
529
8.4
Green
Peter Beck
195
3.1
Majority
294
0.1
Turnout
5,267
39.4
Labour gain from Conservative
Swing
Death of Conservative Cllr Clare Fancote.
Sutton Vesey By-election, 9 September 1993[16]
Party
Candidate
Votes
%
Conservative John Hood
3,539
45.8
Liberal Democrats
Marie Cope
3,118
40.3
Labour
Frank Hooley
797
10.3
National Front
Louise Holland
171
2.2
Monster Raving Loony
Tessa Portsmouth
104
1.4
Majority
421
0.1
Turnout
7,729
33.7
Conservative hold
Swing
Resignation of Labour Cllr Khalid Mahmood.
Sparkbrook By-election, 22 April 1993[16]
Party
Candidate
Votes
%
Labour Anthony Kennedy
2,232
55.9
Conservative
Aziz-ul Hassan
1,306
32.7
Liberal Democrats
Sean Hagan
311
7.8
Green
Charles Alldrick
147
3.7
Majority
926
23.2
Turnout
3,996
24.0
Labour hold
Swing
Resignation of Lib Dem Cllr Paul Shefield.
Acock's Green By-election, 11 February 1993[16]
Party
Candidate
Votes
%
Liberal Democrats Neil Biddlestone
3,462
62.1
Labour
Ian Jamieson
1,407
25.2
Conservative
Clifford Beasley
705
12.6
Majority
2,055
36.8
Turnout
5,577
27.6
Liberal Democrats hold
Swing
Resignation of Labour Cllr Fred Grattidge.
Fox Hollies By-Election 11 February 1993[16]
Party
Candidate
Votes
%
Labour Stanley Yapp
1,539
47.2
Conservative
Leonard Kirby
937
28.7
Liberal Democrats
Nicola Henry
782
24.0
Majority
602
18.4
Turnout
3,261
18.6
Labour hold
Swing
Before 1993 [ ]
Erdington By-Election 25 October 1973[16]
Party
Candidate
Votes
%
Labour Graham Vickers
3,179
Conservative
Donald Bailey
1,770
Liberal Democrats
Dennis Pearson
1,716
National Front
Reginald Barlow
371
Majority
1,409
Turnout
Labour hold
Swing
References [ ] External links [ ] show Metropolitan districts of England
Districts
Barnsley Birmingham Bolton Bradford Bury Calderdale Coventry Doncaster Dudley Gateshead Kirklees Knowsley Leeds Liverpool Manchester Newcastle upon Tyne North Tyneside Oldham Rochdale Rotherham Salford Sandwell Sefton Sheffield Solihull South Tyneside St Helens Stockport Sunderland Tameside Trafford Wakefield Walsall Wigan Wirral Wolverhampton Councils Local elections