Environmental Performance Index

The Environmental Performance Index (EPI) is a method of quantifying and numerically marking the environmental performance of a state's policies. This index was developed from the Pilot Environmental Performance Index, first published in 2002, and designed to supplement the environmental targets set forth in the United Nations Millennium Development Goals.[1]
The EPI was preceded by the Environmental Sustainability Index (ESI), published between 1999 and 2005. Both indices were developed by Yale University (Yale Center for Environmental Law and Policy) and Columbia University (Center for International Earth Science Information Network) in collaboration with the World Economic Forum and the Joint Research Centre of the European Commission. The ESI was developed to evaluate environmental sustainability relative to the paths of other countries. Due to a shift in focus by the teams developing the ESI, the EPI uses outcome-oriented indicators, then working as a benchmark index that can be more easily used by policy makers, environmental scientists, advocates and the general public.[2] Other leading indices like the Global Green Economy Index (GGEI)[3] provide an integrated measure of the environmental, social and economic dynamics of national economies. The GGEI utilizes EPI data for the environmental dimension of the index while also providing a performance assessment of efficiency sectors (e.g. transport, buildings, energy), investment, green innovation and national leadership around climate change.
The Environmental Performance Index for the year 2020 ranks 180 countries. The top five countries are Denmark, Luxembourg, Switzerland, United Kingdom and France.[4]
Methodology[]
EPI calculation variables change often as can be seen below. This should be taken into account when observing country performance through several reports, as it can lead to score and ranking changes founded just on methodology modification.
2020 variables[5][]
| Objective | Issue Category | Indicator |
|---|---|---|
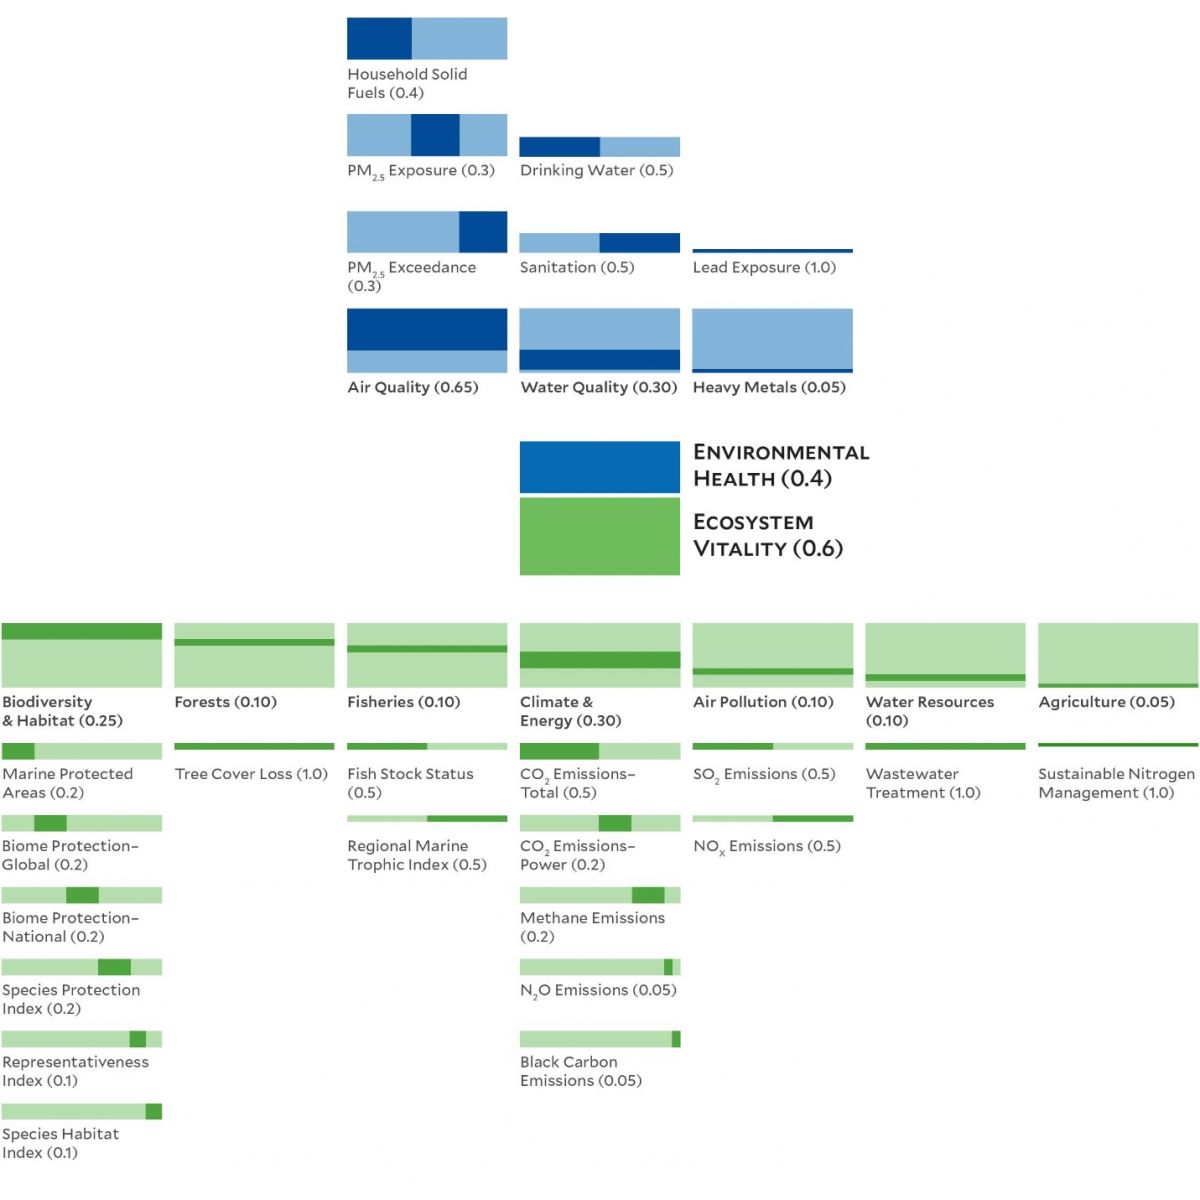
| Environmental health (40%) | Air quality (65%) | Air pollution - Household Solid Fuels (40%) |
| Air pollution - Average Exposure to PM2.5 (30%) | ||
| Air pollution - PM2.5 Exceedance (30%) | ||
| Water Quality (30%) | Unsafe Sanitation (50%) | |
| Drinking Water Quality (50%) | ||
| Heavy metals (5%) | Lead Exposure (100%) | |
| Ecosystem vitality (60%) | Biodiversity and habitat (25%) | Marine Protected Areas (20%) |
| Biome Protection (Global) (20%) | ||
| Biome Protection (National) (20%) | ||
| Species Protection Index (20%) | ||
| Representativeness Index (10%) | ||
| Species Habitat Index (10%) | ||
| Forests (10%) | Tree Cover Loss (100%) | |
| Fisheries (10%) | Fish Stock Status (50%) | |
| Regional Marine Trophic Index (50%) | ||
| Climate and energy (30%) | CO2 Emissions (Total) (50%) | |
| CO2 Emissions (Power) (20%) | ||
| Methane Emissions (20%) | ||
| N2O Emissions (5%) | ||
| Black Carbon Emissions (5%) | ||
| Air Pollution (10%) | SO2 Emissions (50%) | |
| NOX Emissions (50%) | ||
| Water resources (10%) | Wastewater treatment (100%) | |
| Agriculture (5%) | Sustainable Nitrogen management (100%) |
2018 variables[]
The variables in 2018 are largely similar to those from 2016, but have changed in details and some weights. Notably environmental Health is now weighted at 40% and ecosystem vitality at 60%.[6]
| Objective | Issue Category | Indicator |
|---|---|---|
| Environmental health (40%) | Health Impacts (33%) | Environmental Risk Exposure (100%) |
| Air quality (33%) | Household Air Quality (30%) | |
| Air pollution - Average Exposure to PM2.5 (30%) | ||
| Air pollution - PM2.5 Exceedance (30%) | ||
| Air pollution - Average Exposure to NO2 (10%) | ||
| Water and sanitation (33%) | Unsafe Sanitation (50%) | |
| Drinking Water Quality (50%) | ||
| Ecosystem vitality (60%) | Water resources (25%) | Wastewater treatment (100%) |
| Agriculture (10%) | Nitrogen use efficiency (75%) | |
| Nitrogen balance (25%) | ||
| Forests (10%) | Change in forest cover (100%) | |
| Fisheries (5%) | Fish stocks (100%) | |
| Biodiversity and habitat (25%) | Terrestrial Protected Areas (National Biome Weights) (20%) | |
| Terrestrial protected areas (Global Biome Weights) (20%) | ||
| Marine protected areas (20%) | ||
| Species protection (National) (20%) | ||
| Species protection (Global) (20%) | ||
| Climate and energy (25%) | Trend in carbon intensity (75%) | |
| Trend in CO2 emissions per kWh (25%) |
EPI scores[]
2020[]
The Environmental Performance Index for the year 2020 ranks 180 countries.[7]
Top 30 countries and score
 Denmark 82.5
 Luxembourg 82.3
 Switzerland 81.5
 United Kingdom 81.3
 France 80
 Austria 79.6
 Finland 78.9
 Sweden 78.7
 Norway 77.7
 Germany 77.2
 Netherlands 75.3
 Japan 75.1
 Australia 74.9
 Spain 74.3
 Belgium 73.3
 Ireland 72.8
 Iceland 72.3
 Slovenia 72
 New Zealand 71.3
 Canada 71
 Czech Republic 71
 Italy 71
 Malta 70.7
 United States of America 69.3
 Greece 69.1
 Slovakia 68.3
 Portugal 67
 South Korea 66.5
 Israel 65.8
 Estonia 65.3
 Cyprus 64.8
 Romania 64.7
2018[]
| Rank | Country | EPI score | Environmental Health (40% weight) |
Ecosystem Vitality (60% weight) |
|---|---|---|---|---|
| 1 | 87.42 | 93.57 | 83.32 | |
| 2 | 83.95 | 95.71 | 76.11 | |
| 3 | 81.60 | 98.20 | 70.53 | |
| 4 | 80.90 | 93.80 | 72.30 | |
| 5 | 80.51 | 94.41 | 71.24 | |
| 6 | 79.89 | 96.03 | 69.13 | |
| 7 | 79.12 | 95.07 | 68.48 | |
| 8 | 78.97 | 86.38 | 74.03 | |
| 9 | 78.77 | 95.92 | 67.34 | |
| 10 | 78.64 | 99.35 | 64.83 | |
| 11 | 78.57 | 98.41 | 65.34 | |
| 12 | 78.39 | 94.21 | 67.85 | |
| 13 | 78.37 | 88.68 | 71.50 | |
| 14 | 77.49 | 97.86 | 63.91 | |
| 15 | 77.38 | 89.37 | 69.39 | |
| 16 | 76.96 | 85.88 | 71.02 | |
| 17 | 75.96 | 95.96 | 62.63 | |
| 18 | 75.46 | 92.26 | 64.25 | |
| 19 | 75.01 | 94.14 | 62.25 | |
| 20 | 74.69 | 92.99 | 62.48 | |
| 21 | 74.12 | 97.95 | 58.23 | |
| 22 | 73.60 | 91.03 | 61.98 | |
| 23 | 72.84 | 69.85 | 74.83 | |
| 24 | 72.60 | 87.96 | 62.37 | |
| 25 | 72.18 | 97.51 | 55.29 | |
| 26 | 71.91 | 90.47 | 59.53 | |
| 27 | 71.19 | 93.91 | 56.04 | |
| 28 | 70.60 | 63.87 | 75.08 | |
| 29 | 69.33 | 72.57 | 67.18 | |
| 30 | 67.85 | 69.60 | 66.68 |
EPI report archive[]
Below is a list of links to the official archive of past reports
- 2016 EPI full report regional rankings and scores (pages 111 - 114)
- 2014 EPI full report regional rankings and scores (pages 121 - 123)
- 2010 EPI summary rankings and scores are on page 6. Includes pilot tend EPI
- 2010 EPI summary rankings and scores are on page 6
- 2008 EPI summary includes rankings and scores
- 2006 EPI pilot summary rankings and scores are on page 6
Criticisms[]
The methodology for the EPI has been criticized for its arbitrary choice of metrics which could introduce bias, and its poor performance as an indicator for environmental sustainability.[8] Additional criticisms center on the EPI's lack of specific policy suggestions, and the index's weighting biases against data deficient countries that has led to the overlooking of ecological progress in developing countries. Below is a quote from the abstract:
- Jordan spent 2001–2006 in a node represented by lower life expectancy due to particulate matter emissions (PME), but, from 2007 to 2010, the country shifted to a node with a lower PME magnitude—indicating a positive shift in overall environmental sustainability. By following the EPI ranking, the policymakers in Jordan may have assumed that their decisions between 2006 and 2008 led to a deterioration in environmental sustainability, when, in fact, the inconsistent nature of the weighting process involved in the EPI rankings is a likely cause...[8]
See also[]
References[]
- ^ Yale Center for Environmental Law & Policy, and Center for International Earth Science Information Network at Columbia University. "Environmental Performance Index". Retrieved 16 March 2008.
{{cite web}}:|author=has generic name (help)[dead link] - ^ Yale Center for Environmental Law & Policy / Center for International Earth Science Information Network at Columbia University. "2008 Environmental Performance Index Report" (PDF). Archived from the original (PDF) on 9 April 2008. Retrieved 18 March 2008.
{{cite web}}:|author=has generic name (help) See Executive Summary, pp. 32-35 for a detailed comparison between the ESI 2005, the EPI 2006 and the EPI 2008. - ^ "2016 Global Green Economy Index (GGEI)" (PDF).
- ^ "2020 EPI Results". Environmental Performance Index. Retrieved 22 November 2020.
- ^ "EPI 2020 variables".
- ^ "EPI 2018 variables".
- ^ "2020 EPI Results". Environmental Performance Index. Retrieved 22 November 2020.
- ^ a b Kanmani, Aiyshwariya; Obringer, Renee; Rachunok, Benjamin; Nateghi, Roshanak (11 January 2020). "Assessing Global Environmental Sustainability Via an Unsupervised Clustering Framework". Sustainability. 12 (2): 563. doi:10.3390/su12020563. Retrieved 15 May 2021.
External links[]
- Yale University – EPI – A collaboration between Yale and Columbia Universities
- Yale University – YCELP – Yale Center for Environmental Law & Policy
- 2018 Environmental Performance Index
- International rankings
- Sustainability metrics and indices