Federal electoral district in Manitoba, Canada
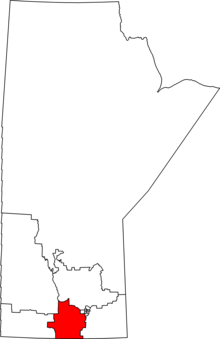
Portage—Lisgar electoral district Portage—Lisgar in relation to other Manitoba federal electoral districts as of the 2013 Representation Order.
Legislature House of Commons MP Candice Bergen Conservative District created 1996 First contested 1997 Last contested 2021 District webpage profile , map Population (2011 )[1] 91,019 Electors (2015)61,350 Area (km²)[2] 12,665 Pop. density (per km²) 7.2 Census subdivision(s) Portage la Prairie , Winkler , Morden , Stanley , Macdonald , Rhineland , Altona , Cartier , Carman
Portage—Lisgar is a federal electoral district in Manitoba , Canada, that has been represented in the House of Commons of Canada since 1997.
Demographics [ ]
Population, 2016 census[3]
97,354
Electors
60,246[4]
Area (km²)
12,509.09
Population density (people per km²)
7.8
Portage—Lisgar is the riding with the highest percentage of native German speakers (23.6% of the population) in all of Canada.[5] Inuktitut (Nunavut : 66.8%) and Panjabi (Punjabi) (Newton—North Delta , in British Columbia : 33.4%) exceed this concentration of native speakers of a non-official language in a single riding.
Geography [ ] This is a rural district that includes the cities of Portage la Prairie , Winkler , and Morden , and the towns of Carman and Altona .
History [ ] The electoral district was created in 1996 from the former districts of Lisgar—Marquette , Portage—Interlake and Provencher .
This riding lost territory to Dauphin—Swan River—Neepawa and Brandon—Souris , and gained territory from Provencher and Selkirk—Interlake during the 2012 electoral redistribution .
Members of Parliament [ ] This riding has elected the following Members of Parliament :
Current Member of Parliament [ ] Its Member of Parliament is Candice Bergen . She was first elected in the 2008 Canadian federal election
Election results [ ] Graph of election results in Portage—Lisgar (minor parties that never got 2% of the vote or didn't run consistently are omitted)
2019 Canadian federal election
Party
Candidate
Votes
%
Expenditures
Conservative Candice Bergen 31,600
70.8
+9.96
$60,166.75
Liberal Ken Werbiski
4,779
10.7
-15.09
$18,673.74
New Democratic Cindy Friesen
3,872
8.7
+2.5
$0.00
Green Beverley Eert
2,356
5.3
+1.33
$6,945.06
People's Aaron Archer
1,169
2.6
$1,048.91
Christian Heritage Jerome Dondo
860
1.9
-1.29
$21,830.60
Total valid votes/expense limit
44,636 100.0
Total rejected ballots
275
Turnout
44,911 68.5
Eligible voters
65,546
Conservative hold
Swing
+12.53
Source: Elections Canada [7] [4]
2015 Canadian federal election
Party
Candidate
Votes
%
Expenditures
Conservative Candice Bergen 25,060
60.84
-14.95
$91,365.21
Liberal Ken Werbiski
10,621
25.79
+19.81
$12,481.25
New Democratic Dean Harder
2,554
6.20
-4.01
$7,315.22
Green Bev Eert
1,637
3.97
-1.67
$7,832.39
Christian Heritage Jerome Dondo
1,315
3.19
+.89
$20,134.89
Total valid votes/expense limit
41,187 100.00 $208,924.52
Total rejected ballots
159 0.38 –
Turnout
41,346 66.52 –
Eligible voters
62,153
Conservative hold
Swing
-17.38
Source: Elections Canada [8] [9]
2008 Canadian federal election
Party
Candidate
Votes
%
Expenditures
Conservative Candice Hoeppner 22,036
68.3
-1.5
$57,186
Liberal Ted Klassen
4,374
13.6
+2.2
$19,807
Green Charlie Howatt
2,606
8.1
+3.0
$3,649
New Democratic Mohamed Alli
2,353
7.3
-4.1
$2,873
Christian Heritage Len Lodder
911
2.8
+0.1
$8,429
Total valid votes/expense limit
32,280 100.0 $83,296
Total rejected ballots
116 0.4 0.0
Turnout
32,396 53.8 –
2006 Canadian federal election
Party
Candidate
Votes
%
Expenditures
Conservative Brian Pallister 25,719
69.78
$44,321.83
Liberal Garry McLean
4,199
11.39
$13,875.88
New Democratic Daren Van Den Bussche
4,072
11.05
$2,450.07
Green Charlie Howatt
1,880
5.10
$4,073.82
Christian Heritage David Reimer
987
2.68
$9,372.57
Total valid votes
36,857
100.00
Total rejected ballots
123
Turnout
36,980
62.04
Electors on lists
59,609
Sources: Official Results, Elections Canada and Financial Returns, Elections Canada .
2004 Canadian federal election
Party
Candidate
Votes
%
Expenditures
Conservative Brian Pallister 22,939
65.93
$55,524.92
Liberal Don Kuhl
6,174
17.74
$70,773.27
New Democratic Daren Van Den Bussche
3,251
9.34
$13,159.49
Christian Heritage David Reimer
1,458
4.19
$12,986.64
Green Marc Payette
856
2.46
$649.69
Communist Allister Cucksey
117
0.34
$741.52
Total valid votes
34,795
100.00
Total rejected ballots
146
0.42
Turnout
34,941
57.35
Electors on lists
60,922
Percentage change figures are factored for redistribution. Conservative Party percentages are contrasted with the combined Canadian Alliance and Progressive Conservative percentages from 2000.
Sources: Official Results, Elections Canada and Financial Returns, Elections Canada .
2000 Canadian federal election
Party
Candidate
Votes
%
Expenditures
Alliance Brian Pallister 17,318
50.31
$44,417.63
Liberal Gerry J.E. Gebler
6,133
17.82
$44,267.57
Progressive Conservative Morley McDonald
5,339
15.51
$16,872.28
Independent Jake Hoeppner 3,558
10.34
$40,395.49
New Democratic Diane Beresford
2,073
6.02
$3,880.73
Total valid votes
34,421
100.00
Total rejected ballots
101
0.29
Turnout
34,522
61.56
Electors on lists
56,082
Sources: Official Results, Elections Canada and Financial Returns, Elections Canada .
1997 Canadian federal election
Party
Candidate
Votes
%
Expenditures
Reform Jake Hoeppner 13,532
40.25
$55,221
Progressive Conservative Brian Pallister 12,083
35.94
$52,473
Liberal Heather Mack
4,913
14.61
$14,412
New Democratic Glen Hallick
2,420
7.20
$9,391
Christian Heritage Martin Dewit
517
1.53
$2,674
Canadian Action Roy Lyall
159
0.47
$1,210
Total Valid Votes
33,624
100.00
Total Rejected Ballots
149
0.44
Turnout
33,773
60.63
Electors on lists
55,706
Sources: Official Results, Elections Canada and Financial Returns, Elections Canada .
See also [ ] References [ ] Notes [ ]
^ Statistics Canada : 2012^ Statistics Canada : 2012^ "Census Profile, 2016 Census: Portage--Lisgar [Federal electoral district], Manitoba" . Statistics Canada. Retrieved November 9, 2019 .^ a b "Election Night Results" . Elections Canada. Retrieved November 9, 2019 .^ "2011 Census of Canada: Topic-based tabulations | Detailed Mother Tongue (232), Knowledge of Official Languages (5), Age Groups (17A) and Sex (3) for the Population Excluding Institutional Residents of Canada, Provinces, Territories and Federal Electoral Districts (2003 Representation Order), 2011 Census" . 2.statcan.gc.ca. Retrieved November 16, 2012 .^ "Election Night Resuts — Portage—Lisgar — Elections Canada" . Elections Canada . Retrieved October 28, 2021 .{{cite web }}: CS1 maint: url-status (link )^ "List of confirmed candidates" . Elections Canada . Retrieved October 4, 2019 .^ Elections Canada – Confirmed candidates for Portage—Lisgar, 30 September 2015 ^ Elections Canada – Preliminary Election Expenses Limits for Candidates ^ Pundits' Guide to Canadian Elections
Coordinates : 49°40′01″N 98°18′18″W / 49.667°N 98.305°W / 49.667; -98.305