Sherwood Park—Fort Saskatchewan
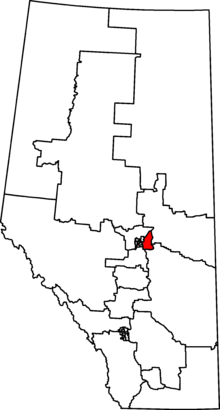 Sherwood Park—Fort Saskatchewan in relation to other Alberta federal electoral districts as of the 2013 Representation Order. | |||
| Federal electoral district | |||
| Legislature | House of Commons | ||
| MP |
Conservative | ||
| District created | 2013 | ||
| First contested | 2015 | ||
| Last contested | 2021 | ||
| District webpage | profile, map | ||
| Demographics | |||
| Population (2011)[1] | 111,541 | ||
| Electors (2019) | 95,317 | ||
| Area (km²)[1] | 1,271 | ||
| Pop. density (per km²) | 87.8 | ||
| Census division(s) | Division No. 11 | ||
| Census subdivision(s) | Fort Saskatchewan, Strathcona County | ||
Sherwood Park—Fort Saskatchewan is a federal electoral district in Alberta, Canada, that has been represented in the House of Commons of Canada since 2015.
Sherwood Park—Fort Saskatchewan was created by the 2012 federal electoral boundaries redistribution and was legally defined in the 2013 representation order. It came into effect upon the call of the 42nd Canadian federal election.[2] It was created out of parts of Edmonton—Sherwood Park and Vegreville—Wainwright.[3]
Demographics[]
Ethnic groups: 90.6% White, 4.2% Aboriginal, 1.4% South Asian
Languages: 90.2% English, 2.2% French, 1.8% German, 1.1% Ukrainian
Religions: 67.3% Christian (26.8% Catholic, 10.0% United Church, 5.5% Lutheran, 4.2% Anglican, 2.3% Baptist, 1.6% Christian Orthodox, 1.5% Pentecostal, 15.4% Other), 30.6% No religion
Median income (2010): $44,302
Average income (2010): $60,210
Members of Parliament[]
This riding has elected the following members of the House of Commons of Canada:
}}
| Parliament | Years | Member | Party | |
|---|---|---|---|---|
| Sherwood Park—Fort Saskatchewan Riding created from Edmonton—Sherwood Park and Vegreville—Wainwright |
||||
| 42nd | 2015–2019 | Garnett Genuis | Conservative | |
| 43rd | 2019–2021 | |||
| 44th | 2021–present | |||
Election results[]
| 2021 Canadian federal election | ||||||||
|---|---|---|---|---|---|---|---|---|
| Party | Candidate | Votes | % | ±% | Expenditures | |||
| Conservative | Garnett Genuis | 41,092 | 57.6 | -15.8 | ||||
| New Democratic | Aidan Theroux | 14,740 | 20.6 | +8.5 | ||||
| Liberal | Tanya Holm | 8,730 | 12.2 | +2.1 | ||||
| People's | John Wetterstrand | 5,004 | 7.0 | +5.2 | ||||
| Maverick | Todd Newberry | 849 | 1.2 | N/A | ||||
| Green | Sheldon Perris | 700 | 1.0 | -1.2 | ||||
| Independent | Charles Simpson | 283 | 0.4 | N/A | ||||
| Total valid votes | 71,398 | 99.6 | ||||||
| Total rejected ballots | 298 | 0.4 | ||||||
| Turnout | 71,696 | 73.9 | ||||||
| Eligible voters | 96,964 | |||||||
| Conservative hold | Swing | -12.2 | ||||||
| Source: Elections Canada[6] | ||||||||
| 2019 Canadian federal election | ||||||||
|---|---|---|---|---|---|---|---|---|
| Party | Candidate | Votes | % | ±% | Expenditures | |||
| Conservative | Garnett Genuis | 53,600 | 73.37 | +9.43 | $59,435.26 | |||
| New Democratic | Aidan Theroux | 8,867 | 12.14 | +2.33 | $8,662.98 | |||
| Liberal | Ron Thiering | 7,357 | 10.07 | -10.35 | $9,038.34 | |||
| Green | Laura Sanderson | 1,592 | 2.18 | -0.29 | $0.00 | |||
| People's | Darren Villetard | 1,334 | 1.83 | - | $1,638.00 | |||
| Veterans Coalition | Patrick McElrea | 300 | 0.41 | - | $0.00 | |||
| Total valid votes/expense limit | 73,050 | 99.56 | ||||||
| Total rejected ballots | 321 | 0.44 | +0.17 | |||||
| Turnout | 73,371 | 76.29 | +2.23 | |||||
| Eligible voters | 96,171 | |||||||
| Conservative hold | Swing | +3.55 | ||||||
| Source: Elections Canada[7][8] | ||||||||
| 2015 Canadian federal election | ||||||||
|---|---|---|---|---|---|---|---|---|
| Party | Candidate | Votes | % | ±% | Expenditures | |||
| Conservative | Garnett Genuis | 42,642 | 63.94 | +14.48 | $114,842.36 | |||
| Liberal | Rod Frank | 13,615 | 20.42 | +13.95 | $23,559.35 | |||
| New Democratic | Joanne Cave | 6,540 | 9.81 | -1.42 | $15,416.14 | |||
| Green | Brandie Harrop | 1,648 | 2.47 | -1.59 | $3,796.57 | |||
| Independent | James Ford | 1,563 | 2.34 | -26.44 | $5,420.41 | |||
| Libertarian | Stephen C. Burry | 678 | 1.02 | * | $3,387.73 | |||
| Total valid votes/expense limit | 66,686 | 99.73 | $228,934.10 | |||||
| Total rejected ballots | 180 | 0.27 | – | |||||
| Turnout | 66,866 | 74.06 | – | |||||
| Eligible voters | 90,289 | |||||||
| Conservative hold | Swing | +0.27 | ||||||
| Source: Elections Canada[9][10] | ||||||||
| 2011 federal election redistributed results[11] | |||
|---|---|---|---|
| Party | Vote | % | |
| Conservative | 24,890 | 49.46 | |
| Others | 14,485 | 28.78 | |
| New Democratic | 5,649 | 11.23 | |
| Liberal | 3,254 | 6.47 | |
| Green | 2,046 | 4.07 | |
References[]
- ^ a b Statistics Canada: 2011
- ^ Timeline for the Redistribution of Federal Electoral Districts
- ^ Report – Alberta
- ^ Government of Canada, Statistics Canada (February 8, 2012). "Statistics Canada: 2011 Census Profile". www12.statcan.gc.ca. Retrieved January 3, 2020.
- ^ Government of Canada, Statistics Canada (May 8, 2013). "2011 National Household Survey Profile - Federal electoral district (2013 Representation Order)". www12.statcan.gc.ca. Retrieved January 3, 2020.
- ^ "Election Night Results - Electoral Districts". Elections Canada. Retrieved September 2, 2021.
- ^ "List of confirmed candidates". Elections Canada. Retrieved October 4, 2019.
- ^ "Official Voting Results". Elections Canada. Retrieved July 3, 2021.
- ^ "Official Voting Results". Elections Canada. Retrieved July 3, 2021.
- ^ Elections Canada – Final Candidates Election Expenses Limits
- ^ Pundits' Guide to Canadian Elections
This article about a Canadian electoral district is a stub. You can help Wikipedia by . |
- Alberta federal electoral districts
- Fort Saskatchewan
- Sherwood Park
- Canadian constituency stubs