Lethbridge (electoral district)
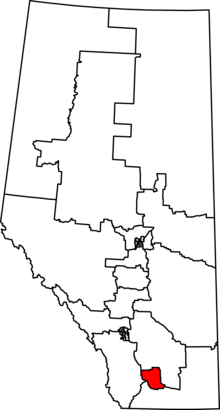 Lethbridge in relation to other Alberta federal electoral districts as of the 2013 Representation Order. | |||
| Federal electoral district | |||
| Legislature | House of Commons | ||
| MP |
Conservative | ||
| District created | 1987 | ||
| First contested | 1988 | ||
| Last contested | 2019 | ||
| District webpage | profile, map | ||
| Demographics | |||
| Population (2011)[1] | 105,999 | ||
| Electors (2019) | 88,226 | ||
| Area (km²)[2] | 3,028 | ||
| Pop. density (per km²) | 35 | ||
| Census division(s) | Division No. 2, Division No. 3 | ||
| Census subdivision(s) | Lethbridge, Lethbridge County, Coaldale | ||
Lethbridge (formerly known as Lethbridge—Foothills) is a federal electoral district in Alberta, Canada, that has been represented in the House of Commons of Canada since 1917. It incorporates the City of Lethbridge and Lethbridge County.
Lethbridge has had a centre-right MP at the federal level since the 1930s. The current MP for Lethbridge is Rachael Harder, who was first elected to parliament in 2015 for the Conservatives and was re-elected in 2019 as a Conservative MP.
History[]
This section does not cite any sources. (February 2021) |
This riding was originally created in 1914 from parts of Macleod riding.
In 1977, it was renamed "Lethbridge—Foothills".
In 1987, Lethbridge—Foothills was abolished and replaced by a new "Lethbridge" riding. The new riding was created from most of Lethbridge—Foothills, along with parts of Macleod and Medicine Hat ridings.
It has been represented by centre-right MPs without interruption since 1930. As in most other federal Alberta ridings outside of Calgary and Edmonton, it usually supports the major right-wing party of the day by landslide margins. Since 1945, a non-conservative party has only won 30 percent of the vote three times. Lethbridge itself is somewhat friendlier to centre-left candidates, at least at the provincial level. The Alberta New Democratic Party (NDP) won both seats in the provincial legislature from the city in the 2015 provincial election, but in 2019 lost the Lethbridge East riding to the United Conservative Party (UCP). The city has occasionally elected provincial Liberals in the past as well. At the federal level, however, the NDP and the Liberals are no match for the heavy conservative bent of the more rural areas.[citation needed]
This riding lost territory to Medicine Hat—Cardston—Warner and Foothills during the 2012 electoral redistribution.
Members of Parliament[]
| Parliament | Years | Member | Party | |
|---|---|---|---|---|
| Lethbridge Riding created from Macleod |
||||
| 13th | 1917–1921 | William Ashbury Buchanan | Government (Unionist) | |
| 14th | 1921–1925 | Lincoln Henry Jelliff | Progressive | |
| 15th | 1925–1926 | |||
| 16th | 1926–1930 | United Farmers | ||
| 17th | 1930–1935 | John Smith Stewart | Conservative | |
| 18th | 1935–1940 | John Horne Blackmore | Social Credit | |
| 19th | 1940–1945 | |||
| 20th | 1945–1949 | |||
| 21st | 1949–1953 | |||
| 22nd | 1953–1957 | |||
| 23rd | 1957–1958 | |||
| 24th | 1958–1962 | Deane Gundlock | Progressive Conservative | |
| 25th | 1962–1963 | |||
| 26th | 1963–1965 | |||
| 27th | 1965–1968 | |||
| 28th | 1968–1972 | |||
| 29th | 1972–1974 | Kenneth Earl Hurlburt | ||
| 30th | 1974–1979 | |||
| Lethbridge—Foothills | ||||
| 31st | 1979–1980 | Blaine Thacker | Progressive Conservative | |
| 32nd | 1980–1984 | |||
| 33rd | 1984–1988 | |||
| Lethbridge | ||||
| 34th | 1988–1993 | Blaine Thacker | Progressive Conservative | |
| 35th | 1993–1997 | Raymond Speaker | Reform | |
| 36th | 1997–2000 | Rick Casson | ||
| 2000–2000 | Alliance | |||
| 37th | 2000–2003 | |||
| 2003–2004 | Conservative | |||
| 38th | 2004–2006 | |||
| 39th | 2006–2008 | |||
| 40th | 2008–2011 | |||
| 41st | 2011–2015 | Jim Hillyer | ||
| 42nd | 2015–2019 | Rachael Harder | ||
| 43rd | 2019–present | |||
Current Member of Parliament[]
Its Member of Parliament is Rachael Harder. She was first elected in 2015. She is a member of the Conservative Party of Canada.
Election results[]
Lethbridge, 1988–present[]
| hide2021 Canadian federal election | ||||||||
|---|---|---|---|---|---|---|---|---|
| The 2021 general election will be held on September 20. | ||||||||
| Party | Candidate | Votes | % | ±% | ||||
| Christian Heritage | Geoffrey Capp | |||||||
| Conservative | Rachael Harder | |||||||
| Liberal | Devon Hargreaves | |||||||
| People's | Kimmie Hovan | |||||||
| New Democratic | Elaine Perez | |||||||
| Independent | Kim Siever | |||||||
| Total valid votes | ||||||||
| Total rejected ballots | ||||||||
| Turnout | ||||||||
| Eligible voters | ||||||||
| Source: Elections Canada[3] | ||||||||
| hide2019 Canadian federal election | ||||||||
|---|---|---|---|---|---|---|---|---|
| Party | Candidate | Votes | % | ±% | Expenditures | |||
| Conservative | Rachael Harder | 40,713 | 65.8 | +9.04 | $81,336.37 | |||
| New Democratic | Shandi Bleiken | 9,110 | 14.7 | -5.8 | none listed | |||
| Liberal | Amy Bronson | 8,443 | 13.6 | -4.9 | $39,899.72 | |||
| Green | Stephnie Watson | 1,939 | 3.1 | +0.53 | none listed | |||
| People's | Grant Hepworth | 1,007 | 1.6 | - | none listed | |||
| Christian Heritage | Marc Slingerland | 670 | 1.1 | -0.21 | none listed | |||
| Total valid votes/Expense limit | 61,882 | 100.0 | ||||||
| Total rejected ballots | 335 | |||||||
| Turnout | 62,217 | 70.5 | ||||||
| Eligible voters | 88,226 | |||||||
| Conservative hold | Swing | +7.42 | ||||||
| Source: Elections Canada[4][5] | ||||||||
| hide2015 Canadian federal election | ||||||||
|---|---|---|---|---|---|---|---|---|
| Party | Candidate | Votes | % | ±% | Expenditures | |||
| Conservative | Rachael Harder | 32,321 | 56.76 | +4.25 | $120,662.32 | |||
| New Democratic | Cheryl Meheden | 11,674 | 20.50 | -9.45 | $115,672.18 | |||
| Liberal | Mike Pyne | 10,532 | 18.50 | +9.36 | $34,405.68 | |||
| Green | Kas MacMillan | 1,461 | 2.57 | -1.92 | $2,377.70 | |||
| Christian Heritage | Geoffrey Capp | 746 | 1.31 | -2.61 | $13,993.12 | |||
| Rhinoceros | Solly Krygier-Paine | 209 | 0.37 | – | – | |||
| Total valid votes/Expense limit | 56,943 | 100.00 | $218,320.12 | |||||
| Total rejected ballots | 158 | 0.28 | – | |||||
| Turnout | 57,101 | 69.42 | – | |||||
| Eligible voters | 82,225 | |||||||
| Conservative hold | Swing | +6.85 | ||||||
| Source: Elections Canada[6][7] | ||||||||
| 2011 federal election redistributed results[8] | |||
|---|---|---|---|
| Party | Vote | % | |
| Conservative | 21,617 | 52.51 | |
| New Democratic | 12,329 | 29.95 | |
| Liberal | 3,759 | 9.13 | |
| Green | 1,845 | 4.48 | |
| Christian Heritage | 1,614 | 3.92 | |
| hide2011 Canadian federal election | ||||||||
|---|---|---|---|---|---|---|---|---|
| Party | Candidate | Votes | % | ±% | Expenditures | |||
| Conservative | Jim Hillyer | 27,173 | 56.51 | -10.45 | $72,625 | |||
| New Democratic | Mark Sandilands | 13,097 | 27.24 | +13.02 | $36,703 | |||
| Liberal | Michael Cormican | 4,030 | 8.38 | -0.92 | $23,067 | |||
| Green | Cailin Bartlett | 2,095 | 4.36 | -2.86 | $0 | |||
| Christian Heritage | Geoffrey Capp | 1,716 | 3.57 | +1.26 | $14,727 | |||
| Total valid votes/Expense limit | 48,086 | 100.00 | ||||||
| Total rejected ballots | 307 | 0.63 | +0.34 | |||||
| Turnout | 48,393 | 54.20 | +1 | |||||
| Eligible voters | 89,280 | – | – | |||||
| hide2008 Canadian federal election | ||||||||
|---|---|---|---|---|---|---|---|---|
| Party | Candidate | Votes | % | ±% | Expenditures | |||
| Conservative | Rick Casson | 31,714 | 66.96 | -0.34 | $78,789 | |||
| New Democratic | Mark Sandilands | 6,733 | 14.22 | +0.52 | $18,476 | |||
| Liberal | Michael Cormican | 4,404 | 9.30 | -1.95 | $21,463 | |||
| Green | Amanda Swagar | 3,420 | 7.22 | +3.68 | ||||
| Christian Heritage | Geoffrey Capp | 1,094 | 2.31 | -0.49 | $13,529 | |||
| Total valid votes/Expense limit | 47,365 | 100.00 | $94,223 | |||||
| Total rejected ballots | 138 | 0.29 | +0.04 | |||||
| Turnout | 47,503 | 53 | -9 | |||||
| hide2006 Canadian federal election | ||||||||
|---|---|---|---|---|---|---|---|---|
| Party | Candidate | Votes | % | ±% | Expenditures | |||
| Conservative | Rick Casson | 35,061 | 67.30 | +4.68 | ||||
| New Democratic | Melanee Thomas | 7,135 | 13.70 | +3.98 | ||||
| Liberal | Michael Cormican | 5,859 | 11.25 | -10.31 | ||||
| Green | Andrea Sheridan | 1,846 | 3.54 | +0.89 | ||||
| Christian Heritage | Marc Slingerland | 1,458 | 2.80 | +0.53 | ||||
| Independent | Howard Forsyth | 735 | 1.41 | N/A | ||||
| Total valid votes | 52,094 | 100.00 | ||||||
| Total rejected ballots | 132 | 0.25 | +0.03 | |||||
| Turnout | 52,226 | 63.7 | +4.0 | |||||
| hide2004 Canadian federal election | ||||||||
|---|---|---|---|---|---|---|---|---|
| Party | Candidate | Votes | % | ±% | Expenditures | |||
| Conservative | Rick Casson | 29,765 | 62.62 | -12.22 | $68,346 | |||
| Liberal | Ken Nicol | 10,250 | 21.56 | +4.62 | $34,339 | |||
| New Democratic | Melanee Thomas | 4,623 | 9.72 | +3.97 | $10,460 | |||
| Green | Erin Marie Matthews | 1,262 | 2.65 | – | $32 | |||
| Christian Heritage | Ken Vanden Broek | 1,079 | 2.27 | +0.78 | $16,322 | |||
| Marijuana | Dustin Sobie | 553 | 1.16 | – | ||||
| Total valid votes | 47,532 | 100.00 | ||||||
| Total rejected ballots | 135 | 0.28 | -0.07 | |||||
| Turnout | 47,667 | 61.74 | -0.19 | |||||
Note: Conservative vote is compared to the total of Progressive Conservative and Canadian Alliance vote in 2000.
| hide2000 Canadian federal election | ||||||||
|---|---|---|---|---|---|---|---|---|
| Party | Candidate | Votes | % | ±% | Expenditures | |||
| Alliance | Rick Casson | 30,380 | 66.02 | +10.49 | $61,765 | |||
| Liberal | Vaughan Hartigan | 7,797 | 16.94 | -2.24 | $10,339 | |||
| Progressive Conservative | Kimberly Denise Budd | 4,062 | 8.82 | -9.26 | $3,506 | |||
| New Democratic | Garth Hardy | 2,648 | 5.75 | +0.38 | $6,135 | |||
| Green | Don C. Ferguson | 864 | 1.87 | – | $1,324 | |||
| Canadian Action | Dan Lamden | 264 | 0.57 | -0.22 | $739 | |||
| Total valid votes | 46,015 | 100.00 | ||||||
| Total rejected ballots | 163 | 0.35 | +0.16 | |||||
| Turnout | 46,178 | 61.93 | +2.26 | |||||
Note: Canadian Alliance vote is compared to the Reform vote in 1997.
| hide1997 Canadian federal election | ||||||||
|---|---|---|---|---|---|---|---|---|
| Party | Candidate | Votes | % | ±% | Expenditures | |||
| Reform | Rick Casson | 22,828 | 55.53 | +2.97 | $63,487 | |||
| Liberal | John McGee | 7,887 | 19.18 | -6.29 | $47,656 | |||
| Progressive Conservative | Greg Weadick | 7,436 | 18.08 | +2.86 | $40,649 | |||
| New Democratic | Victor Lough | 2,211 | 5.37 | +2.56 | $3,877 | |||
| Christian Heritage | Nellie Slingerland | 418 | 1.01 | – | $1,944 | |||
| Canadian Action | J-C Lessard | 326 | 0.79 | – | $9,690 | |||
| Total valid votes | 41,106 | 100.00 | ||||||
| Total rejected ballots | 79 | 0.19 | ||||||
| Turnout | 41,185 | 59.67 | ||||||
| hide1993 Canadian federal election | ||||||||
|---|---|---|---|---|---|---|---|---|
| Party | Candidate | Votes | % | ±% | ||||
| Reform | Ray Speaker | 24,565 | 52.56 | +45.76 | ||||
| Liberal | John William McGee | 11,905 | 25.47 | +6.89 | ||||
| Progressive Conservative | Dean Lien | 7,113 | 15.22 | -43.19 | ||||
| National | Carson Tannant | 1,592 | 3.41 | |||||
| New Democratic | Doug Petherbridge | 1,313 | 2.81 | -6.99 | ||||
| Natural Law | Cliff Kinzel | 247 | 0.53 | |||||
| Total valid votes | 46,735 | 100.00 | ||||||
| hide1988 Canadian federal election | ||||||||
|---|---|---|---|---|---|---|---|---|
| Party | Candidate | Votes | % | ±% | ||||
| Progressive Conservative | Blaine Thacker | 26,750 | 58.41 | -8.97 | ||||
| Liberal | Robert Grbavac | 8,513 | 18.59 | +7.15 | ||||
| New Democratic | Don Ferguson | 4,489 | 9.80 | -4.88 | ||||
| Reform | Phil Connolly | 3,116 | 6.80 | |||||
| Christian Heritage | Charles Cavilla | 2,932 | 6.40 | |||||
| Total valid votes | 45,800 | 100.00 | ||||||
Lethbridge—Foothills, 1979–1988[]
| hide1984 Canadian federal election | ||||||||
|---|---|---|---|---|---|---|---|---|
| Party | Candidate | Votes | % | ±% | ||||
| Progressive Conservative | Blaine Thacker | 31,316 | 67.38 | -1.22 | ||||
| New Democratic | Connie Credico | 6,822 | 14.68 | +4.69 | ||||
| Liberal | Shaun Ward | 5,315 | 11.44 | -5.85 | ||||
| Independent | Steven V. Pinchak | 2,145 | 4.61 | |||||
| Social Credit | Rod W. Start | 456 | 0.98 | -1.61 | ||||
| Confederation of Regions | Cyril Baranosky | 426 | 0.92 | |||||
| Total valid votes | 46,480 | 100.00 | ||||||
| hide1980 Canadian federal election | ||||||||
|---|---|---|---|---|---|---|---|---|
| Party | Candidate | Votes | % | ±% | ||||
| Progressive Conservative | Blaine Thacker | 27,307 | 68.60 | -1.30 | ||||
| Liberal | Shaun G. Ward | 6,882 | 17.29 | -0.37 | ||||
| New Democratic | Dave Porteous | 3,974 | 9.98 | +1.04 | ||||
| Social Credit | D. Willard Paxman | 1,031 | 2.59 | -0.49 | ||||
| Independent | Peter Jones | 482 | 1.21 | |||||
| Communist | David Wallis | 132 | 0.33 | -0.09 | ||||
| Total valid votes | 39,808 | 100.00 | ||||||
| hide1979 Canadian federal election | ||||||||
|---|---|---|---|---|---|---|---|---|
| Party | Candidate | Votes | % | ±% | ||||
| Progressive Conservative | Blaine Thacker | 29,069 | 69.89 | +6.37 | ||||
| Liberal | Jim Gladstone | 7,345 | 17.66 | -4.15 | ||||
| New Democratic | Roger Rickwood | 3,720 | 8.94 | -1.32 | ||||
| Social Credit | Wagner Saende | 1,282 | 3.08 | -1.32 | ||||
| Communist | David Wallis | 174 | 0.42 | |||||
| Total valid votes | 41,590 | 100.00 | ||||||
Lethbridge, 1917–1979[]
| hide1974 Canadian federal election | ||||||||
|---|---|---|---|---|---|---|---|---|
| Party | Candidate | Votes | % | ±% | ||||
| Progressive Conservative | Kenneth Earl Hurlburt | 20,602 | 63.52 | +5.72 | ||||
| Liberal | Sven Ericksen | 7,075 | 21.81 | -1.50 | ||||
| New Democratic | Bessie Annand | 3,329 | 10.26 | -1.82 | ||||
| Social Credit | Vern Young | 1,428 | 4.40 | -2.40 | ||||
| Total valid votes | 32,434 | 100.00 | ||||||
| hide1972 Canadian federal election | ||||||||
|---|---|---|---|---|---|---|---|---|
| Party | Candidate | Votes | % | ±% | ||||
| Progressive Conservative | Kenneth Earl Hurlburt | 18,845 | 57.80 | +12.85 | ||||
| Liberal | Andy Russell | 7,601 | 23.31 | -7.63 | ||||
| New Democratic | Hal Hoffman | 3,941 | 12.09 | +2.86 | ||||
| Social Credit | Keith L. Hancock | 2,219 | 6.81 | -8.08 | ||||
| Total valid votes | 32,606 | 100.00 | ||||||
| hide1968 Canadian federal election | ||||||||
|---|---|---|---|---|---|---|---|---|
| Party | Candidate | Votes | % | ±% | ||||
| Progressive Conservative | Deane Gundlock | 11,901 | 44.95 | +3.92 | ||||
| Liberal | John I. Boras | 8,193 | 30.94 | +11.21 | ||||
| Social Credit | Ernest R. Patterson | 3,941 | 14.88 | -17.59 | ||||
| New Democratic | George Edward Orchard | 2,442 | 9.22 | +2.46 | ||||
| Total valid votes | 26,477 | 100.00 | ||||||
| hide1965 Canadian federal election | ||||||||
|---|---|---|---|---|---|---|---|---|
| Party | Candidate | Votes | % | ±% | ||||
| Progressive Conservative | Deane Gundlock | 10,147 | 41.02 | -2.28 | ||||
| Social Credit | Wallace C. Strom | 8,032 | 32.47 | -2.51 | ||||
| Liberal | Frank Sherring | 4,882 | 19.74 | +3.57 | ||||
| New Democratic | Frances Joyce Grantham | 1,673 | 6.76 | +1.95 | ||||
| Total valid votes | 24,734 | 100.00 | ||||||
| hide1963 Canadian federal election | ||||||||
|---|---|---|---|---|---|---|---|---|
| Party | Candidate | Votes | % | ±% | ||||
| Progressive Conservative | Deane Gundlock | 11,475 | 43.30 | -0.77 | ||||
| Social Credit | 9,271 | 34.98 | +0.49 | |||||
| Liberal | Martin Hoyt | 4,284 | 16.17 | +1.90 | ||||
| New Democratic | Peter Uganecz | 1,277 | 4.82 | -2.35 | ||||
| Independent | John Arthur Spencer | 193 | 0.73 | |||||
| Total valid votes | 26,500 | 100.00 | ||||||
| hide1962 Canadian federal election | ||||||||
|---|---|---|---|---|---|---|---|---|
| Party | Candidate | Votes | % | ±% | ||||
| Progressive Conservative | Deane Gundlock | 11,105 | 44.07 | -14.26 | ||||
| Social Credit | Steve Kapcsos | 8,693 | 34.50 | 6.25 | ||||
| Liberal | Mark Reed Stringam | 3,595 | 14.27 | +2.42 | ||||
| New Democratic | Milo Douglas | 1,806 | 7.17 | |||||
| Total valid votes | 25,199 | 100.00 | ||||||
| hide1958 Canadian federal election | ||||||||
|---|---|---|---|---|---|---|---|---|
| Party | Candidate | Votes | % | ±% | ||||
| Progressive Conservative | Deane Gundlock | 13,364 | 58.33 | +43.55 | ||||
| Social Credit | John Horne Blackmore | 6,471 | 28.25 | -24.77 | ||||
| Liberal | Clarence G. Yanosik | 2,714 | 11.85 | -20.36 | ||||
| Independent SC | Ervin D. Olsen | 361 | 1.58 | |||||
| Total valid votes | 22,910 | 100.00 | ||||||
| hide1957 Canadian federal election | ||||||||
|---|---|---|---|---|---|---|---|---|
| Party | Candidate | Votes | % | ±% | ||||
| Social Credit | John Horne Blackmore | 10,910 | 53.02 | -3.61 | ||||
| Liberal | Asael E. Palmer | 6,627 | 32.20 | -0.80 | ||||
| Progressive Conservative | John Arthur Spencer | 3,041 | 14.78 | +4.41 | ||||
| Total valid votes | 20,578 | 100.00 | ||||||
| hide1953 Canadian federal election | ||||||||
|---|---|---|---|---|---|---|---|---|
| Party | Candidate | Votes | % | ±% | ||||
| Social Credit | John Horne Blackmore | 9,737 | 56.62 | +9.64 | ||||
| Liberal | Ernest Roderick McFarland | 5,676 | 33.01 | +2.53 | ||||
| Progressive Conservative | James Erle Carr | 1,783 | 10.37 | -2.65 | ||||
| Total valid votes | 17,196 | 100.00 | ||||||
| hide1949 Canadian federal election | ||||||||
|---|---|---|---|---|---|---|---|---|
| Party | Candidate | Votes | % | ±% | ||||
| Social Credit | John Horne Blackmore | 8,880 | 46.98 | +3.46 | ||||
| Liberal | Louis Sherman Turcotte | 5,760 | 30.47 | +7.54 | ||||
| Progressive Conservative | John Arthur Jardine | 2,460 | 13.02 | -4.90 | ||||
| Co-operative Commonwealth | William Wesley Scott | 1,801 | 9.53 | -3.47 | ||||
| Total valid votes | 18,901 | 100.00 | ||||||
| hide1945 Canadian federal election | ||||||||
|---|---|---|---|---|---|---|---|---|
| Party | Candidate | Votes | % | ±% | ||||
| Social Credit | John Horne Blackmore | 7,250 | 43.52 | +2.49 | ||||
| Liberal | Louis Sherman Turcotte | 3,820 | 22.93 | -12.79 | ||||
| Progressive Conservative | Philip Baker | 2,985 | 17.92 | -5.33 | ||||
| Co-operative Commonwealth | William Wesley Scott | 2,165 | 13.00 | |||||
| Labor–Progressive | William Henry Childress | 439 | 2.64 | |||||
| Total valid votes | 16,659 | 100.00 | ||||||
Note: Progressive Conservative vote is compared to "National Government" vote in 1940 election. Social Credit vote is compared to New Democracy vote in 1940 election.
| hide1940 Canadian federal election | ||||||||
|---|---|---|---|---|---|---|---|---|
| Party | Candidate | Votes | % | ±% | ||||
| New Democracy | John Horne Blackmore | 6,362 | 41.03 | -9.97 | ||||
| Liberal | Lynden Eldon Fairbairn | 5,538 | 35.72 | +19.21 | ||||
| National Government | John Smith Stewart | 3,605 | 23.25 | -0.15 | ||||
| Total valid votes | 15,505 | 100.00 | ||||||
Note: "National Government" vote is compared to Conservative vote in 1935 election. New Democracy vote is compared to Social Credit vote in 1935 election.
| hide1935 Canadian federal election | ||||||||
|---|---|---|---|---|---|---|---|---|
| Party | Candidate | Votes | % | ±% | ||||
| Social Credit | John Horne Blackmore | 6,516 | 51.00 | |||||
| Conservative | John Smith Stewart | 2,990 | 23.40 | -15.43 | ||||
| Liberal | Lynden Eldon Fairbairn | 2,109 | 16.51 | -13.67 | ||||
| Co-operative Commonwealth | John Albert Johansen | 737 | 5.77 | |||||
| Reconstruction | A. Gladstone Virtue | 425 | 3.33 | |||||
| Total valid votes | 12,777 | 100.00 | ||||||
| hide1930 Canadian federal election | ||||||||
|---|---|---|---|---|---|---|---|---|
| Party | Candidate | Votes | % | ±% | ||||
| Conservative | John Smith Stewart | 4,863 | 38.84 | -1.23 | ||||
| Progressive | Thomas Owen King | 3,880 | 30.99 | -28.95 | ||||
| Liberal | Arthur George Baalim | 3,779 | 30.18 | |||||
| Total valid votes | 12,522 | 100.00 | ||||||
Note: Progressive vote is compared to UFA vote in 1926 election.
| hide1926 Canadian federal election | ||||||||
|---|---|---|---|---|---|---|---|---|
| Party | Candidate | Votes | % | ±% | ||||
| United Farmers of Alberta | Lincoln Henry Jelliff | 5,138 | 59.93 | +6.24 | ||||
| Conservative | Andrew Bryden Hogg | 3,435 | 40.07 | -6.24 | ||||
| Total valid votes | 8,573 | 100.00 | ||||||
Note: UFA vote is compared to Progressive vote in 1925 election.
| hide1925 Canadian federal election | ||||||||
|---|---|---|---|---|---|---|---|---|
| Party | Candidate | Votes | % | ±% | ||||
| Progressive | Lincoln Henry Jelliff | 5,399 | 53.69 | +4.45 | ||||
| Conservative | John Smith Stewart | 4,656 | 46.31 | +33.12 | ||||
| Total valid votes | 10,055 | 100.00 | ||||||
| hide1921 Canadian federal election | ||||||||
|---|---|---|---|---|---|---|---|---|
| Party | Candidate | Votes | % | ±% | ||||
| Progressive | Lincoln Henry Jelliff | 4,961 | 49.25 | |||||
| Labour | Martin Francis Finn | 3,170 | 31.47 | |||||
| Conservative | William Sargent Ball | 1,328 | 13.18 | -55.05 | ||||
| Liberal | James Edward Lovering | 615 | 6.10 | |||||
| Total valid votes | 10,074 | 100.00 | ||||||
| hide1917 Canadian federal election | ||||||||
|---|---|---|---|---|---|---|---|---|
| Party | Candidate | Votes | % | |||||
| Government (Unionist) | William Ashbury Buchanan | 5,302 | 68.24 | |||||
| Opposition-Labour | Lambert "L" Pack | 2,468 | 31.76 | |||||
| Total valid votes | 7,770 | 100.00 | ||||||
See also[]
- List of Canadian federal electoral districts
- Alberta federal electoral districts
- Past Canadian electoral districts
References[]
- "(Code 48019) Census Profile". 2011 census. Statistics Canada. 2012. Retrieved 2011-03-06.
Notes[]
- ^ Statistics Canada: 2012
- ^ Statistics Canada: 2012
- ^ "List of confirmed candidates – September 20, 2021 Federal Election". Elections Canada. Retrieved 2 September 2021.
- ^ "List of confirmed candidates". Elections Canada. Retrieved 4 October 2019.
- ^ "Election Night Results". Elections Canada. Retrieved November 6, 2019.
- ^ "October 19, 2015 Election Results — Lethbridge (Validated results)". Elections Canada. 23 October 2015. Retrieved 4 November 2015.
- ^ Elections Canada – Preliminary Election Expenses Limits for Candidates Archived 2015-08-15 at the Wayback Machine
- ^ Pundits' Guide to Canadian Elections
External links[]
- Riding history for Lethbridge (1914-1977) from the Library of Parliament
- Riding history for Lethbridge–Foothills (1977-1987) from the Library of Parliament
- Riding history for Lethbridge (1987-present) from the Library of Parliament
- Expenditures - 2008
- Expenditures - 2004
- Expenditures - 2000
- Expenditures - 1997
- Elections Canada
- Website of the Parliament of Canada
| show Federal ridings in rural Alberta |
|---|
- Alberta federal electoral districts
- Politics of Lethbridge