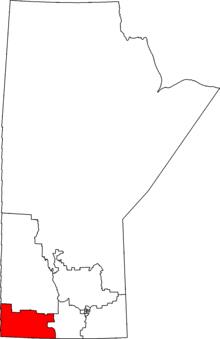
Brandon—Souris electoral district Brandon—Souris in relation to other Manitoba federal electoral districts as of the 2013 Representation Order.
Legislature House of Commons MP Larry Maguire Conservative District created 1952 First contested 1953 Last contested 2019 District webpage profile , map Population (2016 )[1] 88,170 Electors (2015)59,459 Area (km²)[1] 17,842.36 Pop. density (per km²) 4.9 Census division(s) Division No. 4 , Division No. 5 , Division No. 6 , Division No. 7 ,Census subdivision(s) Albert , Argyle , Arthur , Boissevain , Brandon , Brenda , Cameron , Canupawakpa Dakota First Nation , Carberry , Cartwright , Cornwallis , Daly , Deloraine , Edward , Elkhorn , Elton , Glenboro , Glenwood , Hartney , Killarney-Turtle Mountain , Melita , Morton , North Cypress , Oak Lake , Oakland , Pipestone , Rivers , Riverside , Roblin , Sifton , Sioux Valley Dakota Nation , Souris , South Cypress , Strathcona , Virden , Wallace , Waskada , Wawanesa , Whitehead , Whitewater , Winchester , Woodworth
Brandon—Souris is a federal electoral district in Manitoba , Canada, that has been represented in the House of Commons of Canada since 1953.
Demographics [ ] According to the Canada 2011 Census Ethnic groups: 83.4% White, 9.8% Aboriginal, 2.3% Latin American, 1.7% ChineseLanguages: 85.8% English, 4.3% German, 2.3% Spanish, 1.7% French, 1.4% ChineseReligions: 67.4% Christian (23.3% United Church, 16.6% Catholic, 12.5% "Other Christian", 6.1% Anglican, 2.1% Presbyterian, 1.8% Lutheran, 1.6% Baptist), 30.5% None. Median income: $30,394 (2010)[2] Average income: $36,827 (2010) [2]
Geography [ ] The district is in the southwestern corner of the Province of Manitoba. It is bordered by the electoral district of Dauphin—Swan River—Neepawa to the north, the electoral district of Portage—Lisgar to the east, the Canada–United States border to the south, and the Province of Saskatchewan to the west.
It includes the communities of Brandon , Cornwallis , Virden , Killarney , Souris and North Cypress .
History [ ] The electoral district was created in 1952 from the former districts of Brandon and Souris . It has been held by a centre-right party for all but one term of its existence. This tradition was broken in 1993 when massive vote-splitting between the Progressive Conservatives and Reform allowed the Liberals to sneak up the middle and take the riding. However, the seat reverted to form in 1997 when the PCs reclaimed it. The PCs and their successors, the modern Conservatives , have held the seat ever since. While Brandon has some Liberal and NDP support, it is not enough to overcome the conservative bent in the more rural areas of the riding.
This riding lost territory to Dauphin—Swan River—Neepawa and gained territory from Portage—Lisgar during the 2012 electoral redistribution .
Members of Parliament [ ] This riding has elected the following Members of Parliament :
Election results [ ] Graph of election results in Brandon—Souris (minor parties that never got 2% of the vote or didn't run consistently are omitted)
hide 2019 Canadian federal election
Party
Candidate
Votes
%
Expenditures
Conservative Larry Maguire 26,148
63.46
+13.19
$76,622.34
New Democratic Ashley Duguay
5,805
14.09
+7.82
$1,382.10
Liberal Terry Hayward
4,972
12.07
-25.24
$17,298.99
Green Bill Tiessen
2,984
7.24
+1.07
$2,661.43
People's Robin Lussier
691
1.68
–
none listed
Christian Heritage Rebecca Hein
280
0.68
–
none listed
Independent Vanessa Hamilton
219
0.53
–
$0.00
Independent Robert Eastcott
107
0.26
–
$0.00
Total valid votes/Expense limit
41,206 99.46
Total rejected ballots
224 0.54
Turnout
41,430 65.35
Eligible voters
63,401
Conservative hold
Swing
+2.70
Source: Elections Canada [4] [5]
hide 2015 Canadian federal election
Party
Candidate
Votes
%
Expenditures
Conservative Larry Maguire 20,666
50.27
-13.55
$199,886.51
Liberal Jodi Wyman
15,338
37.31
+31.57
$49,711.29
New Democratic Melissa Joy Wastasecoot
2,576
6.27
-18.37
$5,845.76
Green David Neufeld
2,526
6.15
-0.40
$15,550.33
Total valid votes/Expense limit
41,106 100.00 $212,589.96
Total rejected ballots
150 0.36 –
Turnout
41,256 68.27 –
Eligible voters
60,427
Conservative hold
Swing
-22.56
Source: Elections Canada [6] [7]
hide November 25, 2013
Party
Candidate
Votes
%
Expenditures
Conservative Larry Maguire 12,205
44.16
−19.57
$ 89,503.81
Liberal Rolf Dinsdale
11,816
42.75
+37.39
76,203.47
New Democratic Cory Szczepanski
1,996
7.22
−17.96
22,981.64
Green David Neufeld
1,349
4.88
−0.85
7,502.04
Libertarian Frank Godon
271
0.98
–
2,404.04
Total valid votes/Expense limit
27,637 100.0 – $ 94,534.60
Total rejected ballots
106 0.38 −0.01
Turnout
27,743 44.81 −12.83
Eligible voters
61,910
Conservative hold
Swing
−28.48
By-election due to the resignation of Merv Tweed .
hide 2011 Canadian federal election
Party
Candidate
Votes
%
Expenditures
Conservative Merv Tweed 22,386
63.73
+6.67
$42,483
New Democratic Jean Luc Bouché
8,845
25.18
+7.52
$11,846
Green Dave Barnes
2,012
5.73
-10.06
$10,620
Liberal Wes Penner
1,882
5.36
-2.92
$15,300
Total valid votes/Expense limit
35,125 100.0 $ 88,412.19
Total rejected ballots
139 0.39 +0.07
Turnout
35,264 57.54 +1.58
Eligible voters
61,289 – –
Conservative hold
Swing
-0.42
hide 2008 Canadian federal election
Party
Candidate
Votes
%
Expenditures
Conservative Merv Tweed 19,558
57.06
+2.63
$40,902
New Democratic Jean Luc Bouché
6,055
17.67
-2.57
$16,762
Green Dave Barnes
5,410
15.78
+11.20
$39,823
Liberal Martha Jo Willard
2,836
8.27
-9.73
$12,178
Christian Heritage Jerome Dondo
292
0.85
+0.07
$728
Communist Lisa Gallagher
124
0.36
+0.04
$622
Total valid votes/Expense limit
34,275 100.0 $ 85,829
Total rejected ballots
112 0.33 -0.04
Turnout
34,387 55.96 -4.36
Eligible voters
61,449 – –
Conservative hold
Swing
+2.60
hide 2006 Canadian federal election
Party
Candidate
Votes
%
Expenditures
Conservative (x)Merv Tweed
20,247
54.43
+2.70
$51,606
New Democratic Bob Senff
7,528
20.24
+1.09
$7,255
Liberal Murray Downing
6,696
18.00
-6.21
$20,605
Green Brad Bird
1,707
4.59
+1.00
$15.50
Independent Mike Volek
611
1.64
–
$4,238
Christian Heritage Colin Atkins
290
0.78
-0.22
$1,380
Communist Lisa Gallagher
120
0.32
-0.01
$295
Total valid votes/Expense limit
37,119 100.0 –
Total rejected ballots
138 0.37 -0.18
Turnout
37,337 60.32 +4.07
Eligible voters
61,903 – –
Conservative hold
Swing
+0.81
hide 2004 Canadian federal election
Party
Candidate
Votes
%
Expenditures
Conservative Merv Tweed 18,209
51.72
-17.64
$54,647
Liberal Murray Downing
8,522
24.21
+6.83
$26,903
New Democratic Mike Abbey
6,740
19.15
+7.05
$13,512
Green David Kattenburg
1,264
3.59
–
$1,322
Christian Heritage Colin Atkins
351
1.00
$683
Communist Lisa Gallagher
118
0.34
$665
Total valid votes
35,204 100.0 –
Total rejected ballots
194 0.55
Turnout
35,398 56.24 -8.96
Eligible voters
62,938 – –
Conservative notional hold
Swing
+12.23
hide 2000 Canadian federal election
Party
Candidate
Votes
%
Expenditures
Progressive Conservative Rick Borotsik 13,707
37.41
+1.82
$43,992.66
Alliance Gary Nestibo
11,678
31.87
−0.13
$59,234.19
Liberal Dick Scott
6,544
17.86
+0.13
$42,860.78
New Democratic 4,518
12.33
−1.09
$13,475.28
Communist Lisa Gallagher
102
0.28
$383.70
Christian Heritage Colin Atkins
94
0.26
−0.36
$1,000.00
Total valid votes
36,643 100.00
Total rejected ballots
116
Turnout
36,759 67.04 +0.16
Electors on the lists
54,829
Sources: Official Results, Elections Canada and Financial Returns, Elections Canada .
^ Conservative change is from combined Canadian Alliance and Progressive Conservative. Percent change based on redistributed results.
hide 1997 Canadian federal election
Party
Candidate
Votes
%
Expenditures
Progressive Conservative Rick Borotsik 13,216
35.59
+13.18
$51,629
Reform Ed Agnew
11,883
32.00
+1.63
$52,341
Liberal Glen McKinnon 6,583
17.73
-15.27
$33,249
New Democratic Jennifer Howard 4,983
13.42
+1.56
$12,213
Independent Geoff Gorf Borden
244
0.66
$19
Christian Heritage Colin Atkins
229
0.62
-0.3
$34
Total valid votes
37,138 100.00
Total rejected ballots
135
Turnout
37,273 66.88
Electors on the lists
55,735
Sources: Official Results, Elections Canada and Financial Returns, Elections Canada .
hide 1993 Canadian federal election
Party
Candidate
Votes
%
Expenditures
Liberal Glen McKinnon 12,130
33.00
+2.3
$34,664
Reform Edward Agnew
11,163
30.37
+26.17
$32,210
Progressive Conservative Larry Maguire 8,236
22.41
-24.39
$52,740
New Democratic Ross C. Martin
4,359
11.86
-1.9
$13,827
Christian Heritage Abe Neufeld
339
0.92
-2.68
$2,184
National Eldon Obach
336
0.91
+0.91
$5,524
Natural Law Robert Roberts
112
0.30
$0
Canada Party George H. Armstrong
82
0.22
$0
Total valid votes
36,757
100.00
Total rejected ballots
128
Turnout
36,885
68.74
Electors on lists
53,659
Source: Thirty-fifth General Election, 1993: Official Voting Results, Published by the Chief Electoral Officer of Canada. Financial figures taken from official contributions and expenses provided by Elections Canada .
hide
Party
Candidate
Votes
%
On Mr. Dinsdale's death, 20 November 1982
Progressive Conservative Lee Clark 19,330
62.2
+15.3
New Democratic Bill Moore
6,381
20.5
-4.2
Liberal Joe Mullally
5,369
17.3
-10.9
Total valid votes
31,080 100.0
See also [ ] References [ ] Notes [ ] Coordinates : 49°43′26″N 100°01′12″W / 49.724°N 100.020°W / 49.724; -100.020