Projections of population growth
Population projections are attempts to show how the human population living today will change in the future.[1] These projections are an important input to forecasts of the population's impact on this planet and humanity's future well-being.[2] Models of population growth take trends in human development, and apply projections into the future.[3] These models use trend-based-assumptions about how populations will respond to economic, social and technological forces to understand how they will affect fertility and mortality, and thus population growth.[3]
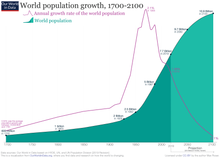
The 2019 forecast from the United Nation's Population Division (made before the COVID-19 pandemic) shows that world population growth peaked at 2.1% per year in 1968, has since dropped to 1.1%, and could drop even further to 0.1% by 2100, a growth rate not seen since pre-industrial revolution days.[4] Based on this, the UN Population Division expects the world population, which is at 7.8 billion as of 2020, to level out around 2100 at 10.9 billion (the median line),[5][6] assuming a continuing decrease in the global average fertility rate from 2.5 births per woman during the 2015–2020 period to 1.9 in 2095–2100, according to the medium-variant projection.[7] About two thirds of the predicted growth in population between 2020 and 2050 will take place in Africa.[8] It is projected that 50% of births in the 5-year period 2095-2100 will be in Africa.[9]

Because of population momentum the global population could continue to grow, although at a steadily slower rate, for the remainder of this century, but the main driver of long-term future population growth will be the evolution of the global average fertility rate.[7] However, estimates outside of the United Nations have put forward alternative models based on additional downward pressure on fertility (such as successful implementation of education and family planning goals in the Sustainable Development Goals) -- which could result in peak population mid-21st century rather than later.[3][10]
IHME and IIASA project lower fertility in Sub-Saharan Africa in 2100 than the UN. By 2100, the UN projects the population in SSA will reach 3.8 billion, IHME projects 3.1 billion, and IIASA projects 2.6 billion. IHME and IIASA incorporate women’s educational attainment in their models of fertility, and in the case of IHME, also consider met need for family planning. [1]
Table of UN projections[]
The United Nation's Population Division publishes high estimates by born people is increasing in population, about born in population about 16 & 34 billion people, in 2124 & 2141, in the World Population. (by gender) & density.
| Year | Total population |
|---|---|
| 2021 | 7,874,965,732 |
| 2022 | 7,953,952,577 |
| 2023 | 8,031,800,338 |
| 2024 | 8,108,605,255 |
| 2025 | 8,184,437,453 |
| 2026 | 8,259,276,651 |
| 2027 | 8,333,078,318 |
| 2028 | 8,405,863,301 |
| 2029 | 8,477,660,723 |
| 2030 | 8,548,487,371 |
| 2031 | 8,618,349,454 |
| 2032 | 8,687,227,873 |
| 2033 | 8,755,083,512 |
| 2034 | 8,821,862,705 |
| 2035 | 8,887,524,229 |
| 2036 | 8,952,048,885 |
| 2037 | 9,015,437,616 |
| 2038 | 9,077,693,645 |
| 2039 | 9,138,828,562 |
| 2040 | 9,198,847,382 |
| 2041 | 9,257,745,483 |
| 2042 | 9,315,508,153 |
| 2043 | 9,372,118,247 |
| 2044 | 9,427,555,382 |
| 2045 | 9,481,803,272 |
| 2046 | 9,534,854,673 |
| 2047 | 9,586,707,749 |
| 2048 | 9,637,357,320 |
| 2049 | 9,686,800,146 |
| 2050 | 9,735,033,900 |
| 2051 | 9,782,061,758 |
| 2052 | 9,827,885,441 |
| 2053 | 9,872,501,562 |
| 2054 | 9,915,905,251 |
| 2055 | 9,958,098,746 |
| 2056 | 9,999,085,167 |
| 2057 | 10,038,881,262 |
| 2058 | 10,077,518,080 |
| 2059 | 10,115,036,360 |
| 2060 | 10,151,469,683 |
| 2061 | 10,186,837,209 |
| 2062 | 10,221,149,040 |
| 2063 | 10,254,419,004 |
| 2064 | 10,286,658,354 |
| 2065 | 10,317,879,315 |
| 2066 | 10,348,098,079 |
| 2067 | 10,377,330,830 |
| 2068 | 10,405,590,532 |
| 2069 | 10,432,889,136 |
| 2070 | 10,459,239,501 |
| 2071 | 10,484,654,858 |
| 2072 | 10,509,150,402 |
| 2073 | 10,532,742,861 |
| 2074 | 10,555,450,003 |
| 2075 | 10,577,288,195 |
| 2076 | 10,598,274,172 |
| 2077 | 10,618,420,909 |
| 2078 | 10,637,736,819 |
| 2079 | 10,656,228,233 |
| 2080 | 10,673,904,454 |
| 2081 | 10,690,773,335 |
| 2082 | 10,706,852,426 |
| 2083 | 10,722,171,375 |
| 2084 | 10,736,765,444 |
| 2085 | 10,750,662,353 |
| 2086 | 10,763,874,023 |
| 2087 | 10,776,402,019 |
| 2088 | 10,788,248,948 |
| 2089 | 10,799,413,366 |
| 2090 | 10,809,892,303 |
| 2091 | 10,819,682,643 |
| 2092 | 10,828,780,959 |
| 2093 | 10,837,182,077 |
| 2094 | 10,844,878,798 |
| 2095 | 10,851,860,145 |
| 2096 | 10,858,111,587 |
| 2097 | 10,863,614,776 |
| 2098 | 10,868,347,636 |
| 2099 | 10,872,284,134 |
| 2100 | 10,875,393,719 |
History of population projections[]
Walter Greiling projected in the 1950s that world population would reach a peak of about nine billion, in the 21st century, and then stop growing after a readjustment of the Third World and a sanitation of the tropics.[12]
Estimates published in the 2000s tended to predict that the population of Earth would stop increasing around 2070.[13] In a 2004 long-term prospective report, the United Nations Population Division projected the world population would peak at 7.85 billion in 2075. After reaching this maximum, it would decline slightly and then resume a slow increase, reaching a level of 5.11 billion by 2300, about the same as the projected 2050 figure.[14]
This prediction was revised in the 2010s, to the effect that no maximum will likely be reached in the 21st century.[15] The main reason for the revision was that the ongoing rapid population growth in Africa had been underestimated. A 2014 paper by demographers from several universities and the United Nations Population Division forecast that the world's population would reach about 10.9 billion in 2100 and continue growing thereafter.[16] In 2017 the UN predicted a decline of global population growth rate from +1.0% in 2020 to +0.5% in 2050 and to +0.1% in 2100.[17]
Jørgen Randers, one of the authors of the seminal 1972 long-term simulations in The Limits to Growth, offered an alternative scenario in a 2012 book, arguing that traditional projections insufficiently take into account the downward impact of global urbanization on fertility. Randers' "most likely scenario" predicts a peak in the world population in the early 2040s at about 8.1 billion people, followed by decline.[18]
Drivers of population change[]
The population of a country or area grows or declines through the interaction of three demographic drivers: fertility, mortality, and migration.[2]
Fertility[]
Fertility is expressed as the total fertility rate (TFR), a measure of the number of children on average that a woman will bear in her lifetime. With longevity trending towards uniform and stable values worldwide, the main driver of future population growth will be the evolution of the fertility rate.[7]
Where fertility is high, demographers generally assume that fertility will decline and eventually stabilize at about two children per woman.[2]
During the period 2015–2020, the average world fertility rate was 2.5 children per woman,[7] about half the level in 1950-1955 (5 children per woman). In the medium variant, global fertility is projected to decline further to 2.2 in 2045-2050 and to 1.9 in 2095–2100.[7]
Mortality[]
If the mortality rate is relatively high and the resulting life expectancy is therefore relatively low, changes in mortality can have a material impact on population growth. Where the mortality rate is low and life expectancy has therefore risen, a change in mortality will have much less an effect.[2]
Because child mortality has declined substantially over the last several decades,[2] Global life expectancy at birth, which is estimated to have risen from 47 years in 1950–1955 to 67 years in 2000–2005,[19] is expected to keep rising to reach 77 years in 2045–2050.[20] In the More Developed regions, the projected increase is from 79 years today[19] to 83 years by mid-century.[20] Among the Least Developed countries, where life expectancy today is just under 65 years,[19] it is expected to be 71 years in 2045–2050.[20]
The population of 31 countries or areas, including Ukraine, Romania, Japan and most of the successor states of the Soviet Union, is expected to be lower in 2050 than in 2005.
Migration[]
Migration can have a significant effect on population change. Global South-South migration accounts for 38% of total migration, and Global South-North for 34%.[21] For example, the United Nations reports that during the period 2010–2020, fourteen countries will have seen a net inflow of more than one million migrants, while ten countries will have seen a net outflow of similar proportions. The largest migratory outflows have been in response to demand for workers in other countries (Bangladesh, Nepal and the Philippines) or to insecurity in the home country (Myanmar, Syria and Venezuela). Belarus, Estonia, Germany, Hungary, Italy, Japan, the Russian Federation, Serbia and Ukraine have experienced a net inflow of migrants over the decade, helping to offset population losses caused by a negative natural increase (births minus deaths).[22]
World population[]

Asia Africa Europe Latin America Northern America Oceania
2050[]
The median scenario of the UN 2019 World Population Prospects[23] predicts the following populations per region in 2050 (compared to population in 2000), in billions:
| 2000 | 2050 | growth | %/yr | |
| Asia | 3.74 | 5.29 | +41% | +0.7% |
| Africa | 0.81 | 2.49 | +207% | +2.3% |
| Europe | 0.73 | 0.71 | −3% | −0.1% |
| South/Central America +Caribbean |
0.52 | 0.76 | +46% | +0.8% |
| North America | 0.31 | 0.43 | +39% | +0.7% |
| Oceania | 0.03 | 0.06 | +100% | +1.4% |
| World | 6.14 | 9.74 | +60% | +0.9% |
After 2050[]
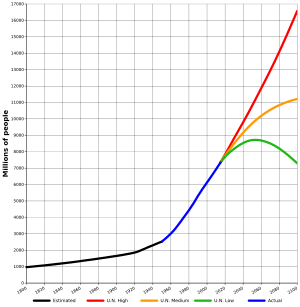
Projections of population reaching more than one generation into the future are highly speculative: Thus, the United Nations Department of Economic and Social Affairs report of 2004 projected the world population to peak at 9.22 billion in 2075 and then stabilise at a value close to 9 billion;[24] By contrast, a 2014 projection by the United Nations Population Division predicted a population close to 11 billion by 2100 without any declining trend in the foreseeable future.[16]
United Nations projections[]
The UN Population Division report of 2019 projects world population to continue growing, although at a steadily decreasing rate, and to reach 10.9 billion in 2100 with a growth rate at that time of close to zero.[23]
This projected growth of population, like all others, depends on assumptions about vital rates. For example, the UN Population Division assumes that Total fertility rate (TFR) will continue to decline, at varying paces depending on circumstances in individual regions, to a below-replacement level of 1.9 by 2100. Between now (2020) and 2100, regions with TFR currently below this rate, e.g. Europe, will see TFR rise. Regions with TFR above this rate, will see TFR continue to decline.[7]

Other projections[]
- A 2020 study published by The Lancet from researchers funded by the Global Burden of Disease Study promotes a low-scenario, projecting world population will peak in 2064 at 9.7 billion and then decline to 8.8 billion in 2100, under the scenario of the advancement of women's rights globally. In this case TFR is assumed to decline more rapidly than the UN's projection, to reach 1.7 in 2100..[25]
- An analysis from the Wittgenstein Center IIASA predicts global population to peak in 2070 at 9.4 billion and then decline to 9.0 billion in 2100.[26]
Other assumptions can produce other results. Some of the authors of the 2004 UN report assumed that life expectancy would rise slowly and continuously. The projections in the report assume this with no upper limit, though at a slowing pace depending on circumstances in individual countries. By 2100, the report assumed life expectancy to be from 66 to 97 years, and by 2300 from 87 to 106 years, depending on the country. Based on that assumption, they expect that rising life expectancy will produce small but continuing population growth by the end of the projections, ranging from 0.03 to 0.07 percent annually. The hypothetical feasibility (and wide availability) of life extension by technological means would further contribute to long term (beyond 2100) population growth .[27][28][29]
Evolutionary biology also suggests the demographic transition may reverse itself and global population may continue to grow in the long term.[30] In addition, recent evidence suggests birth rates may be rising in the 21st century in the developed world.[31]
Growth regions[]
The table below shows that from 2020 to 2050, the bulk of the world's population growth is predicted to take place in Africa: of the additional 1.9 billion people projected between 2020 and 2050, 1.2 billion will be added in Africa, 0.7 billion in Asia and zero in the rest of the world. Africa's share of global population is projected to grow from 17% in 2020 to 26% in 2050 and 39% by 2100, while the share of Asia will fall from 59% in 2020 to 55% in 2050 and 43% in 2100.[23][8] The strong growth of the African population will happen regardless of the rate of decrease of fertility, because of the exceptional proportion of young people already living today. For example, the UN projects that the population of Nigeria will surpass that of the United States by about 2050.[6]
| Region | Pop
2020 |
% of
Total |
Pop
2050 |
% of
Total |
Chg
2020–50 |
Pop
2100 |
% of
Total |
|---|---|---|---|---|---|---|---|
| Africa | 1.3 | 17 | 2.5 | 26 | 1.2 | 4.3 | 39 |
| Asia | 4.6 | 59 | 5.3 | 55 | 0.7 | 4.7 | 43 |
| Other | 1.9 | 24 | 1.9 | 20 | 0.0 | 1.9 | 17 |
| World | 7.8 | 100 | 9.7 | 100 | 1.9 | 10.9 | 100 |
The population of the More Developed regions is slated to remain mostly unchanged, at 1.3 billion for the remainder of the 21st century. All population growth comes from the Less Developed regions.[23][32]
| Region | Pop
2020 |
% of
Total |
Pop
2050 |
% of
Total |
Chg
2020–50 |
Pop
2100 |
% of
Total |
|---|---|---|---|---|---|---|---|
| More Developed | 1.3 | 17 | 1.3 | 13 | 0.0 | 1.3 | 12 |
| Less Developed | 6.5 | 83 | 8.4 | 87 | 1.9 | 9.6 | 88 |
| World | 7.8 | 100 | 9.7 | 100 | 1.9 | 10.9 | 100 |
The table below breaks out the UN's future population growth predictions by region[8]
| Region | 2020–25
% chg/yr
|
2045–50
% chg/yr |
2095–2100
% chg/yr |
|---|---|---|---|
| Africa | 2.4 | 1.8 | 0.6 |
| Asia | 0.8 | 0.1 | −0.4 |
| Europe | 0.0 | −0.3 | −0.1 |
| Latin America & the Caribbean | 0.8 | 0.2 | −0.5 |
| Northern America | 0.6 | 0.3 | 0.2 |
| Oceania | 1.2 | 0.8 | 0.4 |
| World | 1.0 | 0.5 | 0.0 |
Between 2020 and the end of this century, the UN predicts that all six regions will experience declines in population growth, that by the end of the century three of them will be experiencing population decline, and the world will have reached zero population growth.
Most populous nations by 2050 and 2100[]
The UN Population Division has calculated the future population of the world's countries, based on current demographic trends. Current (2020) world population is 7.8 billion. The 2019 report projects world population in 2050 to be 9.7 billion people, and possibly as high as 11 billion by the next century, with the following estimates for the top 14 countries in 2020, 2050, and 2100:[23]
| Country | Pop 2020 (mil) | Pop 2050 (mil) | Pop 2100 (mil) | 2020 Rank | 2050 Rank | 2100 Rank |
|---|---|---|---|---|---|---|
| China | 1,439 | 1,402 | 1,065 | 1 | 2 | 2 |
| India | 1,380 | 1,639 | 1,447 | 2 | 1 | 1 |
| United States | 331 | 379 | 434 | 3 | 4 | 4 |
| Indonesia | 273 | 331 | 321 | 4 | 6 | 7 |
| Pakistan | 221 | 338 | 403 | 5 | 5 | 5 |
| Brazil | 212 | 250 | 304 | 6 | 7 | 12 |
| Nigeria | 206 | 401 | 733 | 7 | 3 | 3 |
| Bangladesh | 165 | 192 | 151 | 8 | 10 | 14 |
| Russia | 146 | 136 | 126 | 9 | 14 | 19 |
| Mexico | 129 | 155 | 141 | 10 | 12 | 17 |
| Japan | 126 | 106 | 75 | 11 | 17 | 36 |
| Ethiopia | 115 | 205 | 294 | 12 | 8 | 8 |
| Philippines | 110 | 144 | 146 | 13 | 13 | 15 |
| Egypt | 102 | 160 | 225 | 14 | 11 | 10 |
| Democratic Republic of the Congo | 90 | 194 | 362 | 16 | 9 | 6 |
| Tanzania | 60 | 135 | 286 | 24 | 15 | 9 |
| Niger | 24 | 66 | 165 | 56 | 30 | 13 |
| Angola | 33 | 77 | 188 | 44 | 24 | 11 |
| World | 7,795 | 9,735 | 10,875 |
From 2017 to 2050, the nine highlighted countries are expected to account for half of the world's projected population increase: India, Nigeria, the Democratic Republic of the Congo, Pakistan, Ethiopia, Tanzania, the United States, Uganda, and Indonesia, listed according to the expected size of their contribution to that projected population growth.[22]
Population projections of the largest metropolitan areas[]
Large urban areas are hubs of economic development and innovation, with larger cities underpinning regional economies and local and global sustainability initiatives. Currently, 757 million humans live in the 101 largest cities;[33] these cities are home to 11% of the world's population.[33] By the end of the century, the world population is projected to grow, with estimates ranging from 6.9 billion to 13.1 billion;[33] the percentage of people living in the 101 largest cities is estimated to be 15% to 23%.[33]
The following 101 metropolitan areas with the largest population projections for the years 2025, 2050, 2075, and 2100 are listed below.[33]
| Rank | City | Projected Population (millions) 2025 |
City | Projected Population (millions) 2050 |
City | Projected Population (millions) 2075 |
City | Projected Population (millions) 2100 |
|---|---|---|---|---|---|---|---|---|
| 1 | 36.40 | 42.40 | 58.42 | 88.30 | ||||
| 2 | 26.39 | 36.16 | 57.86 | 83.53 | ||||
| 3 | 22.50 | 35.19 | 57.20 | 73.68 | ||||
| 4 | 22.02 | 35.00 | 49.34 | 67.24 | ||||
| 5 | 21.43 | 33.04 | 46.22 | 57.33 | ||||
| 6 | 21.01 | 32.63 | 45.09 | 56.59 | ||||
| 7 | 20.63 | 32.62 | 43.37 | 56.15 | ||||
| 8 | 20.56 | 31.70 | 37.49 | 54.25 | ||||
| 9 | 19.41 | 24.77 | 33.00 | 52.40 | ||||
| 10 | 19.10 | 24.33 | 32.75 | 50.30 | ||||
| 11 | 16.76 | 24.03 | 32.67 | 49.06 | ||||
| 12 | 15.80 | 23.55 | 30.68 | 46.66 | ||||
| 13 | 15.56 | 22.82 | 68.92 | 41.38 | ||||
| 14 | 14.81 | 21.32 | 28.42 | 40.91 | ||||
| 15 | 14.55 | 17.45 | 27.92 | 40.54 | ||||
| 16 | 13.77 | 17.09 | 24.39 | 40.14 | ||||
| 17 | 13.67 | 16.42 | 24.18 | 39.96 | ||||
| 18 | 13.41 | 16.28 | 23.88 | 37.74 | ||||
| 19 | 12.36 | 16.00 | 23.81 | 36.37 | ||||
| 20 | 12.10 | 15.97 | 22.21 | 35.82 | ||||
| 21 | 11.84 | 15.97 | 21.31 | 34.10 | ||||
| 22 | 11.37 | 15.92 | 21.28 | 30.19 | ||||
| 23 | 10.53 | 15.62 | 21.05 | 28.81 | ||||
| 24 | 11.37 | 15.55 | 20.37 | 28.28 | ||||
| 25 | 10.20 | 15.09 | 20.23 | 27.21 | ||||
| 26 | 10.13 | 14.61 | 19.94 | 27.05 | ||||
| 27 | 10.04 | 14.30 | 19.65 | 25.81 | ||||
| 28 | 9.93 | 14.29 | 18.51 | 25.63 | ||||
| 29 | 9.81 | 14.25 | 17.69 | 24.77 | ||||
| 30 | 9.74 | 14.18 | 17.55 | 23.68 | ||||
| 31 | 9.72 | 13.21 | 16.93 | 23.55 | ||||
| 32 | 9.60 | 13.00 | 16.69 | 23.17 | ||||
| 33 | 9.60 | 12.43 | 16.56 | 22.95 | ||||
| 34 | 9.34 | 12.21 | 16.40 | 22.22 | ||||
| 35 | 9.24 | 11.93 | 16.04 | 21.18 | ||||
| 36 | 9.09 | 11.86 | 15.94 | 21.07 | ||||
| 37 | 8.62 | 11.57 | 15.78 | 20.79 | ||||
| 38 | 8.33 | 11.56 | 15.52 | 20.63 | ||||
| 39 | 8.31 | 11.20 | 15.32 | 20.53 | ||||
| 40 | 8.28 | 11.12 | 15.06 | 20.01 | ||||
| 41 | 8.24 | 11.08 | 14.91 | 19.84 | ||||
| 42 | 8.15 | 11.00 | 14.81 | 19.71 | ||||
| 43 | 8.06 | 10.92 | 14.68 | 19.70 | ||||
| 44 | 7.94 | 10.71 | 14.56 | 19.12 | ||||
| 45 | 7.74 | 10.44 | 14.52 | 18.82 | ||||
| 46 | 7.64 | 10.26 | 14.48 | 18.58 | ||||
| 47 | 7.18 | 10.24 | 14.22 | 18.30 | ||||
| 48 | 7.03 | 10.19 | 13.54 | 18.22 | ||||
| 49 | 6.80 | 10.15 | 13.44 | 17.32 | ||||
| 50 | 6.75 | 10.05 | 12.84 | 17.32 | ||||
| 51 | 6.75 | 9.83 | 12.55 | 16.99 | ||||
| 52 | 6.31 | 9.75 | 12.51 | 15.58 | ||||
| 53 | 6.28 | 9.47 | 12.44 | 15.53 | ||||
| 54 | 6.27 | 9.47 | 12.40 | 14.79 | ||||
| 55 | 6.16 | 9.43 | 11.99 | 14.72 | ||||
| 56 | 6.16 | 9.17 | 11.89 | 14.66 | ||||
| 57 | 6.16 | 9.09 | 11.79 | 14.54 | ||||
| 58 | 6.13 | 8.75 | 11.75 | 14.53 | ||||
| 59 | 6.03 | 8.73 | 11.70 | 14.20 | ||||
| 60 | 5.95 | 8.52 | 11.64 | 14.01 | ||||
| 61 | 5.94 | 8.44 | 11.06 | 13.88 | ||||
| 62 | 5.87 | 8.09 | 10.92 | 13.20 | ||||
| 63 | 5.87 | 7.63 | 10.63 | 12.87 | ||||
| 64 | 5.70 | 7.53 | 10.41 | 12.81 | ||||
| 65 | 5.69 | 7.49 | 10.36 | 12.68 | ||||
| 66 | 5.65 | 7.39 | 10.26 | 12.14 | ||||
| 67 | 5.42 | 7.36 | 10.13 | 11.86 | ||||
| 68 | 5.37 | 7.26 | 10.09 | 11.73 | ||||
| 69 | 5.37 | 7.19 | 10.09 | 11.51 | ||||
| 70 | 5.37 | 7.11 | 10.03 | 11.46 | ||||
| 71 | 5.32 | 7.04 | 9.79 | 11.42 | ||||
| 72 | 5.23 | 6.94 | 9.73 | 11.21 | ||||
| 73 | 5.18 | 6.91 | 9.57 | 11.20 | ||||
| 74 | 5.15 | 6.90 | 9.51 | 11.14 | ||||
| 75 | 5.11 | 6.79 | 9.43 | 11.00 | ||||
| 76 | 5.10 | 6.77 | 9.27 | 11.00 | ||||
| 77 | 5.06 | 6.76 | 9.03 | 10.99 | ||||
| 78 | 5.05 | 6.76 | 9.00 | 10.95 | ||||
| 79 | 5.03 | 6.57 | 8.98 | 10.92 | ||||
| 80 | 4.97 | 6.52 | 8.96 | 10.82 | ||||
| 81 | 4.95 | 6.52 | 8.85 | 10.21 | ||||
| 82 | 4.89 | 6.51 | 8.65 | 10.05 | ||||
| 83 | 4.83 | 6.34 | 8.53 | 10.00 | ||||
| 84 | 4.77 | 6.22 | 8.49 | 9.90 | ||||
| 85 | 4.70 | 6.22 | 8.30 | 9.68 | ||||
| 86 | 4.63 | 6.22 | 8.26 | 9.56 | ||||
| 87 | 4.61 | 6.19 | 7.98 | 9.40 | ||||
| 88 | 4.60 | 6.15 | 7.86 | 9.40 | ||||
| 89 | 4.59 | 6.14 | 7.81 | 9.18 | ||||
| 90 | 4.58 | 6.06 | 7.67 | 9.13 | ||||
| 91 | 4.50 | 6.04 | 7.37 | 8.98 | ||||
| 92 | 4.48 | 5.95 | 7.34 | 8.87 | ||||
| 93 | 4.41 | 5.94 | 7.25 | 8.87 | ||||
| 94 | 4.38 | 5.90 | 7.08 | 8.42 | ||||
| 95 | 4.35 | 5.87 | 7.07 | 8.37 | ||||
| 96 | 4.34 | 5.84 | 7.06 | 8.33 | ||||
| 97 | 4.30 | 5.82 | 7.03 | 8.17 | ||||
| 98 | 4.28 | 5.76 | 6.98 | 8.17 | ||||
| 99 | 4.24 | 5.76 | 6.97 | 8.00 | ||||
| 100 | 4.23 | 5.75 | 6.97 | 7.93 | ||||
| 101 | 4.23 | 5.73 | 6.96 | 7.88 |
See also[]
- Population projection
- Population growth
- Estimates of historical world population
- Human overpopulation
- Pledge two or fewer (campaign for smaller families)
- List of sovereign states and dependencies by total fertility rate
- List of countries by number of births
References[]
- ^ "Population Projections". United States Census Bureau.
- ^ Jump up to: a b c d e Kaneda, Toshiko (June 2014). "Understanding Population Projections: Assumptions Behind the Numbers" (PDF). Population Reference Bureau.
- ^ Jump up to: a b c Roser, Max (2013-05-09). "Future Population Growth". Our World in Data.
- ^ Roser, Max (June 18, 2019). "Two centuries of rapid global population growth will come to an end". Our World in Data.
- ^ "World Population Prospects 2019". United Nations, Dept of Economic and Social Affairs. 2019.
- ^ Jump up to: a b "World Population Prospects 2019, Population Data, File: Total Population Both Sexes, Medium Variant tab". United Nations Population Division. 2019.
- ^ Jump up to: a b c d e f "World Population Prospects 2019, Dept of Economic and Social Affairs, File: Total Fertility". United Nations Population Division. 2019.
- ^ Jump up to: a b c "World Population Prospects 2019, Population Data, File: Population Growth Rate, Median Variant tab". United Nations Population Division. 2019.
- ^ "World's Population is Projected to Nearly Stop Growing by the end of the Century". June 17, 2019.
- ^ Vollset, Stein Emil; Goren, Emily; Yuan, Chun-Wei; Cao, Jackie; Smith, Amanda E.; Hsiao, Thomas; Bisignano, Catherine; Azhar, Gulrez S.; Castro, Emma; Chalek, Julian; Dolgert, Andrew J. (2020-10-17). "Fertility, mortality, migration, and population scenarios for 195 countries and territories from 2017 to 2100: a forecasting analysis for the Global Burden of Disease Study". The Lancet. 396 (10258): 1285–1306. doi:10.1016/S0140-6736(20)30677-2. ISSN 0140-6736. PMC 7561721. PMID 32679112.
- ^ "United Nations, Population Division, World Population Prospects, 2019 Revision, (Medium Variant)".
- ^ : Wie werden wir leben? ("How are we going to live?") Econ publishers, Munich 1954
- ^ Ciro Pabón y Ciro Pabón, Manual de Urbanismo, Editorial Leyer, Bogotá, 2007, ISBN 978-958-711-296-2
- ^ World Population to 2300. 2004. ISBN 9789211514018.
- ^ "World Population Prospects 2105, Archive, File: 2015 Revision". United Nations Population Division. 2015.
- ^ Jump up to: a b Gerland, P.; Raftery, A. E.; Ev Ikova, H.; Li, N.; Gu, D.; Spoorenberg, T.; Alkema, L.; Fosdick, B. K.; Chunn, J.; Lalic, N.; Bay, G.; Buettner, T.; Heilig, G. K.; Wilmoth, J. (September 14, 2014). "World population stabilization unlikely this century". Science. AAAS. 346 (6206): 234–7. doi:10.1126/science.1257469. ISSN 1095-9203. PMC 4230924. PMID 25301627.
- ^ Jump up to: a b "World Population Prospects 2017, Archive, File: 2017 Revision". United Nations Population Division. 2017. Retrieved 2017-11-29.
- ^ Randers, Jørgen (2012). 2052: A Global Forecast for the Next Forty Years. Vermont: Chelsea Green Publishing. p. 62.
- ^ Jump up to: a b c "World Population Prospects 2019, Mortality Data, File: Life Expectancy at Birth – Both Sexes, Estimates tab". United Nations Population Division. 2019.
- ^ Jump up to: a b c "World Population Prospects, Mortality Data, File: Life Expectancy at Birth – Both Sexes, Median Variant tab". United Nations Population Division. 2019.
- ^ "World Bank Migration and Remittances Factbook 2016" (PDF). World Bank Open Knowledge Archive. 2016.
- ^ Jump up to: a b "Growing at a slower pace, world population is expected to reach 9.7 billion in 2050 and could peak at nearly 11 billion around 2100". United Nations Department of Economic and Social Affairs. June 17, 2019.
- ^ Jump up to: a b c d e "World Population Prospects 2019, Population Data, File: Total Population-Both Sexes, Estimates tab". United Nations Population Division. 2019.
- ^ United Nations Department of Economic and Social Affairs. World Population to 2300. 2004. Executive Summary, p. 2.
- ^ Vollset, Stein Emil; Goren, Emily; Yuan, Chun-Wei (July 14, 2020). "Fertility, mortality, migration, and population scenarios for 195 countries and territories from 2017 to 2100: a forecasting analysis for the Global Burden of Disease Study". The Lancet.
- ^ "Projected world population by level of education". Our World In Data. 2016.
- ^ Newmark, PA; Sánchez Alvarado, A (2002). "Not your father's planarian: a classic model enters the era of functional genomics". Nat Rev Genet. 3 (3): 210–219. doi:10.1038/nrg759. PMID 11972158.
- ^ Bavestrello, Giorgio; Sommer, Christian; Sarà, Michele (1992). "Bi-directional conversion in Turritopsis nutricula (Hydrozoa)". Scientia Marina. 56 (2–3): 137–140.
- ^ Martínez, DE (1998). "Mortality patterns suggest lack of senescence in hydra". Exp Gerontol. 33 (3): 217–225. doi:10.1016/S0531-5565(97)00113-7. PMID 9615920. In an essay within the 2004 U.N. report, Tim Dyson said: "A rapid increase in life expectancy, which would raise the population pyramids, seems within reach, since it responds to an old and powerful demand for longevity."
- ^ Jason Collins (January 2019). "The heritability of fertility makes world population stabilization unlikely in the foreseeable future". Evolution and Human Behavior. 40 (1): 105–111. doi:10.1016/j.evolhumbehav.2018.09.001.
- ^ Can we be sure the world's population will stop rising?, BBC News, 13 October 2012
- ^ "Standard country or area codes for statistical use (the M49 standard)". United Nations, Dept of Economics and Social Affairs, Statistics Division. 1999.
- ^ Jump up to: a b c d e Hoornweg, Daniel; Pope, Kevin (January 2014). "Population predictions of the 101 largest cities in the 21st century" (PDF). Global Cities Institute (Working Paper No. 4).
- Population statistics
- Human overpopulation
- Population ecology
- Environmental controversies