San Luis, Batangas
San Luis
Balibago | |
|---|---|
| Municipality of San Luis | |
 | |
 Seal | |
 Map of Batangas with San Luis highlighted | |
OpenStreetMap  | |
 San Luis Location within the Philippines | |
| Coordinates: 13°50′N 120°56′E / 13.83°N 120.93°ECoordinates: 13°50′N 120°56′E / 13.83°N 120.93°E | |
| Country | Philippines |
| Region | Calabarzon |
| Province | Batangas |
| District | 2nd district |
| Founded | August 25, 1861[1] |
| Annexation to Taal | 1904[1] |
| Re-establishment | February 2, 1918[1] |
| Named for | Louis IX of France |
| Barangays | 26 (see Barangays) |
| Government | |
| • Type | Sangguniang Bayan |
| • Mayor | Danilo D. Medina |
| • Vice Mayor | Oscarlito M. Hernandez |
| • Representative | Raneo E. Abu |
| • Municipal Council | Members |
| • Electorate | 24,366 voters (2019) |
| Area | |
| • Total | 42.56 km2 (16.43 sq mi) |
| Elevation | 54 m (177 ft) |
| Highest elevation | 339 m (1,112 ft) |
| Lowest elevation | 0 m (0 ft) |
| Population (2020 census) [4] | |
| • Total | 36,172 |
| • Density | 850/km2 (2,200/sq mi) |
| • Households | 7,218 |
| Economy | |
| • Income class | 4th municipal income class |
| • Poverty incidence | 5.93% (2015)[5] |
| • Revenue | ₱117,360,006.77 (2020) |
| • Assets | ₱264,298,162.47 (2020) |
| • Expenditure | ₱107,052,933.14 (2020) |
| • Liabilities | ₱58,081,110.09 (2020) |
| Service provider | |
| • Electricity | Batangas 1 Electric Cooperative (BATELEC 1) |
| Time zone | UTC+8 (PST) |
| ZIP code | 4210 |
| PSGC | |
| IDD : area code | +63 (0)43 |
| Native languages | Tagalog |

San Luis, officially the Municipality of San Luis (Tagalog: Bayan ng San Luis), is a 4th class municipality in the province of Batangas, Philippines. According to the 2020 census, it has a population of 36,172 people. [4]
Geography[]
According to the Philippine Statistics Authority, the municipality has a land area of 42.56 square kilometres (16.43 sq mi) [6] constituting 1.36% of the 3,119.75-square-kilometre- (1,204.54 sq mi) total area of Batangas.
Barangays[]
San Luis is politically subdivided into 26 barangays.[7]
| PSGC | Barangay | Population | ±% p.a. | |||
|---|---|---|---|---|---|---|
| 2020 [4] | 2010 [8] | |||||
| 041024001 | Abiacao | 3.2% | 1,146 | 1,052 | 0.88% | |
| 041024002 | Bagong Tubig | 5.0% | 1,818 | 1,778 | 0.23% | |
| 041024003 | Balagtasin | 1.6% | 561 | 534 | 0.51% | |
| 041024004 | Balite | 2.8% | 997 | 942 | 0.59% | |
| 041024005 | Banoyo | 6.3% | 2,294 | 2,066 | 1.08% | |
| 041024006 | Boboy | 4.2% | 1,502 | 1,480 | 0.15% | |
| 041024007 | Bonliw | 3.2% | 1,145 | 1,002 | 1.38% | |
| 041024008 | Calumpang West | 3.3% | 1,186 | 1,081 | 0.96% | |
| 041024009 | Calumpang East | 4.0% | 1,464 | 1,430 | 0.24% | |
| 041024010 | Dulangan | 7.9% | 2,868 | 2,818 | 0.18% | |
| 041024011 | Durungao | 1.8% | 665 | 621 | 0.71% | |
| 041024012 | Locloc | 1.3% | 458 | 534 | −1.57% | |
| 041024013 | Luya | 3.4% | 1,229 | 1,063 | 1.50% | |
| 041024014 | Mahabang Parang | 2.0% | 734 | 602 | 2.06% | |
| 041024015 | Manggahan | 2.7% | 986 | 924 | 0.67% | |
| 041024016 | Muzon | 5.8% | 2,097 | 2,015 | 0.41% | |
| 041024019 | San Antonio | 1.8% | 656 | 624 | 0.52% | |
| 041024020 | San Isidro | 5.2% | 1,898 | 1,671 | 1.32% | |
| 041024021 | San Jose | 1.9% | 698 | 594 | 1.67% | |
| 041024022 | San Martin | 1.7% | 613 | 542 | 1.27% | |
| 041024023 | Santa Monica | 3.3% | 1,193 | 1,042 | 1.40% | |
| 041024024 | Taliba | 4.6% | 1,657 | 1,484 | 1.14% | |
| 041024025 | Talon | 3.4% | 1,238 | 1,124 | 1.00% | |
| 041024026 | Tejero | 3.5% | 1,258 | 1,068 | 1.70% | |
| 041024027 | Tungal | 1.5% | 558 | 487 | 1.41% | |
| 041024028 | Poblacion | 6.2% | 2,230 | 2,123 | 0.51% | |
| Total | 36,172 | 30,701 | 1.70% | |||
Climate[]
| Climate data for San Luis, Batangas | |||||||||||||
|---|---|---|---|---|---|---|---|---|---|---|---|---|---|
| Month | Jan | Feb | Mar | Apr | May | Jun | Jul | Aug | Sep | Oct | Nov | Dec | Year |
| Average high °C (°F) | 29 (84) |
30 (86) |
31 (88) |
33 (91) |
32 (90) |
30 (86) |
29 (84) |
29 (84) |
29 (84) |
29 (84) |
29 (84) |
29 (84) |
30 (86) |
| Average low °C (°F) | 20 (68) |
20 (68) |
21 (70) |
22 (72) |
24 (75) |
24 (75) |
24 (75) |
24 (75) |
24 (75) |
23 (73) |
22 (72) |
21 (70) |
22 (72) |
| Average precipitation mm (inches) | 11 (0.4) |
13 (0.5) |
14 (0.6) |
32 (1.3) |
101 (4.0) |
142 (5.6) |
208 (8.2) |
187 (7.4) |
175 (6.9) |
131 (5.2) |
68 (2.7) |
39 (1.5) |
1,121 (44.3) |
| Average rainy days | 5.2 | 5.0 | 7.4 | 11.5 | 19.8 | 23.5 | 27.0 | 25.9 | 25.2 | 23.2 | 15.5 | 8.3 | 197.5 |
| Source: Meteoblue [9] | |||||||||||||
Demographics[]
| Year | Pop. | ±% p.a. |
|---|---|---|
| 1903 | 5,316 | — |
| 1918 | 6,728 | +1.58% |
| 1939 | 8,464 | +1.10% |
| 1948 | 9,330 | +1.09% |
| 1960 | 12,290 | +2.32% |
| 1970 | 15,133 | +2.10% |
| 1975 | 16,884 | +2.22% |
| 1980 | 17,991 | +1.28% |
| 1990 | 22,143 | +2.10% |
| 1995 | 26,423 | +3.37% |
| 2000 | 26,924 | +0.40% |
| 2007 | 29,645 | +1.34% |
| 2010 | 30,701 | +1.28% |
| 2015 | 33,149 | +1.47% |
| 2020 | 36,172 | +1.73% |
| Source: Philippine Statistics Authority [10] [8] [11][12] | ||
In the 2020 census, San Luis had a population of 36,172. [4] The population density was 850 inhabitants per square kilometre (2,200/sq mi).
Economy[]
| Poverty Incidence of San Luis | |
| Source: Philippine Statistics Authority[13][14][15][16][17][18] | |
Gallery[]
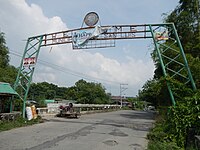
Welcome sign

Municipal hall
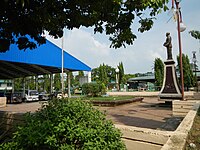
Town plaza

Public market

San Isidro Labrador Parish Church


References[]
- ^ a b c "HISTORY". San Luis Batangas. Retrieved August 9, 2021.
- ^ Municipality of San Luis | (DILG)
- ^ "2015 Census of Population, Report No. 3 – Population, Land Area, and Population Density" (PDF). Philippine Statistics Authority. Quezon City, Philippines. August 2016. ISSN 0117-1453. Archived (PDF) from the original on May 25, 2021. Retrieved July 16, 2021.
- ^ a b c d Census of Population (2020). "Region IV-A (Calabarzon)". Total Population by Province, City, Municipality and Barangay. PSA. Retrieved 8 July 2021.
- ^ https://psa.gov.ph/sites/default/files/City%20and%20Municipal-level%20Small%20Area%20Poverty%20Estimates_%202009%2C%202012%20and%202015_0.xlsx; publication date: 10 July 2019; publisher: Philippine Statistics Authority.
- ^ "Province: Batangas". PSGC Interactive. Quezon City, Philippines: Philippine Statistics Authority. Retrieved 12 November 2016.
- ^ "Municipal: San Luis, Batangas". PSGC Interactive. Quezon City, Philippines: Philippine Statistics Authority. Retrieved 8 January 2016.
- ^ a b Census of Population and Housing (2010). "Region IV-A (Calabarzon)". Total Population by Province, City, Municipality and Barangay. NSO. Retrieved 29 June 2016.
- ^ "San Luis: Average Temperatures and Rainfall". Meteoblue. Retrieved 5 May 2020.
- ^ Census of Population (2015). "Region IV-A (Calabarzon)". Total Population by Province, City, Municipality and Barangay. PSA. Retrieved 20 June 2016.
- ^ Censuses of Population (1903–2007). "Region IV-A (Calabarzon)". Table 1. Population Enumerated in Various Censuses by Province/Highly Urbanized City: 1903 to 2007. NSO.
- ^ "Province of Batangas". Municipality Population Data. Local Water Utilities Administration Research Division. Retrieved 17 December 2016.
- ^ "Poverty incidence (PI):". Philippine Statistics Authority. Retrieved 28 December 2020.
- ^ https://psa.gov.ph/sites/default/files/NSCB_LocalPovertyPhilippines_0.pdf; publication date: 29 November 2005; publisher: Philippine Statistics Authority.
- ^ https://psa.gov.ph/sites/default/files/2003%20SAE%20of%20poverty%20%28Full%20Report%29_1.pdf; publication date: 23 March 2009; publisher: Philippine Statistics Authority.
- ^ https://psa.gov.ph/sites/default/files/2006%20and%202009%20City%20and%20Municipal%20Level%20Poverty%20Estimates_0_1.pdf; publication date: 3 August 2012; publisher: Philippine Statistics Authority.
- ^ https://psa.gov.ph/sites/default/files/2012%20Municipal%20and%20City%20Level%20Poverty%20Estima7tes%20Publication%20%281%29.pdf; publication date: 31 May 2016; publisher: Philippine Statistics Authority.
- ^ https://psa.gov.ph/sites/default/files/City%20and%20Municipal-level%20Small%20Area%20Poverty%20Estimates_%202009%2C%202012%20and%202015_0.xlsx; publication date: 10 July 2019; publisher: Philippine Statistics Authority.
External links[]
| Wikimedia Commons has media related to San Luis, Batangas. |
Places adjacent to San Luis, Batangas | ||||||||||||||||
|---|---|---|---|---|---|---|---|---|---|---|---|---|---|---|---|---|
| ||||||||||||||||
Batangas City (capital) | |
| Municipalities | |
| Component cities | |
This article about a location in Calabarzon region is a stub. You can help Wikipedia by . |
- Municipalities of Batangas
- Calabarzon geography stubs