2016 United States presidential election in Maryland
| ||||||||||||||||||||||||||
| Turnout | 71.98% | |||||||||||||||||||||||||
|---|---|---|---|---|---|---|---|---|---|---|---|---|---|---|---|---|---|---|---|---|---|---|---|---|---|---|
| ||||||||||||||||||||||||||
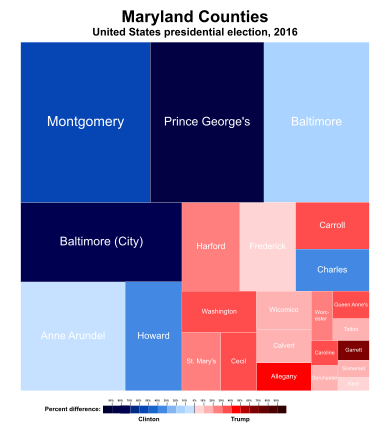
 County Results
| ||||||||||||||||||||||||||
| ||||||||||||||||||||||||||

| Elections in Maryland |
|---|
 |
|
|
|
|
|
|
|
|
|
|
The 2016 United States presidential election in Maryland was held on Tuesday, November 8, 2016, as part of the 2016 United States presidential election in which all 50 states plus the District of Columbia participated. Maryland voters chose electors to represent them in the Electoral College via a popular vote, pitting the Republican Party's nominee, businessman Donald Trump, and running mate Indiana Governor Mike Pence against Democratic Party nominee, former Secretary of State Hillary Clinton, and her running mate Virginia Senator Tim Kaine. Maryland has 10 electoral votes in the Electoral College.[2]
Clinton won Maryland with 60.3% of the vote, while Trump received 33.9%.[3] Maryland was among the eleven states in which Clinton improved on Barack Obama's 2012 raw vote total, although by just 84 votes.[4] Maryland was one of four states in which Clinton received over 60% of the vote, the others being Massachusetts, Hawaii, and California; out of the four, however, Maryland was the only one to have voted more Democratic in both 2012 and 2016.
Clinton continued the tradition of Democratic dominance in the state of Maryland, capturing large majorities of the vote in the densely populated and heavily nonwhite Democratic Baltimore–Washington metropolitan area, while Trump easily outperformed her in more white, sparsely populated regions elsewhere in the state that tend to vote Republican. While Republicans typically win more counties, they are usually swamped by the heavily Democratic counties between Baltimore and Washington. Though Trump won 17 of Maryland’s 24 county-level jurisdictions, the state's four largest county-level jurisdictions—Montgomery, Prince George's and Baltimore counties and the City of Baltimore—all broke for Clinton by double digits, enough to deliver the state to her.
Clinton became the first Democrat to win Anne Arundel County, home to the state capital of Annapolis, since Lyndon B. Johnson in 1964. Therefore, Trump became the first Republican to win the White House without carrying Anne Arundel County since Calvin Coolidge in 1924.
Background[]
The incumbent President of the United States, Barack Obama, a Democrat and former U.S. Senator from Illinois, was first elected president in the 2008 election, running with former Senator Joe Biden of Delaware. Defeating the Republican nominee, Senator John McCain of Arizona, with 52.9% of the popular vote and 68% of the electoral vote,[5][6] Obama succeeded two-term Republican President George W. Bush, the former Governor of Texas. Obama and Biden were reelected in the 2012 presidential election, defeating former Massachusetts Governor Mitt Romney with 51.1% of the popular vote and 61.7% of electoral votes.[7] Although Barack Obama's approval rating in the RealClearPolitics poll tracking average remained between 40 and 50% for most of his second term, it has experienced a surge in early 2016 and reached its highest point since 2012 during June of that year.[8][9] Analyst Nate Cohn has noted that a strong approval rating for Barack Obama would equate to a strong performance for the Democratic candidate, and vice versa.[10]
Following his second term, President Barack Obama was not eligible for another reelection. In October 2015, Obama's running-mate and two-term Vice President Joe Biden decided not to enter the race for the Democratic presidential nomination either.[11] With their terms expiring on January 20, 2017, the electorate was asked to elect a new president, the 45th president and 48th vice president of the United States, respectively.
Results[]
| Party | Candidate | Running mate | Votes | % | Electoral votes | |
|---|---|---|---|---|---|---|
| Democratic | Hillary Clinton | Tim Kaine | 1,677,928 | 60.33% | 10 | |
| Republican | Donald Trump | Mike Pence | 943,169 | 33.91% | 0 | |
| Libertarian | Gary Johnson | William Weld | 79,605 | 2.86% | 0 | |
| Green | Jill Stein | Ajamu Baraka | 35,945 | 1.29% | 0 | |
| Others | Write ins | 44,799 | 1.61% | 0 | ||
| Total | 2,781,446 | 100.00% | 10 | |||
Results by county[]
| County | Hillary Rodham Clinton Democratic |
Donald John Trump Republican |
Various candidates Other parties |
Margin | Total votes cast | ||||
|---|---|---|---|---|---|---|---|---|---|
| # | % | # | % | # | % | # | % | ||
| Allegany | 7,875 | 25.69% | 21,270 | 69.39% | 1,509 | 4.92% | −13,395 | −43.70% | 30,654 |
| Anne Arundel | 128,419 | 47.55% | 122,403 | 45.32% | 19,259 | 7.13% | 6,016 | 2.23% | 270,081 |
| Baltimore County | 218,412 | 55.91% | 149,477 | 38.26% | 22,793 | 5.83% | 68,935 | 17.64% | 390,682 |
| Baltimore City | 202,673 | 84.66% | 25,205 | 10.53% | 11,524 | 4.81% | 177,468 | 74.13% | 239,402 |
| Calvert | 18,225 | 38.44% | 26,176 | 55.21% | 3,007 | 6.34% | −7,951 | −16.77% | 47,408 |
| Caroline | 4,009 | 28.41% | 9,368 | 66.38% | 736 | 5.22% | −5,359 | −37.97% | 14,113 |
| Carroll | 26,567 | 28.92% | 58,215 | 63.38% | 7,066 | 7.69% | −31,648 | −34.46% | 91,848 |
| Cecil | 13,650 | 30.15% | 28,868 | 63.77% | 2,751 | 6.08% | −15,218 | −33.62% | 45,269 |
| Charles | 49,341 | 63.01% | 25,614 | 32.71% | 3,348 | 4.28% | 23,727 | 30.30% | 78,303 |
| Dorchester | 6,245 | 41.02% | 8,413 | 55.26% | 567 | 3.72% | −2,168 | −14.24% | 15,225 |
| Frederick | 56,522 | 44.97% | 59,522 | 47.36% | 9,633 | 7.66% | −3,000 | −2.39% | 125,677 |
| Garrett | 2,567 | 18.32% | 10,776 | 76.91% | 668 | 4.77% | −8,209 | −58.59% | 14,011 |
| Harford | 47,077 | 35.22% | 77,860 | 58.25% | 8,735 | 6.53% | −30,783 | −23.03% | 133,672 |
| Howard | 102,597 | 63.26% | 47,484 | 29.28% | 12,112 | 7.47% | 55,113 | 33.98% | 162,193 |
| Kent | 4,575 | 45.65% | 4,876 | 48.66% | 570 | 5.69% | −301 | −3.00% | 10,021 |
| Montgomery | 357,837 | 74.72% | 92,704 | 19.36% | 28,332 | 5.92% | 265,133 | 55.37% | 478,873 |
| Prince George's | 344,049 | 88.13% | 32,811 | 8.40% | 13,525 | 3.46% | 311,238 | 79.73% | 390,385 |
| Queen Anne's | 7,973 | 30.06% | 16,993 | 64.07% | 1,557 | 5.87% | −9,020 | −34.01% | 26,523 |
| St. Mary's | 17,534 | 35.18% | 28,663 | 57.51% | 3,645 | 7.31% | −11,129 | −22.33% | 49,842 |
| Somerset | 4,196 | 42.38% | 5,341 | 53.95% | 363 | 3.67% | −1,145 | −11.57% | 9,900 |
| Talbot | 8,653 | 42.10% | 10,724 | 52.18% | 1,176 | 5.72% | −2,071 | −10.08% | 20,553 |
| Washington | 21,129 | 32.02% | 40,998 | 62.13% | 3,864 | 5.86% | −19,869 | −30.11% | 65,991 |
| Wicomico | 18,050 | 42.42% | 22,198 | 52.17% | 2,299 | 5.40% | −4,148 | −9.75% | 42,547 |
| Worcester | 9,753 | 34.50% | 17,210 | 60.87% | 1,310 | 4.63% | −7,457 | −26.37% | 28,273 |
| Totals | 1,677,928 | 60.33% | 943,169 | 33.91% | 160,349 | 5.76% | 734,759 | 26.42% | 2,781,446 |
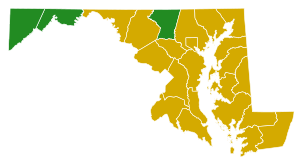
Counties that flipped from Democratic to Republican[]
- Somerset (largest town: Princess Anne)
Counties that flipped from Republican to Democratic[]
- Anne Arundel (largest community: Glen Burnie)
By congressional district[]
Clinton won 7 of the state's 8 congressional districts.[12]
| District | Clinton | Trump | Representative |
|---|---|---|---|
| 1st | 35% | 60% | Andy Harris |
| 2nd | 58% | 37% | Dutch Ruppersberger |
| 3rd | 63% | 32% | John Sarbanes |
| 4th | 77% | 20% | Donna Edwards |
| Anthony Brown | |||
| 5th | 65% | 31% | Steny Hoyer |
| 6th | 55% | 40% | John Delaney |
| 7th | 74% | 22% | Elijah Cummings |
| 8th | 64% | 31% | Chris Van Hollen |
| Jamie Raskin |
Primary elections[]
Democratic primary[]
| Maryland Democratic primary, April 26, 2016 | |||||
|---|---|---|---|---|---|
| Candidate | Popular vote | Estimated delegates | |||
| Count | Percentage | Pledged | Unpledged | Total | |
| Hillary Clinton | 573,242 | 62.53% | 60 | 17 | 77 |
| Bernie Sanders | 309,990 | 33.81% | 35 | 1 | 36 |
| Rocky De La Fuente | 3,582 | 0.39% | N/A | ||
| Uncommitted | 29,949 | 3.27% | 0 | 6 | 6 |
| Total | 916,763 | 100% | 95 | 24 | 119 |
| Source: The Green Papers, Maryland State Board of Elections - Official Primary Results, MDP Announces DNC Delegates, Alternates and State DNC Members, MDP Announces District-Level Delegate Winners | |||||
Republican primary[]

| Candidate | Votes | Percentage | Actual delegate count | ||
|---|---|---|---|---|---|
| Bound | Unbound | Total | |||
| Donald Trump | 248,343 | 54.10% | 38 | 0 | 38 |
| John Kasich | 106,614 | 23.22% | 0 | 0 | 0 |
| Ted Cruz | 87,093 | 18.97% | 0 | 0 | 0 |
| Ben Carson (withdrawn) | 5,946 | 1.30% | 0 | 0 | 0 |
| Marco Rubio (withdrawn) | 3,201 | 0.70% | 0 | 0 | 0 |
| Jeb Bush (withdrawn) | 2,770 | 0.60% | 0 | 0 | 0 |
| Rand Paul (withdrawn) | 1,533 | 0.33% | 0 | 0 | 0 |
| Chris Christie (withdrawn) | 1,239 | 0.27% | 0 | 0 | 0 |
| Carly Fiorina (withdrawn) | 1,012 | 0.22% | 0 | 0 | 0 |
| Mike Huckabee (withdrawn) | 837 | 0.18% | 0 | 0 | 0 |
| Rick Santorum (withdrawn) | 478 | 0.10% | 0 | 0 | 0 |
| Unprojected delegates: | 0 | 0 | 0 | ||
| Total: | 459,066 | 100.00% | 38 | 0 | 38 |
| Source: The Green Papers | |||||
Minor parties[]
Green primary[]
Libertarian convention[]
| Candidate | Delegate Votes | Percentage |
|---|---|---|
| Gary Johnson | 10 | 56% |
| Marc Allan Feldman | 4 | 22% |
| Darryl W. Perry | 2 | 11% |
| Austin Petersen | 2 | 11% |
| Others | - | - |
| Total | 18 | 100% |
| Candidate | Delegate Votes | Percentage |
|---|---|---|
| Gary Johnson | 10 | 67% |
| Marc Allan Feldman | 2 | 13% |
| Darryl W. Perry | 2 | 13% |
| John McAfee | 1 | 7% |
| Others | - | - |
| Total | 15 | 100% |
Polling[]
See also[]
- United States presidential elections in Maryland
- 2016 Democratic Party presidential debates and forums
- 2016 Democratic Party presidential primaries
- 2016 Republican Party presidential debates and forums
- 2016 Republican Party presidential primaries
References[]
- ^ "Official Turnout (By Party and County)" (PDF).
- ^ "Distribution of Electoral Votes". National Archives and Records Administration. 19 September 2019. Retrieved November 26, 2020.
- ^ "Maryland Election Results 2016". The New York Times. 2016-11-08. Retrieved 2016-11-13.
- ^ http://uselectionatlas.org/RESULTS/data.php?year=2016&def=swg&datatype=national&f=0&off=0&elect=0
- ^ "United States House of Representatives floor summary for Jan 8, 2009". Clerk.house.gov. Archived from the original on April 2, 2012. Retrieved January 30, 2009.
- ^ "Federal elections 2008" (PDF). Federal Election Commission. Retrieved May 11, 2015.
- ^ "President Map". The New York Times. November 29, 2012. Retrieved May 11, 2015.
- ^ "Election Other – President Obama Job Approval". RealClearPolitics. Retrieved December 24, 2015.
- ^ Byrnes, Jesse (2016-06-15). "Poll: Obama approval rating highest since 2012". TheHill. Retrieved 2016-06-19.
- ^ Cohn, Nate (2015-01-19). "What a Rise in Obama's Approval Rating Means for 2016". The New York Times. ISSN 0362-4331. Retrieved 2016-06-19.
- ^ "Joe Biden Decides Not to Enter Presidential Race". The Wall Street Journal. Retrieved October 21, 2015.
- ^ "Introducing the 2017 Cook Political Report Partisan Voter Index".
- ^ a b Libertarian Party National Convention (Live Video). Orlando, Florida: C-SPAN. May 29, 2016. Retrieved May 29, 2016.
External links[]
State and district results of the 2016 United States presidential election | ||
|---|---|---|
|  | |
- 2016 United States presidential election by state
- United States presidential elections in Maryland
- 2016 Maryland elections