Clay County, Kentucky
Clay County | |
|---|---|
U.S. county | |
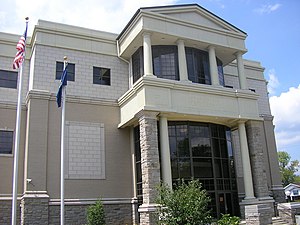 Clay County courthouse in Manchester | |
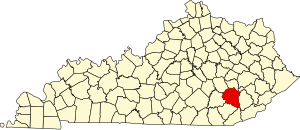 Location within the U.S. state of Kentucky | |
 Kentucky's location within the U.S. | |
| Coordinates: 37°10′N 83°43′W / 37.16°N 83.71°W | |
| Country | |
| State | |
| Founded | 1807 |
| Named for | Green Clay |
| Seat | Manchester |
| Largest city | Manchester |
| Area | |
| • Total | 471 sq mi (1,220 km2) |
| • Land | 469 sq mi (1,210 km2) |
| • Water | 1.8 sq mi (5 km2) 0.4%% |
| Population | |
| • Estimate (2018) | 20,105 |
| • Density | 46/sq mi (18/km2) |
| Time zone | UTC−5 (Eastern) |
| • Summer (DST) | UTC−4 (EDT) |
| Congressional district | 5th |
| Website | claycounty |

Clay County is a county located in the U.S. state of Kentucky. As of the 2010 census, the population was 21,730.[1] Its county seat is Manchester.[2] The county was formed in 1807 and named in honor of Green Clay (1757–1826).[3] Clay was a member of the Virginia and Kentucky State legislatures, first cousin once removed of Henry Clay, U.S. Senator from Kentucky and Secretary of State in the 19th century.
History[]
Clay County was established in 1807 from land given by Floyd, Knox and Madison counties. The courthouse burned in January 1936.[4]
Geography[]
According to the U.S. Census Bureau, the county has a total area of 471 square miles (1,220 km2), of which 469 square miles (1,210 km2) is land and 1.8 square miles (4.7 km2) (0.4%) is water.[5]
Adjacent counties[]
- Owsley County (north)
- Perry County (northeast)
- Leslie County (east)
- Bell County (southeast)
- Knox County (southwest)
- Laurel County (west)
- Jackson County (northwest)
Watercourses[]
Demographics[]
| Historical population | |||
|---|---|---|---|
| Census | Pop. | %± | |
| 1810 | 2,398 | — | |
| 1820 | 4,393 | 83.2% | |
| 1830 | 3,548 | −19.2% | |
| 1840 | 4,607 | 29.8% | |
| 1850 | 5,421 | 17.7% | |
| 1860 | 6,652 | 22.7% | |
| 1870 | 8,297 | 24.7% | |
| 1880 | 10,222 | 23.2% | |
| 1890 | 12,447 | 21.8% | |
| 1900 | 15,364 | 23.4% | |
| 1910 | 17,789 | 15.8% | |
| 1920 | 19,795 | 11.3% | |
| 1930 | 18,526 | −6.4% | |
| 1940 | 23,901 | 29.0% | |
| 1950 | 23,116 | −3.3% | |
| 1960 | 20,748 | −10.2% | |
| 1970 | 18,481 | −10.9% | |
| 1980 | 22,752 | 23.1% | |
| 1990 | 21,746 | −4.4% | |
| 2000 | 24,556 | 12.9% | |
| 2010 | 21,730 | −11.5% | |
| 2018 (est.) | 20,105 | [6] | −7.5% |
| U.S. Decennial Census[7] 1790–1960[8] 1900–1990[9] 1990–2000[10] 2010–2013[1] | |||
As of the census[11] of 2010, there were 21,730 people, 8,556 households, and 6,442 families residing in the county. The population density was 52 people per square mile (20/km2). There were 9,439 housing units at an average density of 20 per square mile (8/km2). The racial makeup of the county was 93.9% White, 4.8% Black or African American, 0.2% Native American, 0.1% Asian, <0.1% Pacific Islander, 0.2% from other races, and 0.7% from two or more races. 1.4% of the population were Hispanics or Latinos of any race.
There were 8,556 households, out of which 36.9% had children under the age of 18 living with them, 58.6% were married couples living together, 12.4% had a female householder with no husband present, and 24.7% were non-families. 22.5% of all households were made up of individuals, and 9.0% had someone living alone who was 65 years of age or older. The average household size was 2.62 and the average family size was 3.06.
The age distribution was 25.4% under the age of 18, 9.2% from 18 to 24, 32.6% from 25 to 44, 22.5% from 45 to 64, and 10.3% who were 65 years of age or older. The median age was 35 years. For every 100 females there were 111.7 males. For every 100 females age 18 and over, there were 112.6 males.
The median income for a household in the county was $16,271, and the median income for a family was $18,925. Males had a median income of $24,164 versus $17,816 for females. The per capita income for the county was $9,716. About 35.4% of families and 39.7% of the population were below the poverty line, including 47.6% of those under age 18 and 31.3% of those age 65 or over.
The county's per-capita income and median household income make it one of the poorest counties in the United States. Among counties whose population contains a non-Hispanic white majority, it is the poorest by per-capita income and second to another county in the same Kentucky region, Owsley County, by median household income.
Communities[]
City[]
- Manchester (county seat)
Census-designated places[]
Unincorporated towns and villages[]
Post offices[]
Many former post offices were, and some current ones are, located along the waterways, which are paralleled by modern roads. Arrows denote renamings.
- Alger
- Bernice
- Barcreek
- Bessie → Mill Pond
- Big Creek
- Bluehole
- Botto
- Brightshade
- Burning Springs
- Caution
- Cedral
- Chesnut Hill → Chesnut
- Chesnutburg
- Potters Choice → Choice
- Cottongim
- Disappoint
- Eriline
- Eros
- Ethal → Ethel
- Fall Rock
- Garrard
- Goose Rock
- Grace
- Hacker → Hensley
- Hollingsworth
- Hooker
- Crawfish → Hima
- Laurel Creek
- Lincoln
- Lipps
- Lockards
- Malcom
- Marcum
- Martins Creek
- Mount Welcome
- Adela → Murray → Muncie Fork
- Ogle
- Annalee → Redbird River → Peabody
- Pigeonroost
- Plank
- Rockgap
- Sibert
- Sory
- Spurlock
- Tanksley
- Tinker
- Treadway
- Wildcat
- Sacker Gap
- Seeley
- Sextons Creek
- Smallwood
- Sourwood
- Urban
- Vine
- Wages
Other places[]
There are also places named in early censuses, some still identifiable today: Ammie, Ashers Fork, Creekville, Deer Lick, Felty, Gardner, Jacks Creek, McWhorter, Portersburg, Queendale, Shepherdtown, Sidell, Spring Creek, Teges, and Trixie.
Politics[]
Clay County has been rock-ribbed Republican since the Civil War, having last voted for a Democratic nominee for president in 1860 when it supported Kentucky native and Southern Democrat John C. Breckinridge.[12] In the last one hundred years the only Republicans to receive less than sixty percent were Bob Dole, who still won the county by nearly 25 percent, and Barry Goldwater, who held the county by seventy-five votes amidst a Democratic landslide in 1964. In 2008 John McCain received 77.5% of the vote.[13]
The county is located in Kentucky's 5th congressional district represented by Representative Hal Rogers.[15]
Health[]
In July 2010, The Washington Post named Clay County the unhealthiest county in Kentucky, and one of the unhealthiest in the nation. Clay County also featured prominently in a June 2014 article in The New York Times about the difficulty of living in poverty in eastern Kentucky, ranking last in overall ratings for counties in the United States. The factors which accounted for Clay county's low ranking were unemployment, prevalence of disabilities, obesity, income, and education.[16] The Times declared Clay County the "hardest place to live in the U.S."[17]
Life expectancy[]
Of 3,142 counties in the United States in 2014, Clay County ranked 3,137 in the longevity of female residents and 3,109 in the longevity of male residents. Males in Clay County lived an average of 68.6 years and females lived an average of 73.6 years compared to the national average for longevity of 76.5 for males and 81.2 for females. Moreover, the average longevity in Clay County declined by 0.4 years for males and 3.4 years for females between 1985 and 2014 compared to a national average for the same period of an increased life span of 5.5 years for men and 3.1 years for women. High rates of smoking and obesity and a low level of physical activity appear to be contributing factors to the lowered longevity for both sexes.[18]
See also[]
References[]
- ^ Jump up to: a b "State & County QuickFacts". United States Census Bureau. Archived from the original on July 8, 2011. Retrieved March 6, 2014.
- ^ "Find a County". National Association of Counties. Archived from the original on 2011-05-31. Retrieved 2011-06-07.
- ^ Rennick, Robert M. (1987). Kentucky Place Names. University Press of Kentucky. p. 59. ISBN 0813126312. Retrieved 2013-04-28.
- ^ Hogan, Roseann Reinemuth (1992). Kentucky Ancestry: A Guide to Genealogical and Historical Research. Ancestry Publishing. p. 218. ISBN 9780916489496. Retrieved 26 July 2013.
- ^ "2010 Census Gazetteer Files". United States Census Bureau. August 22, 2012. Archived from the original on August 12, 2014. Retrieved August 13, 2014.
- ^ "Population and Housing Unit Estimates". Retrieved July 26, 2019.
- ^ "U.S. Decennial Census". United States Census Bureau. Retrieved August 13, 2014.
- ^ "Historical Census Browser". University of Virginia Library. Retrieved August 13, 2014.
- ^ "Population of Counties by Decennial Census: 1900 to 1990". United States Census Bureau. Retrieved August 13, 2014.
- ^ "Census 2000 PHC-T-4. Ranking Tables for Counties: 1990 and 2000" (PDF). United States Census Bureau. Retrieved August 13, 2014.
- ^ "U.S. Census website". United States Census Bureau. Retrieved 2008-01-31.
- ^ "Dave Leip's Presidential Atlas (Election maps for Kentucky)". Uselectionatlas.org. Retrieved 2012-09-03.
- ^ "The New York Times Electoral Map (Zoom in on Kentucky)". Elections.nytimes.com. 2008-12-09. Retrieved 2012-09-03.
- ^ Leip, David. "Dave Leip's Atlas of U.S. Presidential Elections". uselectionatlas.org. Retrieved 2018-06-30.
- ^ "Kentucky Senators, Representatives, and Congressional District Maps - GovTrack.us". GovTrack.us. Retrieved 2018-06-30.
- ^ Lowrey, Annie (2014-06-29). "What's the Matter With Eastern Kentucky?". The New York Times.
- ^ Flippen, Alan (June 26, 2014), "Where Are the Hardest Places to Live in the U.S.?" The New York Times.
- ^ "Clay County, Kentucky", [1], accessed 19 May 2021
Further reading[]
- Works Progress Administration (1936). "Clay County". County Histories of Kentucky. Morehead State University (19).
- Works Progress Administration (1939). "Clay County – Folklore". County Histories of Kentucky. Morehead State University (322).
- Estep, Bill (November 30, 2013). "50 Years of Night: A drug-addled city hits bottom, strives to get clean". Lexington Herald-Leader. Lexington: The McClatchy Company.
- Estep, Bill (November 30, 2013). "Decades of poverty and vote-buying led to widespread corruption in Clay County". Lexington Herald-Leader. Lexington: The McClatchy Company.
External links[]
| show Places adjacent to Clay County, Kentucky |
|---|
| show Municipalities and communities of Clay County, Kentucky, United States |
|---|


Coordinates: 37°10′N 83°43′W / 37.16°N 83.71°W
| show Authority control |
|---|
- Kentucky counties
- Clay County, Kentucky
- 1807 establishments in Kentucky
- Populated places established in 1807
- Counties of Appalachia