Comparison of electoral systems
| Part of the Politics series |
| Electoral systems |
|---|
 |
|
|
Electoral systems are the rules for conducting elections, a main component of which is the algorithm for determining the winner (or several winners) from the ballots cast. This article discusses the justifications which have been offered for different algorithms, both those which elect a unique candidate from a 'single-winner' election and those which elect a group of representatives from a multiwinner election. The choice between the two types of election is a political question not discussed here.
A panel of 22 experts on voting procedures were asked in 2010 to say which of 18 representative single-winner voting methods they endorsed. One member abstained. The ranking (with number N of approvers from a maximum of 21) of the various systems was as follows.[1]
| method | N | method | N | |||
|---|---|---|---|---|---|---|
| 1 | Approval voting | 15 | 10 | Black's method | 3 | |
| 2 | Alternative vote (IRV) | 10 | 11= | Range voting | 2 | |
| 3 | Copeland's method | 9 | Nanson's method | 2 | ||
| 4 | Kemeny–Young method | 8 | 13= | Leximin method | 1 | |
| 5= | Two-round system | 6 | Smith's method | 1 | ||
| Coombs' method | 6 | Uncovered set method | 1 | |||
| 7= | Minimax | 5 | 16= | Fishburn's method | – | |
| Majority judgement | 5 | Untrapped set | – | |||
| 9 | Borda count | 4 | FPTP | – |
Pragmatic considerations[]
The intellectual problem posed by voting theory is that of devising systems which are accurate in a broad sense. However there are many practical reasons why one system of a given accuracy may be more socially acceptable than another. Responsible judges pay as much attention to these factors as to any form of accuracy. See the discussants' comments in Laslier's workshop write-up[1] and two papers by Richard Darlington.[2][3]
The important factors can be grouped under 3 headings:
- Legitimacy. The result of an electoral process may be considered more or less legitimate. A voting system whose result cannot be seen by the average voter to fairly reflect the votes cast may compromise legitimacy.
- Ease of voting. Different forms of ballot make it more or less difficult for voters to fill in ballot papers fairly reflecting their views.
- Ease of counting. Voting systems which can make their decisions from a small set of counts derived from ballots are logistically less burdensome than those which need to consult the entire set of ballots. Some voting systems require powerful computational resources to determine the winner. Even if the cost is not prohibitive for electoral use, it may preclude effective evaluation.
Candidacy effects[]
A separate topic is the fact that different candidates may be encouraged to stand under different voting systems. The fear of wasted votes under FPTP puts a lot of power in the hands of the groups who select candidates. A different voting system might lead to more satisfactory decisions without necessarily being fairer in any abstract sense. This topic has received little analytic study.
Methods of comparing electoral systems[]
There are 3 main types of reasoning which have been used to try to determine the best voting method.
- Argument by example: this is the oldest form of argument.
- Argument from logical criteria: this can be seen as a systematisation of argument by example.
- Empirical argument from simulated elections. This method was not practicable until the development of digital computers in the twentieth century.
Although the use of computer simulations is chronologically the last of these, we shall discuss it first since it introduces concepts which are relevant to the others.
Empirical evaluation by simulation[]
Models of the electoral process[]
Voting methods can be evaluated by measuring their accuracy under random simulated elections aiming to be faithful to the properties of elections in real life.The first such evaluation was conducted by Chamberlin and Cohen in 1978, who measured the frequency with which certain non-Condorcet systems elected Condorcet winners.[4] There are three main types of model which have been proposed as representations of the electoral process, two of which can be combined in a hybrid. A fourth type of model, the utilitarian model, is of conceptual significance in spite of not being used in practice, though spatial models are sometimes presented in utilitarian guise.
Condorcet's jury model[]
The Marquis de Condorcet viewed an election as analogous to a jury vote in which each member expresses an independent judgement. On this account the candidates differ in objective merit and the electors express independent views of the relative merits of the candidates. So long as the voters' judgements are better than random, a sufficiently large electorate will always choose the best candidate. Richard Darlington uses the term 'excellence model' and mentions 'valence model' as an alternative.[2]
The jury model implies a natural concept of accuracy for voting systems: the likelier a system is to elect the best candidate, the better the system. This may be seen as providing a semantics for electoral decisions.
Condorcet and his contemporary Laplace realised that voting theory could thus be reduced to probability theory – Condorcet's main work was titled Essai sur l'application de l'analyse à la probabilité des décisions rendues à la pluralité des voix.[5] Their ideas were revived in the twentieth century when it was shown under a jury model that the Kemeny-Young voting method is the maximum likelihood estimator of the ordering of candidates by merit.[6]
Black's spatial model[]
The main weakness of Condorcet's model is its assumption of independence: it implies that there can be no tendency for voters who prefer A to B to also prefer C to D. This flies in the face of evidence: someone who prefers a certain montagnard to a certain girondin will probably also prefer a second montagnard to a second girondin; it also explains why even arbitrarily large juries are fallible, since members will make common mistakes.
Duncan Black proposed a one-dimensional spatial model of voting in 1948, viewing elections as ideologically driven.[7] His ideas were later expanded by Anthony Downs.[8] Voters' opinions are regarded as positions in a space of one or more dimensions; candidates have positions in the same space; and voters choose candidates in order of proximity (measured under Euclidean distance or some other metric).
Spatial models imply a different notion of merit for voting systems: the more acceptable the winning candidate may be as a location parameter for the voter distribution, the better the system. A political spectrum is a one-dimensional spatial model.
Arrow's neutral model[]
Kenneth Arrow worked within a framework in which the ballots are the ultimate reality rather than 'messages' (in the term of Balinski and Laraki[9] ) conveying partial (and possibly misleading) information about the valuation behind the rankings they comprise. He did not propose this agnosticism as a realistic picture of voting, but rather as defining elections as mathematical objects whose properties could be investigated. His famous Impossibility theorem shows (under certain assumptions) that for any ranked voting system, there exist sets of ballots (obtainable under a neutral model) which violate at least one of three criteria often considered to be desirable.[10]
A neutral model does not bring with it any concept of accuracy or truth for voting systems.
Impartial culture models define distributions of ballots cast under a neutral voting model, treating the electorate as a random noise source.
Hybrid models[]
It is possible to combine jury models with spatial models: it can be assumed that voters are influenced partly by their views of the qualities of candidates and partly by ideological considerations. This breaks their preferences down into separate independent and non-independent components. Hybrid models are discussed briefly by Darlington[2] but have not been widely adopted.
Empirical comparison[]
Tideman and Plassmann conducted a study which showed that a two-dimensional spatial model gave a reasonable fit to 3-candidate reductions of a large set of electoral rankings. Jury and neutral models and one-dimensional spatial models were shown to be inadequate but hybrid models were not considered.[11]
They looked at Condorcet cycles in voter preferences (an example of which is A being preferred to B by a majority of voters, B to C and C to A) and found that the number of them was consistent with small-sample effects, concluding that "voting cycles will occur very rarely, if at all, in elections with many voters".
The relevance of sample size had been studied previously by Gordon Tullock, who argued graphically that although finite electorates will always be prone to cycles, the area in which candidates may give rise to cycling becomes progressively smaller as the number of voters increases.[12]
Utilitarian models[]
A utilitarian model views voters as ranking candidates in order of utility. The rightful winner, under this model, is the candidate who maximises overall social utility. A utilitarian model differs from a spatial model in several important ways:
- It requires the additional assumption that voters are motivated solely by informed self-interest, with no ideological taint to their preferences.
- It requires the distance metric of a spatial model to be replaced by a faithful measure of utility.
- Consequently the metric will need to differ between voters. It often happens that one group of voters will be powerfully affected by the choice between two candidates while another group has little at stake; the metric will then need to be highly asymmetric.
It follows from the last property that no voting system which gives equal influence to all voters is likely to achieve maximum social utility. Extreme cases of conflict between the claims of utilitarianism and democracy are referred to as the 'tyranny of the majority'. See Laslier's, Merlin's and Nurmi's comments in Laslier's write-up.[1]
James Mill seems to have been the first to claim the existence of an a priori connection between democracy and utilitarianism – see the Stanford Encyclopedia article[13] and Macaulay's 'famous attack'.[14]
Comparisons under a jury model[]
Suppose that the i th candidate in an election has merit xi (we may assume that xi ∼ N (0,σ2)), and that voter j 's level of approval for candidate i may be written as xi + εij (we will assume that the εij are iid. N (0,τ2)). We assume that a voter ranks candidates in decreasing order of approval. We may interpret εij as the error in voter j 's valuation of candidate i and regard a voting method as having the task of finding the candidate of greatest merit.
Each voter will rank the better of two candidates higher than the less good with a determinate probability p (which in this case is equal to ). Condorcet's jury theorem shows that so long as p > 1⁄2, the majority vote of a jury will be a better guide to the relative merits of two candidates than is the opinion of any single member.

Peyton Young showed that three further properties apply to votes between artibrary numbers of candidates, suggesting that Condorcet was aware of the first and third of them.[15]
- If p is close to 1⁄2, then the Borda winner is the maximum likelihood estimator of the best candidate.
- if p is close to 1, then the Minimax winner is the maximum likelihood estimator of the best candidate.
- For any p, the Kemeny-Young ranking is the maximum likelihood estimator of the true order of merit.
Robert F. Bordley constructed a 'utilitarian' model which is a slight variant of Condorcet's jury model.[16] He viewed the task of a voting method as that of finding the candidate who has the greatest total approval from the electorate, i.e. the highest sum of individual voters' levels of approval. This model makes sense even with σ2 = 0, in which case p takes the value where n is the number of voters. He performed an evaluation under this model, finding as expected that the Borda count was most accurate.

Simulated elections under spatial models[]
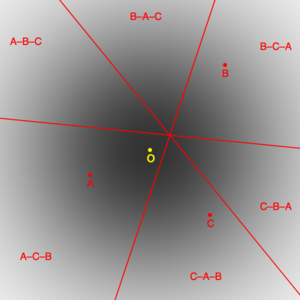
A simulated election can be constructed from a distribution of voters in a suitable space. The illustration shows voters satisfying a bivariate Gaussian distribution centred on O. There are 3 randomly generated candidates, A, B and C. The space is divided into 6 segments by 3 lines, with the voters in each segment having the same candidate preferences. The proportion of voters ordering the candidates in any way is given by the integral of the voter distribution over the associated segment.
The proportions corresponding to the 6 possible orderings of candidates determine the results yielded by different voting systems. Those which elect the best candidate, i.e. the candidate closest to O (who in this case is A), are considered to have given a correct result, and those which elect someone else have exhibited an error. By looking at results for large numbers of randomly generated candidates the empirical properties of voting systems can be measured.
The evaluation protocol outlined here is modelled on the one described by Tideman and Plassmann.[11] Evaluations of this type are commonest for single-winner electoral systems. Ranked voting systems fit most naturally into the framework, but other types of ballot (such a FPTP and Approval voting) can be accommodated with lesser or greater effort.
The evaluation protocol can be varied in a number of ways:
- The number of voters can be made finite and varied in size. In practice this is almost always done in multivariate models, with voters being sampled from their distribution and results for large electorates being used to show limiting behaviour.
- The number of candidates can be varied.
- The voter distribution could be varied; for instance, the effect of asymmetric distributions could be examined. This is seldom if ever done. A minor depararture from normality is entailed by random sampling effects when the number of voters is finite, but systematic departures have not been investigated.
Evaluation for accuracy[]
m method
|
3 | 6 | 10 | 15 | 25 | 40 |
|---|---|---|---|---|---|---|
| FPTP | 70.6 | 35.5 | 21.1 | 14.5 | 9.3 | 6.4 |
| AV/IRV | 85.2 | 50.1 | 31.5 | 21.6 | 12.9 | 7.9 |
| Borda | 87.6 | 82.1 | 74.2 | 67.0 | 58.3 | 50.1 |
| Condorcet | 100.0 | 100.0 | 100.0 | 100.0 | 100.0 | 100.0 |
One of the main uses of evaluations is to compare the accuracy of voting systems when voters vote sincerely. If an infinite number of voters satisfy a Gaussian distribution, then the rightful winner of an election can be taken to be the candidate closest to the mean/median, and the accuracy of a method can be identified with the proportion of elections in which the rightful winner is elected. The median voter theorem guarantees that all Condorcet systems will give 100% accuracy (and the same applies to Coombs' method[17]).
Evaluations published in research papers use multidimensional Gaussians, making the calculation numerically difficult.[4][18][2][3] The number of voters is kept finite and the number of candidates is necessarily small.
The computation is much more straightforward in a single dimension, which allows an infinite number of voters and an arbitrary number m of candidates. Results for this simple case are shown in the first table, which is directly comparable with Table 5 (1000 voters, medium dispersion) of the cited paper by Chamberlin and Cohen. The candidates were sampled randomly from the voter distribution and a single Condorcet method (Minimax) was included in the trials for confirmation.
m method
|
10 |
|---|---|
| FPTP | 0.166 |
| AV/IRV | 0.058 |
| Borda | 0.016 |
| Condorcet | 0.010 |
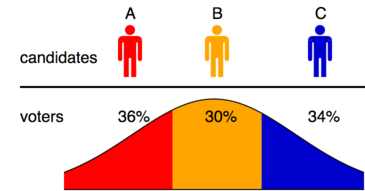
The relatively poor performance of the Alternative vote (IRV) is explained by the well known and common source of error illustrated by the diagram, in which the election satisfies a univariate spatial model and the rightful winner B will be eliminated in the first round. A similar problem exists in all dimensions.
An alternative measure of accuracy is the average distance of voters from the winner (in which smaller means better). This is unlikely to change the ranking of voting methods, but is preferred by people who interpret distance as disutility. The second table shows the average distance (in standard deviations) minus (which is the average distance of a variate from the centre of a standard Gaussian distribution) for 10 candidates under the same model.

Evaluation for resistance to tactical voting[]
James Green-Armytage et al. published a study in which they assessed the vulnerability of several voting systems to manipulation by voters.[19] They say little about how they adapted their evaluation for this purpose, mentioning simply that it 'requires creative programming'. An earlier paper by the first author gives a little more detail.[20]
The number of candidates in their simulated elections was limited to 3. This removes the distinction between certain systems; for instance Black's method and the Dasgupta-Maskin method are equivalent on 3 candidates.
The conclusions from the study are hard to summarise, but the Borda count performed badly; Minimax was somewhat vulnerable; and IRV was highly resistant. The authors showed that limiting any method to elections with no Condorcet winner (choosing the Condorcet winner when there was one) would never increase its susceptibility to tactical voting. They reported that the 'Condorcet-Hare' system which uses IRV as a tie-break for elections not resolved by the Condorcet criterion was as resistant to tactical voting as IRV on its own and more accurate. Condorcet-Hare is equivalent to Copeland's method with an IRV tie-break in elections with 3 candidates.
Evaluation for the effect of the candidate distribution[]
x m
|
0 | 0.25 | 0.5 | 1 | 1.5 |
|---|---|---|---|---|---|
| 3 | 87.6 | 87.9 | 88.9 | 93.0 | 97.4 |
| 6 | 82.1 | 80.2 | 76.2 | 71.9 | 79.9 |
| 10 | 74.1 | 70.1 | 61.2 | 47.6 | 54.1 |
| 15 | 66.9 | 60.6 | 46.4 | 26.6 | 30.8 |
| 25 | 58.3 | 47.0 | 26.3 | 8.1 | 10.1 |
| 40 | 50.2 | 33.3 | 11.3 | 1.5 | 2.1 |
Some systems, and the Borda count in particular, are vulnerable when the distribution of candidates is displaced relative to the distribution of voters. The attached table shows the accuracy of the Borda count (as a percentage) when an infinite population of voters satisfies a univariate Gaussian distribution and m candidates are drawn from a similar distribution offset by x standard distributions. Red colouring indicates figures which are worse than random. Recall that all Condorcet methods give 100% accuracy for this problem. (And notice that the reduction in accuracy as x increases is not seen when there are only 3 candidates.)
Sensitivity to the distribution of candidates can be thought of as a matter either of accuracy or of resistance to manipulation. If one expects that in the course of things candidates will naturally come from the same distribution as voters, then any displacement will be seen as attempted subversion; but if one thinks that factors determining the viability of candidacy (such as financial backing) may be correlated with ideological position, then one will view it more in terms of accuracy.
Published evaluations take different views of the candidate distribution. Some simply assume that candidates are drawn from the same distribution as voters.[2][19] Some older papers assume equal means but allow the candidate distribution to be more or less tight than the voter distribution.[21][4] A paper by Tideman and Plassmann approximates the relationship between candidate and voter distributions based on empirical measurements.[18] This is less realistic than it may appear, since it makes no allowance for the candidate distribution to adjust to exploit any weakness in the voting system. A paper by James Green-Armytage looks at the candidate distribution as a separate issue, viewing it as a form of manipulation and measuring the effects of strategic entry and exit. Unsurprisingly he finds the Borda count to be particularly vulnerable.[20]
Evaluation for other properties[]
- As previously mentioned, Chamberlin and Cohen measured the frequency with which certain non-Condorcet systems elect Condorcet winners. Under a spatial model with equal voter and candidate distributions the frequencies are 99% (Coombs), 86% (Borda), 60% (IRV) and 33% (FPTP).[4] This is sometimes known as Condorcet efficiency.
- Darlington measured the frequency with which Copeland's method produces a unique winner in elections with no Condorcet winner. He found it to be less than 50% for fields of up to 10 candidates.[3]
Experimental metrics[]
The task of a voting system under a spatial model is to identify the candidate whose position most accurately represents the distribution of voter opinions. This amounts to choosing a location parameter for the distribution from the set of alternatives offered by the candidates. Location parameters may be based on the mean, the median, or the mode; but since ranked preference ballots provide only ordinal information, the median is the only acceptable statistic.
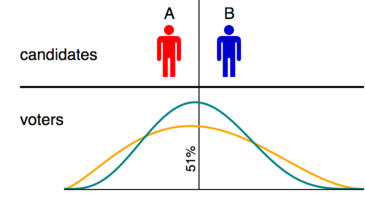
This can be seen from the diagram, which illustrates two simulated elections with the same candidates but different voter distributions. In both cases the mid-point between the candidates is the 51st percentile of the voter distribution; hence 51% of voters prefer A and 49% prefer B. If we consider a voting method to be correct if it elects the candidate closest to the median of the voter population, then since in each case the median is slightly to the left of the 51% line, a voting method will be considered to be correct if it elects A in each case.
The mean of the teal distribution is also slightly to the left of the 51% line, but the mean of the orange distribution is slightly to the right. Hence if we consider a voting method to be correct if it elects the candidate closest to the mean of the voter population, then a method will not be able to obtain full marks unless it produces different winners from the same ballots in the two elections. Clearly this will impute spurious errors to voting methods. The same problem will arise for any cardinal measure of location; only the median gives consistent results.
The median is not defined for multivariate distributions but the univariate median has a property which generalises conveniently. The median of a distribution is the position whose average distance from all points within the distribution is smallest. This definition generalises to the geometric median in multiple dimensions. The distance is sometimes described as a voter's 'disutility' from a candidate's election, but this identification is purely arbitrary.
If we have a set of candidates and a population of voters, then it is not necessary to solve the computationally difficult problem of finding the geometric median of the voters and then identify the candidate closest to it; instead we can identify the candidate whose average distance from the voters is minimised. This is the metric which has been generally deployed since Merrill onwards;[21] see also Green-Armytage and Darlington.[20][2]
The candidate closest to the geometric median of the voter distribution may be termed the 'spatial winner'.
The current state of knowledge[]
The desire to submit voting systems to empirical testing has relied on models which seek to reflect voter behaviour with reasonable accuracy, amongst which spatial models are pre-eminent. The models chosen have logical properties which in many cases allow the most accurate voting methods to be identified a priori. For large symmetric populations in a spatial model the accurate voting systems turn out to be the Condorcet methods (and Coombs'). The logical predictions have been confirmed empirically.
Moreover some Condorcet methods, notably Minimax on its own and Copeland's method with a suitable tie-break, are pragmatically satisfactory. This leaves vulnerability to tactical voting as the outstanding issue. It is a topic which has been investigated in further evaluations, and the superiority of the (non-Concdorcet) IRV has been asserted. However evaluations in this area are hard to perform and have necessitated methodological compromises (such as a limit to 3 candidates). It is not clear what quantitative effect is produced by introducing IRV into a voting system in some way.
Argument by example[]
| Number of voters | Ranking |
|---|---|
| 30 | A-B-C |
| 1 | A-C-B |
| 29 | B-A-C |
| 10 | B-C-A |
| 10 | C-A-B |
| 1 | C-B-A |
There is a long history of trying to prove the superiority of one voting method over another by constructing examples in which the two methods give different answers, it being triumphantly asserted that the first method is right and the second wrong. Since examples can be constructed which are disadvantageous to all methods, this form of reasoning can be inconclusive. An instance occurs above where we illustrate a weakness in IRV by means of a fictitious election in which the rightful winner would be eliminated in the first round.
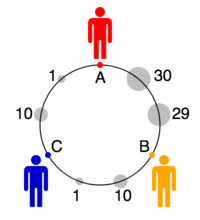
A noted recent instance has been given by Donald Saari.[22] He reanalysed an example given by Condorcet of a hypothetical election between 3 candidates with 81 voters whose preferences are as shown in the first table. The Condorcet winner is A, who is preferred to B by 41:40 and to C by 60:21; but the Borda winner is B. Condorcet concluded that the Borda count was at fault.[23]: 90 Saari argues that the Borda count is right in this case, noting that the voters can be broken down into 3 groups as shown by the second table.
| Number of voters | Ranking |
|---|---|
| 10 | A-B-C |
| 10 | B-C-A |
| 10 | C-A-B |
| 1 | A-C-B |
| 1 | C-B-A |
| 1 | B-A-C |
| 20 | A-B-C |
| 28 | B-A-C |
The pink and blue groups consist of clockwise and anticlockwise cycles which – according to Saari – cancel themselves out, leaving the result to be determined by the white group; and the clear preference of this group (again according to Saari) is for B.
The diagram shows a possible configuration of the voters and candidates consistent with the ballots, with everyone positioned on the circumference of a unit circle. It confirms Saari's judgement, in that A's distance from the average voter is 1.15 whereas B's is 1.09 (and C's is 1.70), making B the spatial winner. But it is only an example. We can imagine holding all positions fixed except for A's, and moving A radially towards the centre of the circle. An infinitessimal step is enough to make A the preference of the cyclical groups, though the white group continues to prefer B. Once A's distance from the centre is less than about 0.89 the overall preference flips from B to A, though the ballots cast would be unchanged.
Thus the election is ambiguous in that equally reasonable spatial representations imply different winners. This is the ambiguity we sought to avoid earlier by adopting a median metric for spatial models; but although the median metric achieves its aim in a single dimension, and generalises attractively to higher dimensions, the property needed to avoid ambiguity does not generalise. In general, cycles may make the spatial winner indeterminate without reference to external facts. The existence of an omnidirectional voter median is a sufficient condition to ensure a determinate result from the ballots cast, and in this case the spatial winner is the Condorcet winner; and unidimensionality of the voter distribution is sufficient for it to have an omnidirectional median.[24]
Saari's example has been influential. Darlington recounts being told by a "reviewer for a very prestigious academic journal" that a similar example shows the Condorcet criterion to be "ridiculous, since a set of votes showing a tie shouldn't change an election's result".[2]
Criteria for single-winner elections[]
Traditionally the merits of different electoral systems have been argued by reference to logical criteria. These have the form of rules of inference for electoral decisions, licensing the deduction, for instance, that "if E and E ' are elections such that R (E,E '), and if A is the rightful winner of E , then A is the rightful winner of E ' ".
The criteria are as debatable as the voting systems themselves. Here we briefly discuss the considerations advanced concerning their validity, and then summarise the most important criteria, showing in a table which of the principal voting systems satisfy them.
Epistemology of voting criteria[]
Arguments from example[]
An example of misbehaviour in a voting system can be generalised to give a criterion which guarantees that no such fault can arise from a system satisfying the criterion, even in more complicated cases. Saari's example gives the (which is satisfied by the Borda count but violated by all Condorcet systems); the example illustrated of IRV eliminating the rightful winner can be generalised as the Condorcet criterion (which is violated by the Borda count).
A more interesting generalisation comes from the class of examples known as 'no-show paradoxes' which can be illustrated from the same diagram. Agreeing that B is the rightful winner, we can hypothesise that under a certain voting system B will indeed be elected if all voters vote sincerely, but that under this system, a single supporter of A can tilt the result towards his preferred candidate by simply abstaining. Most people would agree that this would be an absurd outcome. If we attached importance to it we could generalise it to the Participation criterion, which says that a voter can never help a candidate more by abstaining than by voting.
It is a large step from the example to the criterion. In the example the paradoxical result is simply wrong: B remains the rightful winner when a supporter of A abstains. But when we adopt the Participation criterion, we constrain electoral results in complicated examples in which it is impossible to identify the rightful winner, and with consequences which are hard to predict; this may be more than we bargained for.
The Participation criterion turns out to be surprisingly powerful: it rejects all Condorcet systems while accepting the Borda count. But the no-show paradoxes which arise from Condorcet systems are never examples in which the results are simply wrong, but rather cases in which pairs of results are related in an undesirable way without being determinately right or wrong.
Logical consistency[]
The widely accepted criteria are mutually inconsistent in various groups (the first of them being the group of 3 incompatible criteria identified by Arrow's impossibility theorem). They also contradict all voting systems. Dan Felsenthal described 16 criteria and 18 voting systems and showed "that every one of his 18 systems violates at least six of those criteria".[2]
Result criteria (absolute)[]
We now turn to the logical criteria themselves, starting with the absolute criteria which state that, if the set of ballots is a certain way, a certain candidate must or must not win.
- Majority criterion (MC)
- Will a candidate always win who is ranked as the unique favorite by a majority of voters? This criterion comes in two versions:
- Ranked majority criterion, in which an option which is merely preferred over the others by a majority must win. (Passing the ranked MC is denoted by "yes" in the table below, because it implies also passing the following:)
- Rated majority criterion, in which only an option which is uniquely given a perfect rating by a majority must win. The ranked and rated MC are synonymous for ranked voting methods, but not for rated or graded ones. The ranked MC, but not the rated MC, is incompatible with the IIA criterion explained below.
- Mutual majority criterion (MMC)
- Will a candidate always win who is among a group of candidates ranked above all others by a majority of voters? This also implies the majority loser criterion – if a majority of voters prefers every other candidate over a given candidate, then does that candidate not win? Therefore, of the methods listed, all pass neither or both criteria, except for Borda, which passes Majority Loser while failing Mutual Majority.
- Condorcet criterion
- Will a candidate always win who beats every other candidate in pairwise comparisons? (This implies the majority criterion, above.)
- Condorcet loser criterion (cond. loser)
- Will a candidate never win who loses to every other candidate in pairwise comparisons?
Result criteria (relative)[]
These are criteria that state that, if a certain candidate wins in one circumstance, the same candidate must (or must not) win in a related circumstance.
- Independence of Smith-dominated alternatives (ISDA)
- Does the outcome never change if a Smith-dominated candidate is added or removed (assuming votes regarding the other candidates are unchanged)? Candidate C is Smith-dominated if there is some other candidate A such that C is beaten by A and every candidate B that is not beaten by A etc. Note that although this criterion is classed here as nominee-relative, it has a strong absolute component in excluding Smith-dominated candidates from winning. In fact, it implies all of the absolute criteria above.[specify]
- Independence of irrelevant alternatives (IIA)
- Does the outcome never change if a non-winning candidate is added or removed (assuming voter preferences regarding the other candidates are unchanged)?[25] For instance, plurality rule fails IIA; adding a candidate X can cause the winner to change from W to Y even though Y receives no more votes than before.
- Local independence of irrelevant alternatives (LIIA)
- Does the outcome never change if the alternative that would finish last is removed? (And could the alternative that finishes second fail to become the winner if the winner were removed?)
- Independence of clone alternatives (cloneproof)
- Does the outcome never change if non-winning candidates similar to an existing candidate are added? There are three different phenomena which could cause a method to fail this criterion:
- Spoilers
- Candidates which decrease the chance of any of the similar or clone candidates winning, also known as a spoiler effect.
- Teams
- Sets of similar candidates whose mere presence helps the chances of any of them winning.
- Crowds
- Additional candidates who affect the outcome of an election without either helping or harming the chances of their factional group, but instead affecting another group.
- Monotonicity criterion (monotone)
- If candidate W wins for one set of ballots, will W still always win if those ballots change to rank W higher? (This also implies that you cannot cause a losing candidate to win by ranking them lower.)
- Consistency criterion (CC)
- If candidate W wins for one set of ballots, will W still always win if those ballots change by adding another set of ballots where W also wins?
- Participation criterion (PC)
- Is voting honestly always better than not voting at all? (This is grouped with the distinct but similar Consistency Criterion in the table below.[26])
- Reversal symmetry (reversal)
- If individual preferences of each voter are inverted, does the original winner never win?
Ballot-counting criteria[]
These are criteria which relate to the process of counting votes and determining a winner.
- Polynomial time (polytime)
- Can the winner be calculated in a runtime that is polynomial in the number of candidates and linear in the number of voters?
- Resolvable
- Can the winner be calculated in almost all cases, without using any random processes such as flipping coins? That is, are exact ties, in which the winner could be one of two or more candidates, vanishingly rare in large elections?
- Summability (summable)
- Can the winner be calculated by tallying ballots at each polling station separately and simply adding up the individual tallies? The amount of information necessary for such tallies is expressed as an order function of the number of candidates N. Slower-growing functions such as O(N) or O(N2) make for easier counting, while faster-growing functions such as O(N!) might make it harder to catch fraud by election administrators.[citation needed]
Strategy criteria[]
These are criteria that relate to a voter's incentive to use certain forms of strategy. They could also be considered as relative result criteria; however, unlike the criteria in that section, these criteria are directly relevant to voters; the fact that a method passes these criteria can simplify the process of figuring out one's optimal strategic vote.
- Later-no-harm criterion, and later-no-help criterion
- Can voters be sure that adding a later preference to a ballot will not harm or help any candidate already listed?[27]
- No favorite betrayal (NFB)
- Can voters be sure that they do not need to rank any other candidate above their favorite in order to obtain a result they prefer?[28]
Ballot format[]
These are issues relating to the expressivity or information content of a valid ballot.
- Ballot type
- What information is the voter given on the ballot?
- Equal ranks
- Can a valid ballot express equal support for more than one candidate (and not just equal opposition to more than one)?
- Over 2 ranks
- Can a ballot express more than two levels of support/opposition for different candidates?
Weakness[]
Note on terminology: A criterion is said to be "weaker" than another when it is passed by more voting methods. Frequently, this means that the conditions for the criterion to apply are stronger. For instance, the majority criterion (MC) is weaker than the multiple majority criterion (MMC), because it requires that a single candidate, rather than a group of any size, should win. That is, any method which passes the MMC also passes the MC, but not vice versa; while any required winner under the MC must win under the MMC, but not vice versa.
Compliance of selected single-winner methods[]
The following table shows which of the above criteria are met by several single-winner methods.
| Sort: | ||||||||||||||||||||||
|---|---|---|---|---|---|---|---|---|---|---|---|---|---|---|---|---|---|---|---|---|---|---|
Criterion Method |
Majority | Maj. loser |
Mutual maj. |
Condorcet | Cond. loser |
Smith/ ISDA |
LIIA | IIA | Cloneproof | Monotone | Consistency | Participation | Reversal symmetry |
Polytime/ resolvable |
Summable | Later-no- | No favorite betrayal |
Ballot type |
Ranks | |||
| Harm | Help | = | >2 | |||||||||||||||||||
| Approval | Rated |
No | No | No |
No | No |
Yes | Yes |
Yes |
Yes | Yes | Yes | Yes | O(N) | Yes | O(N) | No | Yes |
Yes | Approvals | Yes | No |
| Borda count | No | Yes | No | No |
Yes | No | No | No | Teams | Yes | Yes | Yes | Yes | O(N) | Yes | O(N) | No | Yes | No | Ranking | Yes | Yes |
| Bucklin | Yes | Yes | Yes | No | No | No | No | No | No | Yes | No | No | No | O(N) | Yes | O(N) | No | Yes | If equal preferences | Ranking | Yes | Yes |
| Copeland | Yes | Yes | Yes | Yes | Yes | Yes | No | No |
Teams, crowds |
Yes | No |
No |
Yes | O(N2) | No | O(N2) | No |
No | No |
Ranking | Yes | Yes |
| IRV (AV) | Yes | Yes | Yes | No |
Yes | No |
No | No | Yes | No | No | No | No | O(N2) | Yes[g] | O(N!) |
Yes | Yes | No | Ranking | No | Yes |
| Kemeny– |
Yes | Yes | Yes | Yes | Yes | Yes | Yes | No |
Spoilers | Yes | No [i] |
No |
Yes | O(N!) | Yes | O(N2) |
No |
No | No |
Ranking | Yes | Yes |
| Highest median/Majority judgment |
Rated |
Yes |
No |
No |
No | No |
Yes | Yes |
Yes | Yes | No |
No |
Depends |
O(N) | Yes | O(N) |
No |
Yes | Yes | Scores |
Yes | Yes |
| Minimax | Yes | No | No | Yes |
No | No | No | No |
Spoilers | Yes | No |
No |
No | O(N2) | Yes | O(N2) | No |
No | No |
Ranking | Yes | Yes |
| Plurality/FPTP | Yes | No | No | No |
No | No |
No | No | Spoilers | Yes | Yes | Yes | No | O(N) | Yes | O(N) | N/A |
N/A |
No | Single mark | N/A | No |
| Score voting | No | No | No | No |
No | No |
Yes | Yes |
Yes | Yes | Yes | Yes | Yes | O(N) | Yes | O(N) | No | Yes | Yes | Scores | Yes | Yes |
| Ranked pairs | Yes | Yes | Yes | Yes | Yes | Yes | Yes | No |
Yes | Yes | No |
No |
Yes | O(N3) | Yes | O(N2) | No |
No | No |
Ranking | Yes | Yes |
| Runoff voting | Yes | Yes | No | No |
Yes | No |
No | No | Spoilers | No | No | No | No | O(N) |
Yes | O(N) |
Yes | Yes |
No | Single mark | N/A | No |
| Schulze | Yes | Yes | Yes | Yes | Yes | Yes | No | No |
Yes | Yes | No |
No |
Yes | O(N3) | Yes | O(N2) | No |
No | No |
Ranking | Yes | Yes |
| STAR voting |
No[z] | Yes | No |
No |
Yes | No |
No | No | No | Yes | No | No | Depends |
O(N) | Yes | O(N2) | No | No | No[ac] | Scores | Yes | Yes |
| Sortition, |
No | No | No | No |
No | No |
Yes | Yes | No | Yes | Yes | Yes | Yes | O(1) | No | O(1) | Yes | Yes | Yes | None | N/A | N/A |
| Random ballot |
No | No | No | No |
No | No |
Yes | Yes | Yes | Yes | Yes | Yes | Yes | O(N) | No | O(N) | Yes | Yes | Yes | Single mark | N/A | No |
This table is not comprehensive. For example, Coombs' method, which satisfies many of the criteria, is not included.
Comparison of multi-winner systems[]
Multi-winner electoral systems seek to produce assemblies which are representative in a broader sense than that of making the same decisions as would be made by single-winner votes. The New Zealand Royal Commission on the Electoral System listed ten criteria for their evaluation of possible new electoral methods for New Zealand. These included fairness between political parties, effective representation of minority[29] or special interest groups, political integration, effective voter participation and legitimacy.
Metrics for multi-winner evaluations[]
Evaluating the performance of multi-winner voting methods requires different metrics than are used for single-winner systems. The following have been proposed.
- Condorcet Committee Efficiency (CCE) measures the likelihood that a group of elected winners would beat all losers in pairwise races.[30]
- Social-Utility Proportionality (SUP) measures the likelihood that each voter has at least one high-utility candidate among the winners.[31]
- Egalitarian-Utility Proportionality (EUP) measures proportionality in terms of the voter with the lowest utility for the closest winning candidate.[31]
- Centrist Tendency (CT) measures the likelihood of a method to elect candidates near the center or extremes of a political spectrum.[31]
Criterion tables[]
Compliance of party-based multi-winner methods[]
Criterion Method |
Proportional in theory | Proportional in practice | Semi-proportional
a majority of voters cannot force the result to be one such that they win all seats |
Not breakable voting method does not have a potential strategic voting feedback loop |
Monotone | Consistency | Participation | Universally Liked Candidates | Are there tiers of members? | Is local representation required? | Is there voter selection of individual candidates? | Ballot Type |
|---|---|---|---|---|---|---|---|---|---|---|---|---|
| General ticket | No | No | No | No – Two-party domination | Yes | Yes | Yes | No | No | No | No — all seats are filled from one pre-determined list | Single mark for one list |
| Closed party-list | Yes | Yes | Yes | Yes (unless few seats or high first seat threshold) | Yes | Yes | Yes | N/A – a universally liked list would have to win all the seats by definition | No | No | No — the ranking of candidates within the party's list determines the order by which the party's seats are filled | Single mark for one list |
| Relatively closed party-list | Yes | Yes | Yes | Yes (unless few seats or high first seat threshold) | Yes | Yes | Yes | N/A – a universally liked list would have to win all the seats by definition | No | No | Yes — a candidate needs to obtain a Hare quota to be guaranteed a seat, otherwise the ranking of candidates within the party's list determines the order by which the party's seats are filled | Single or limited marks for candidates within one list |
| More open party-list | Yes | Yes | Yes | Yes (unless few seats or high first seat threshold) | Yes | Yes | Yes | N/A – a universally liked list would have to win all the seats by definition | No | No | Yes — a candidate needs to obtain a proportion of the votes to be guaranteed a seat, otherwise the ranking of candidates within the party's list determines the order by which the party's seats are filled | Single or limited marks for candidates within one list |
| Most open party-list | Yes | Yes | Yes | Yes (unless few seats or high first seat threshold) | Yes | Yes | Yes | N/A – a universally liked list would have to win all the seats by definition | No | No | Yes — the number of votes every candidate receives determines the order by which the party's seats are filled | Single mark for one candidate within one list |
| Party-list with panachage | Yes | Yes | Yes | Yes (unless few seats or high first seat threshold) | Yes | Yes | Yes | N/A – a universally liked list would have to win all the seats by definition | No | No | Yes — the number of votes every candidate receives determines the order by which the party's seats are filled | Limited marks for candidates within all lists |
| Unmodified Mixed-member proportional | No – strategic voters can manipulate the number of overhang seats | Yes, excluding disproportionalities caused by overhang seats — proportional tier members are selected to compensate for any disproportionality caused by the constituency tier, based on the proportional tier votes only | Yes | No – Overhang manipulation and two-party domination among single winner seats | Yes | No | Yes | Partially — a universally liked list would have to win all the seats in both the proportional and constituency tiers by definition; if all constituency candidates are universally liked, the selection of proportional tier members would be made to compensate for the ensuing disproportionality in overall membership | Yes — constituency tier and proportional tier | Yes — single-member constituencies | Yes — constituency candidates are selected by a single-winner method; selection of proportional tier members may be done by any of the party-list methods mentioned above | Single mark or ranking for one constituency candidate; proportional tier marks depend on the exact method used for selection |
| Best-loser Mixed-member proportional | No – strategic voters can manipulate the number of overhang seats | Yes, excluding disproportionalities caused by overhang seats — proportional tier members are selected to compensate for any disproportionality caused by the constituency tier, based on the party's totals | Yes | No – Overhang manipulation and two-party domination among single winner seats | Yes | No | Yes | No — a universally liked list would have to win all the seats in both the proportional and constituency tiers by definition — since the proportional tier members are drawn from the constituency losers, such a feat is impossible; if all constituency candidates are universally liked, the selection of proportional tier members would be made to compensate for the ensuing disproportionality in overall membership | Yes — constituency tier and proportional tier | Yes — single-member constituencies | Yes — constituency candidates are selected by a single-winner method; proportional tier members are selected by a party-list method | Single mark or ranking for one constituency candidate; proportional tier determined by the constituency tier results |
| Parallel voting | No | No — constituency tier and proportional tier members are selected independently of each other | Yes | No – Two-party domination among single winner seats | Yes | No | Yes | Partially — a universally liked list would have to win all the seats in the proportional tier by definition; if all constituency candidates are universally liked, the selection of proportional tier members would be unaffected | Yes — constituency tier and proportional tier | Yes — single-member constituencies | Yes — constituency candidates are selected by a single-winner method; proportional tier members are selected by a party-list method | Single mark or ranking for one constituency candidate; proportional tier marks depend on the exact method used for selection |
| Scorporo | No – strategic voters can split the ticket to unhinge the compensatory subtraction, thus reverting the election into Parallel voting | Partially — constituency tier and proportional tier members are selected independently of each other, but the constituency winners' votes are subtracted from their respective party lists' totals | Yes | No – decoy lists | No | No | No | Yes — a universally liked list still has the votes of its constituency winners subtracted from its own total, thus ensuring proportional distribution between all the other seats; if all constituency candidates are universally liked, the selection of proportional tier members would be made with their votes subtracted from their parties' totals | Yes — constituency tier and proportional tier | Yes — single-member constituencies | Yes — constituency candidates are selected by a single-winner method; proportional tier members are selected by a party-list method | Single mark or ranking for one constituency candidate; proportional tier marks depend on the exact method used for selection |
| Majority bonus system | Partially – a majority of seats are distributed proportionally between the parties, but the rest are given as a bonus to the most-voted for party; Strategic voters can manipulate this bonus | Partially – a majority of seats are distributed proportionally between the parties, but the rest are given as a bonus to the most-voted for party | Yes | No – Two-party domination among parties competing for bonus | Yes | Yes | Yes | N/A – a universally liked list would have to win all the seats by definition | Yes — proportional tier and bonus tier | No | Not necessarily — selection of proportional tier members may be done by any of the party-list methods mentioned above | Proportional tier marks depend on the exact method used for selection; bonus tier determined by the proportional tier results |
| Majority jackpot system | No — the jackpot is assigned to the most-voted-for party, and the non-jackpot tier seats are distributed proportionally between all others; Strategic voters can manipulate the jackpot | No — the jackpot is assigned to the most-voted-for party, and the non-jackpot tier seats are distributed proportionally between all others | Yes | No – Two-party domination among parties competing for jackpot | No — the party gaining the jackpot gains an advantage over all others; the jackpot turns into a disadvantage for the most-voted-for party if it gained a greater share of seats than the jackpot | Yes | Yes | N/A – a universally liked list would have to win all the seats by definition | Yes — proportional tier and jackpot tier | No | Not necessarily — selection of proportional tier members may be done by any of the party-list methods mentioned above | Proportional tier marks depend on the exact method used for selection; jackpot tier determined by the proportional tier results |
| Dual-member proportional | No – strategic voters can theoretically manipulate the results in secondary seats | Yes | Yes | No – Secondary seat manipulation and two-party domination among primary seats | No | Yes | Yes | Yes | No | Yes — dual-member constituencies | Yes — the candidate with the most votes is guaranteed a seat, and the other is selected from among the best losers | Single mark for one candidate or pair of candidates |
| Rural–urban proportional representation | No – strategic voters can manipulate the number of rural overhang seats | Partially — disproportionalities may be caused by use of STV in urban seats, as well as overhang rural seats — rural proportional tier members are selected to compensate for any disproportionality caused by the rural constituency tier, but no such compensation exists for urban disproportionalities | Yes | No – overhang manipulation and two-party domination among rural single winner seats | No | No | No | Partially — yes in the urban tier; a universally liked rural list would have to win all the seats in the rural proportional tier by definition; if all rural constituency candidates are universally liked, the selection of rural proportional tier members would be made to compensate for the disproportionality; in either case, the selection of urban candidates would be unaffected | Yes — urban tier, rural constituency tier and rural proportional tier | Yes — urban constituencies and single-member rural constituencies | Yes — rural constituency candidates are selected by STV; rural constituency candidates are selected by a single-winner method; rural proportional tier members may be selected by a party-list method or from among the best losers in the rural constituencies | Ranking for urban constituency candidates; single mark or ranking for one rural constituency candidate; rural proportional tier marks depend on the exact method used for selection |
Compliance of non-majoritarian party-agnostic multi-winner methods[]
The following table shows which of the above criteria are met by several multiple winner methods.
This list is incomplete; you can help by . (December 2017) |
Criterion Method |
Proportional | Monotone | Consistency | Warren's Multi-Winner Participation Criterion | No Favorite Betrayal |
Semihonest | Universally Liked Candidates | With Single Winner |
Ballot Type |
|---|---|---|---|---|---|---|---|---|---|
| Monroe's (score voting version) | Yes | Depends on tiebreaker used | Yes | No | No | Approval or Range | Approvals or scores | ||
| Chamberlin-Courant Rule | |||||||||
| Ebert's | Yes | No | Yes | Approval or Range | Approvals or scores | ||||
| Psi | Yes | Yes | Yes | No | No | No | Approval or Range | Approvals or scores | |
| Harmonic | Yes | Yes | Yes | No | No | No | Approval or Range | Approvals or scores | |
| Sequential Proportional Approval | Yes | Yes | No | No | No | No | Approval | Approvals | |
| Re-weighted Range | Yes | Yes | No | No | No | No | Range | Scores | |
| Proportional Approval | Yes | Yes | Yes | No | No | No | Approval | Approvals | |
| Bid voting | Yes | No | No | Yes | Approval or Range | Approvals or scores | |||
| Single Transferable Vote | Yes | No | No | No | No | No | Yes | Instant Runoff | Rankings |
| CPO-STV | Yes | No | No | No | No | No | Yes | A Condorcet method (depends on which one) | Rankings |
| Schulze STV | Yes | Yes | No | No | No | No | Yes | Schulze | Rankings |
| Expanding Approvals Rule | Approval | Approvals | |||||||
| Single non-transferable vote | No | Yes | Yes | Yes | No | No | N/A (not proportional) | Plurality | Single mark |
| Limited vote | No | Yes | Yes | Yes | No[32] | No | N/A (not proportional) | Plurality | Limited marks |
| Cumulative voting | No | Yes | Yes | Yes | No[32] | No | N/A (not proportional) | Plurality | Multiple marks |
| Minmax Approval | Approval | Approvals | |||||||
| Sortition, Arbitrary Winner | No | Yes | Yes | Yes | Yes | Yes | N/A (not proportional) | Sortition, arbitrary winner | None |
| Single Random Ballot | No | Yes | Yes | Yes | Yes | Yes | N/A (not proportional) | Random Ballot | Limited marks |
| Multiple Random Ballots | Approaches | Yes | Yes | Yes | Yes | Yes | N/A (not proportional) | Random Ballot | Limited rankings |
Compliance of majoritarian party-agnostic multi-winner methods[]
The following table shows which of the above criteria are met by several multiple winner methods.
This list is incomplete; you can help by . (July 2019) |
Criterion Method |
Monotone | Consistency | Participation | Cloneproof | No favorite |
Semihonest | Smith set |
Condorcet |
Condorcet |
With single |
Ballot |
|---|---|---|---|---|---|---|---|---|---|---|---|
| Multiple Winner Approval | Yes | Yes | Yes | Yes |
Yes | Yes | No | No | No | Approval | Approvals |
| Multiple Winner Range | Yes | Yes | Yes | Yes | Yes | Yes | No | No | No | Range | Scores |
| Multiple Winner Schulze | Yes | No | No | Yes | No | No | Yes | Yes | Yes | Schulze | Rankings |
| At Large | Yes | Yes | Yes | No
(spoilers) |
No | No | No | No | No | Plurality | Limited marks |
See also[]
- Ranked voting
- Arrow's impossibility theorem
- Cardinal utility and ordinal utility
- Condorcet paradox
Notes[]
- ^ Approval fails the majority criterion because it does not always elect a candidate preferred by over half of voters; however, it always elects the candidate approved by the most voters.
- ^ Jump up to: a b c d e f g h i j k l m n o p q r s t u v w x y z aa ab ac ad ae af ag ah ai aj ak al am an ao ap aq ar Condorcet, Smith and Independence of Smith-dominated alternatives criteria are incompatible with Independence of irrelevant alternatives, Consistency, Participation, Later-no-harm, Later-no-help, and Favorite betrayal[clarification needed] criteria.
- ^ Jump up to: a b c d In Approval, Range, and Majority Judgment, if all voters have perfect information about each other's true preferences and use rational strategy, any Majority Condorcet or Majority winner will be strategically forced – that is, win in all of one or more strong Nash equilibria. In particular if every voter knows that "A or B are the two most-likely to win" and places their "approval threshold" between the two, then the Condorcet winner, if one exists and is in the set {A,B}, will always win. These methods also satisfy the majority criterion in the weaker sense that any majority can force their candidate to win, if it so desires. Laslier, J-F (2006), "Strategic approval voting in a large electorate" (PDF), IDEP Working Papers, Marseille, France (405)
- ^ Jump up to: a b c Approval voting, range voting, and majority judgment satisfy IIA if it is assumed that voters rate candidates individually and independently of knowing the available alternatives in the election, using their own absolute scale. For this to hold, in some elections, some voters must use less than their full voting power or even abstain, despite having meaningful preferences among the available alternatives. If this assumption is not made, these methods fail IIA, as they become more ranked than rated methods.
- ^ Jump up to: a b The original Independence of clones criterion applied only to ranked voting methods. (T. Nicolaus Tideman, "Independence of clones as a criterion for voting rules", Social Choice and Welfare Vol. 4, No. 3 (1987), pp. 185–206.) Tideman notes that "in the spirit of independence of clones", "if there were two or more candidates who were so similar that every voter would rank them as tied if given the chance to rank them [...], then the number of perfect clones present would have no effect on whether the perfect clones were in the set of winning candidates under approval voting". So, Approval Voting satisfies this mathematical criterion by definition. However, there is some disagreement about whether considerations of the voter in the process of making up his vote could be tactically influenced by clones (in a way that a voter would dispossess a candidate of his approval when a clone of him is introduced) and whether the definition of clones have to be extended to these considerations additionally to the handling of actual votes.
- ^ Later-No-Harm and Later-No-Help assert that adding a later preference to a strictly ordered preference ballot should not help or harm an earlier preference. An Approval ballot records approvals but does not record explicit relative (e.g. later) preferences between approvals (while preferences exist from a voter's perspective). Meanwhile, a voter approving a less preferred candidate harms the probability of any other approved candidate winning, but does not help.
- ^ If the number of candidates grows faster than the square root of the number of voters, this may not be the case, as ties at any point in the process, even between two non-viable candidates, could affect the final result. If the rule for resolving such ties involves no randomness, though, the method does pass the criterion.[citation needed]
- ^ The number of piles that can be summed from various precincts is floor ((e−1) N!) − 1.
- ^ Kemeny-Young does not pass the consistency criterion for winner, but the consistency criterion for full rankings, that is, if the electorate is divided in two parts and in both parts Kemeny-Young chooses the same ranking, Kemeny-Young will also choose that ranking for the combined electorate.
- ^ Each prospective Kemeny-Young ordering has score equal to the sum of the pairwise entries that agree with it, and so the best ordering can be found using the pairwise matrix.
- ^ Bucklin voting, with skipped and equal-rankings allowed, meets the same criteria as Majority Judgment; in fact, Majority Judgment may be considered a form of Bucklin voting. Without allowing equal rankings, Bucklin's criteria compliance is worse; in particular, it fails Independence of Irrelevant Alternatives, which for a ranked method like this variant is incompatible with the Majority Criterion.
- ^ Majority Judgment does not always elect a candidate preferred over all others by over half of voters; however, it always elects the candidate uniquely top-rated by over half of voters.
- ^ Majority Judgment may elect a candidate uniquely least-preferred by over half of voters, but it never elects the candidate uniquely bottom-rated by over half of voters.
- ^ Majority Judgment fails the mutual majority criterion, but satisfies the criterion if the majority ranks the mutually favored set above a given absolute grade and all others below that grade.
- ^ Balinski and Laraki, Majority Judgment's inventors, point out that it meets a weaker criterion they call "grade consistency": if two electorates give the same rating for a candidate, then so will the combined electorate. Majority Judgment explicitly requires that ratings be expressed in a "common language", that is, that each rating has an absolute meaning. They claim that this is what makes "grade consistency" significant. Balinski M, MJ; Laraki, R (2007), "A theory of measuring, electing and ranking", Proceedings of the National Academy of Sciences of the United States of America, USA: National Academy of Sciences, 104 (21): 8720–25, Bibcode:2007PNAS..104.8720B, doi:10.1073/pnas.0702634104, PMC 1885569, PMID 17496140
- ^ Jump up to: a b c d e In Majority Judgment, Ranked Pairs, and Schulze voting, there is always a regret-free semi-honest ballot for any voter, holding other ballots constant. That is, if they know enough about how others will vote (for instance, in the case of Majority Judgment, the winning candidate and their winning median score), there is always at least one way for them to participate without grading any less-preferred candidate above any more-preferred one. However, this can cease to hold if voters have insufficient information.
- ^ Majority judgment can actually pass or fail reversal symmetry depending on the rounding method used to find the median when there are even numbers of voters. For instance, in a two-candidate, two-voter race, if the ratings are converted to numbers and the two central ratings are averaged, then MJ meets reversal symmetry; but if the lower one is taken, it does not, because a candidate with ["fair","fair"] would beat a candidate with ["good","poor"] with or without reversal. However, for rounding methods which do not meet reversal symmetry, the odds of breaking it are comparable to the odds of an irresolvable (tied) result; that is, vanishingly small for large numbers of voters.
- ^ Majority Judgment is summable at order KN, where K, the number of ranking categories, is set beforehand.
- ^ Though Majority Judgment does not pass this or similar criteria, there are other similar median methods, such as those based on Bucklin voting, which can meet a related, weaker criterion: ranking an additional candidate below the median grade (rather than your own grade) of your favorite candidate, cannot harm your favorite. Balinski, M., and R. Laraki. "A Theory of Measuring, Electing, and Ranking." Proceedings of the National Academy of Sciences 104, no. 21 (2007): 8720.
- ^ In fact, Majority Judgment ballots use ratings expressed in "common language" rather than numbers, that is, each rating has an absolute meaning.
- ^ Jump up to: a b A variant of Minimax that counts only pairwise opposition, not opposition minus support, fails the Condorcet criterion and meets later-no-harm.
- ^ Jump up to: a b Since plurality does not allow marking later preferences on the ballot at all, it is impossible to either harm or help a favorite candidate by marking later preferences, and so it trivially passes both Later-No-Harm and Later-No-Help. However, because it forces truncation, it shares some problems with methods that merely encourage truncation by failing Later-No-Harm. Similarly, though to a lesser degree, because it doesn't allow voters to distinguish between all but one of the candidates, it shares some problems with methods which fail Later-No-Help, which encourage voters to make such distinctions dishonestly.
- ^ Jump up to: a b Once for each round.
- ^ That is, second-round votes cannot help or harm candidates already eliminated.
- ^ Later preferences are only possible between the two candidates who make it to the second round.
- ^ STAR voting will elect a majority candidate X if X is in the runoff, and X's voters can guarantee they make the runoff by strategically giving the highest score to X and the lowest score to all opponents. However, if there are two or more opponents that get any points from X's voters, these opponents could shut X out of the runoff. Thus, STAR fails the majority criterion.
- ^ As with the majority criterion, STAR voting fails the mutual majority criterion. However, the more candidates are in the mutual majority set, the greater the chance that at least one of them will be in the runoff, and thus be guaranteed to win.
- ^ STAR does not define a full outcome ordering, only a winner. With any number of candidates besides 3, the winner cannot stay the same if the ballots are reversed.
- ^ In STAR voting, in order for favorite betrayal to be strategically advantageous, four separate things must be true: the favorite candidate X must be in the runoff under an honest vote, X must lose the runoff under an honest vote, the betrayal beneficiary Y must not be in the runoff under an honest vote, and the Y must win the runoff under a strategic vote.
- ^ Sortition, uniformly randomly chosen candidate is winner. Arbitrary winner, some external entity, not a voter, chooses the winner. These methods are not, properly speaking, voting methods at all, but are included to show that even a non-voting method can still pass some of the criteria.
- ^ Random ballot, uniformly randomly chosen ballot determines winner. This and closely related methods are of mathematical interest because they are the only possible methods which are truly strategy-free, that is, your best vote will never depend on anything about the other voters. However, this method is not generally considered as a serious proposal for a practical method.
References[]
- ^ Jump up to: a b c J. F Laslier, 'And the Loser is... Plurality Voting' (2011).
- ^ Jump up to: a b c d e f g h R. B. Darlington, 'Are Condorcet and Minimax Voting Systems the Best?' (v8, 2021).
- ^ Jump up to: a b c R. B. Darlington, 'Minimax Is the Best Electoral System After All' (2016).
- ^ Jump up to: a b c d J. R. Chamberlin and M. D. Cohen, 'Toward Applicable Social Choice Theory...', (1978).
- ^ M. J. A. N. de Caritat, Marquis de Condorcet. His book was published in 1785. The title may be translated as 'Essay on the application of probability theory to majority voting'.
- ^ For Condorcet and Laplace see G. G. Szpiro, 'Numbers Rule' (2010).
- ^ Duncan Black, 'On the Rationale of Group Decision-making' (1948).
- ^ Anthony Downs, 'An Economic Theory of Democracy' (1957).'
- ^ M. Balinski and R. Laraki, 'A theory of measuring, electing, and ranking' (2007).
- ^ The theorem was first stated in Arrow's doctoral thesis (1951).
- ^ Jump up to: a b T. N. Tideman and F. Plassmann, 'Modeling the Outcomes of Vote-Casting in Actual Elections' (2012).
- ^ G. Tullock, 'The General Irrelevance of the General Impossibility Theorem' (1967).
- ^ Ball, Terence and Antis Loizides, "James Mill", The Stanford Encyclopedia of Philosophy (Winter 2020 Edition), Edward N. Zalta (ed.).
- ^ T. B. Macaulay, 'Mill on Government' (1829), reprinted in his Miscellaneous Writings.
- ^ H. P. Young, "Condorcet's Theory of Voting" (1988).
- ^ R. F. Bordley, "A Pragmatic Method for Evaluating Election Schemes through Simulation" (1983).
- ^ B. Grofman and S. L. Feld, 'If you like the alternative vote (a.k.a. the instant runoff), then you ought to know about the Coombs rule' (2004).
- ^ Jump up to: a b T. N. Tideman and F. Plassmann, 'Which voting rule is most likely to choose the "best" candidate?' (2012).
- ^ Jump up to: a b J. Green-Armytage, T. N. Tideman and R. Cosman, 'Statistical Evaluation of Voting Rules' (2015).
- ^ Jump up to: a b c J. Green-Armytage, 'Strategic voting and nomination' (2011).
- ^ Jump up to: a b S, Merrill III, 'A Comparison of Efficiency of Multicandidate Electoral Systems' (1984).
- ^ Eric Pacuit, "Voting Methods", The Stanford Encyclopedia of Philosophy (Fall 2019 Edition), Edward N. Zalta (ed.).
- ^ George G. Szpiro, 'Numbers Rule' (2010).
- ^ See Median voter theorem.
- ^ Vasiljev, Sergei (April 1, 2008), Cardinal Voting: The Way to Escape the Social Choice Impossibility, SSRN eLibrary, SSRN 1116545. Note that in practice, voters could change their votes depending on who is in the race (especially in cardinal voting methods). However, this possibility is ignored, because if it were accounted for, no deterministic method could possibly pass this criterion.
- ^ Consistency implies participation, but not vice versa. For example, range voting complies with participation and consistency, but median ratings satisfies participation and fails consistency.
- ^ Woodall, Douglas (December 1994), "Properties of Preferential Election Rules", Voting Matters (3)
- ^ Small, Alex (August 22, 2010), Geometric construction of voting methods that protect voters' first choices, arXiv:1008.4331, Bibcode:2010arXiv1008.4331S
- ^ The ballot limited designation is technically possible only if the members of the majority, dividing their votes, cannot determine, individually, the minority appointment: Buonomo, Giampiero (2001). "L''emicollegio' sceglie il rappresentante di minoranza (o di maggioranza)". Diritto&Giustizia Edizione Online.[dead link]
- ^ Diss, Mostapha; Doghmi, Ahmed (2016). "Multi-winner scoring election methods: Condorcet consistency and paradoxes". Public Choice. 169 (1–2): 97–116. doi:10.1007/s11127-016-0376-x. ISSN 0048-5829. S2CID 73721191.
- ^ Jump up to: a b c Hansen, Jeremy A (2014). "Comparing Approval At-Large to Plurality At-Large in Multi-Member Districts". Conference: Fifth International Workshop on Computational Social Choice.
- ^ Jump up to: a b Amy, Douglas J.; Behind the Ballot Box: A Citizen's Guide to Voting Systems, p. 120 ISBN 0275965864
- Electoral system criteria