Ranked pairs
| Part of the Politics series |
| Electoral systems |
|---|
 |
|
|
Ranked pairs (RP) or the Tideman method is an electoral system developed in 1987 by Nicolaus Tideman that selects a single winner using votes that express preferences.[1][2] RP can also be used to create a sorted list of winners.
If there is a candidate who is preferred over the other candidates, when compared in turn with each of the others, RP guarantees that candidate will win. Because of this property, RP is, by definition, a Condorcet method.
Procedure[]
| w–x–z–y | 7 ballots |
| w–y–x–z | 2 ballots |
| x–y–z–w | 4 ballots |
| x–z–w–y | 5 ballots |
| y–w–x–z | 1 ballots |
| y–z–w–x | 8 ballots |
The RP (Ranked Pair) procedure is as follows:
- Tally the vote count comparing each pair of candidates, and determine the winner of each pair (provided there is not a tie)
- Sort (rank) each pair, by the largest strength of victory first to smallest last.[vs 1]
- "Lock in" each pair, starting with the one with the largest number of winning votes, and add one in turn to a graph as long as they do not create a cycle (which would create an ambiguity). The completed graph shows the winner.
The procedure can be illustrated using a simple example. Suppose that there are 27 voters and 4 candidates w, x, y and z such that the votes are cast as shown in the table of ballots.
Tally[]
| w | x | y | z | |
|---|---|---|---|---|
| w | – | 9 | 1 | –7 |
| x | –9 | – | 5 | 11 |
| y | –1 | –5 | – | 3 |
| z | 7 | –11 | -3 | – |
The vote tally can be expressed as a table in which the (w,x ) entry is the number of ballots in which w comes higher than x minus the number in which x comes higher than w. In the example w comes higher than x in the first two rows and the last two rows of the ballot table (total 18 ballots) while x comes higher than w in the middle two rows (total 9), so the entry in the (w,x ) cell is 18–9 = 9.
Notice the skew symmetry of the table.
| (x,z ) 11 |
(w,x ) 9 |
(z,w ) 7 |
(x,y ) 5 |
(y,z ) 3 |
(w,y ) 1 |
Sort[]
The positive majorities are then sorted in decreasing order of magnitude:
Lock[]
| w | x | y | z | |
|---|---|---|---|---|
| w | 0 | 1 | 0 | 1 |
| x | –1 | 0 | 0 | 1 |
| y | 0 | 0 | 0 | 0 |
| z | –1 | –1 | 0 | 0 |
The next stage is to examine the majorities in turn to determine which pairs to "lock in". This can be done by building up a matrix in which the (x,y ) entry is initially 0, and is set to 1 if we decide that x is preferred to y and to –1 if we decide that y is preferred to x. These preferences are decided by the list of sorted majorities, simply skipping over any which are inconsistent with previous decisions.
The first two majorities tell us that x is preferred to z and w to x, from which it follows by transitivity that w is preferred to z. Once these facts have been incorporated into the table it takes the form as shown after two steps. Notice again the skew symmetry.
| w | x | y | z | |
|---|---|---|---|---|
| w | 0 | 1 | 1 | 1 |
| x | –1 | 0 | 1 | 1 |
| y | –1 | –1 | 0 | 0 |
| z | –1 | –1 | 0 | 0 |
The third majority tells us that z is preferred to w, but since we have already decided that w is preferred to z we ignore it.
The fourth majority tells us that x is preferred to y, and since we know that w is preferred to x we infer that w is preferred to y, giving us the table after 4 steps.
| w | x | y | z | |
|---|---|---|---|---|
| w | 0 | 1 | 1 | 1 |
| x | –1 | 0 | 1 | 1 |
| y | –1 | –1 | 0 | 1 |
| z | –1 | –1 | –1 | 0 |
The fifth majority tells us that y is preferred to z, and this completes the table.
Winner[]
In the resulting graph for the locked pairs, the source corresponds to the winner. In this case w is preferred to all other candidates and is therefore identified as the winner.
Tied majorities[]
In the example the majorities are all different, and this is what will usually happen when the number of voters is large. If ties are unlikely, then it does not matter much how they are resolved, so a random choice can be made. However this is not Tideman's procedure, which is considerably more complicated. See his paper for details.
An example[]
The situation[]
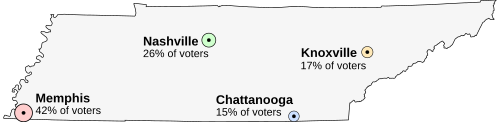
Imagine that Tennessee is having an election on the location of its capital. The population of Tennessee is concentrated around its four major cities, which are spread throughout the state. For this example, suppose that the entire electorate lives in these four cities and that everyone wants to live as near to the capital as possible.
The candidates for the capital are:
- Memphis, the state's largest city, with 42% of the voters, but located far from the other cities
- Nashville, with 26% of the voters, near the center of the state
- Knoxville, with 17% of the voters
- Chattanooga, with 15% of the voters
The preferences of the voters would be divided like this:
| 42% of voters (close to Memphis) |
26% of voters (close to Nashville) |
15% of voters (close to Chattanooga) |
17% of voters (close to Knoxville) |
|---|---|---|---|
|
|
|
|
The results would be tabulated as follows:
| A | |||||
| Memphis | Nashville | Chattanooga | Knoxville | ||
| B | Memphis | [A] 58% [B] 42% |
[A] 58% [B] 42% |
[A] 58% [B] 42% | |
| Nashville | [A] 42% [B] 58% |
[A] 32% [B] 68% |
[A] 32% [B] 68% | ||
| Chattanooga | [A] 42% [B] 58% |
[A] 68% [B] 32% |
[A] 17% [B] 83% | ||
| Knoxville | [A] 42% [B] 58% |
[A] 68% [B] 32% |
[A] 83% [B] 17% |
||
| Pairwise election results (won-lost-tied): | 0-3-0 | 3-0-0 | 2-1-0 | 1-2-0 | |
| Votes against in worst pairwise defeat: | 58% | N/A | 68% | 83% | |
- [A] indicates voters who preferred the candidate listed in the column caption to the candidate listed in the row caption
- [B] indicates voters who preferred the candidate listed in the row caption to the candidate listed in the column caption
Tally[]
First, list every pair, and determine the winner:
| Pair | Winner |
|---|---|
| Memphis (42%) vs. Nashville (58%) | Nashville 58% |
| Memphis (42%) vs. Chattanooga (58%) | Chattanooga 58% |
| Memphis (42%) vs. Knoxville (58%) | Knoxville 58% |
| Nashville (68%) vs. Chattanooga (32%) | Nashville 68% |
| Nashville (68%) vs. Knoxville (32%) | Nashville 68% |
| Chattanooga (83%) vs. Knoxville (17%) | Chattanooga: 83% |
Note that absolute counts of votes can be used, or percentages of the total number of votes; it makes no difference since it is the ratio of votes between two candidates that matters.
Sort[]
The votes are then sorted. The largest majority is "Chattanooga over Knoxville"; 83% of the voters prefer Chattanooga. Thus, the pairs from above would be sorted this way:
| Pair | Winner |
|---|---|
| Chattanooga (83%) vs. Knoxville (17%) | Chattanooga 83% |
| Nashville (68%) vs. Knoxville (32%) | Nashville 68% |
| Nashville (68%) vs. Chattanooga (32%) | Nashville 68% |
| Memphis (42%) vs. Nashville (58%) | Nashville 58% |
| Memphis (42%) vs. Chattanooga (58%) | Chattanooga 58% |
| Memphis (42%) vs. Knoxville (58%) | Knoxville 58% |
Lock[]
The pairs are then locked in order, skipping any pairs that would create a cycle:
- Lock Chattanooga over Knoxville.
- Lock Nashville over Knoxville.
- Lock Nashville over Chattanooga.
- Lock Nashville over Memphis.
- Lock Chattanooga over Memphis.
- Lock Knoxville over Memphis.
In this case, no cycles are created by any of the pairs, so every single one is locked in.
Every "lock in" would add another arrow to the graph showing the relationship between the candidates. Here is the final graph (where arrows point away from the winner).

In this example, Nashville is the winner using RP, followed by Chattanooga, Knoxville, and Memphis in second, third, and fourth places respectively.
Summary[]
In the example election, the winner is Nashville. This would be true for any Condorcet method.
Using the First-past-the-post voting and some other systems, Memphis would have won the election by having the most people, even though Nashville won every simulated pairwise election outright. Using Instant-runoff voting in this example would result in Knoxville winning even though more people preferred Nashville over Knoxville.
Criteria[]
Of the formal voting criteria, the ranked pairs method passes the majority criterion, the monotonicity criterion, the Smith criterion (which implies the Condorcet criterion), the Condorcet loser criterion, and the independence of clones criterion. Ranked pairs fails the consistency criterion and the participation criterion. While ranked pairs is not fully independent of irrelevant alternatives, it still satisfies local independence of irrelevant alternatives.
Independence of irrelevant alternatives[]
Ranked pairs fails independence of irrelevant alternatives. However, the method adheres to a less strict property, sometimes called independence of Smith-dominated alternatives (ISDA). It says that if one candidate (X) wins an election, and a new alternative (Y) is added, X will win the election if Y is not in the Smith set. ISDA implies the Condorcet criterion.
Comparison table[]
The following table compares Ranked Pairs with other preferential single-winner election methods:
| System | Monotonic | Condorcet winner | Majority | Condorcet loser | Majority loser | Mutual majority | Smith | ISDA | LIIA | Independence of clones | Reversal symmetry | Participation, consistency | Later-no‑harm | Later-no‑help | Polynomial time | Resolvability |
|---|---|---|---|---|---|---|---|---|---|---|---|---|---|---|---|---|
| Schulze | Yes | Yes | Yes | Yes | Yes | Yes | Yes | Yes | No | Yes | Yes | No | No | No | Yes | Yes |
| Ranked pairs | Yes | Yes | Yes | Yes | Yes | Yes | Yes | Yes | Yes | Yes | Yes | No | No | No | Yes | Yes |
| Tideman's Alternative | No | Yes | Yes | Yes | Yes | Yes | Yes | Yes | No | Yes | No | No | No | No | Yes | Yes |
| Kemeny–Young | Yes | Yes | Yes | Yes | Yes | Yes | Yes | Yes | Yes | No | Yes | No | No | No | No | Yes |
| Copeland | Yes | Yes | Yes | Yes | Yes | Yes | Yes | Yes | No | No | Yes | No | No | No | Yes | No |
| Nanson | No | Yes | Yes | Yes | Yes | Yes | Yes | No | No | No | Yes | No | No | No | Yes | Yes |
| Black | Yes | Yes | Yes | Yes | Yes | No | No | No | No | No | Yes | No | No | No | Yes | Yes |
| Instant-runoff voting | No | No | Yes | Yes | Yes | Yes | No | No | No | Yes | No | No | Yes | Yes | Yes | Yes |
| Smith/IRV | No | Yes | Yes | Yes | Yes | Yes | Yes | Yes | No | Yes | No | No | No | No | Yes | Yes |
| Borda | Yes | No | No | Yes | Yes | No | No | No | No | No | Yes | Yes | No | Yes | Yes | Yes |
| Baldwin | No | Yes | Yes | Yes | Yes | Yes | Yes | No | No | No | No | No | No | No | Yes | Yes |
| Bucklin | Yes | No | Yes | No | Yes | Yes | No | No | No | No | No | No | No | Yes | Yes | Yes |
| Plurality | Yes | No | Yes | No | No | No | No | No | No | No | No | Yes | Yes | Yes | Yes | Yes |
| Contingent voting | No | No | Yes | Yes | Yes | No | No | No | No | No | No | No | Yes | Yes | Yes | Yes |
| Coombs[3] | No | No | Yes | Yes | Yes | Yes | No | No | No | No | No | No | No | No | Yes | Yes |
| MiniMax | Yes | Yes | Yes | No | No | No | No | No | No | No | No | No | No | No | Yes | Yes |
| Anti-plurality[3] | Yes | No | No | No | Yes | No | No | No | No | No | No | Yes | No | No | Yes | Yes |
| Sri Lankan contingent voting | No | No | Yes | No | No | No | No | No | No | No | No | No | Yes | Yes | Yes | Yes |
| Supplementary voting | No | No | Yes | No | No | No | No | No | No | No | No | No | Yes | Yes | Yes | Yes |
| Dodgson[3] | No | Yes | Yes | No | No | No | No | No | No | No | No | No | No | No | No | Yes |
Notes[]
- ^ In fact, there are different ways how the strength of a victory is measured. This article uses Tideman's orignal method based on margins of victory.
References[]
- ^ Tideman, T. N. (1987-09-01). "Independence of clones as a criterion for voting rules". Social Choice and Welfare. 4 (3): 185–206. doi:10.1007/BF00433944. ISSN 1432-217X.
- ^ Schulze, Markus (October 2003). "A New Monotonic and Clone-Independent Single-Winner Election Method". Voting matters (www.votingmatters.org.uk). McDougall Trust. 17. Archived from the original on 2020-07-11. Retrieved 2021-02-02.
- ^ a b c Anti-plurality, Coombs and Dodgson are assumed to receive truncated preferences by apportioning possible rankings of unlisted alternatives equally; for example, ballot A > B = C is counted as A > B > C and A > C > B. If these methods are assumed not to receive truncated preferences, then later-no-harm and later-no-help are not applicable.

External links[]
- Descriptions of ranked-ballot voting methods by Rob LeGrand
- Example JS implementation by Asaf Haddad
- Pair Ranking Ruby Gem by Bala Paranj
- A margin-based PHP Implementation of Tideman's Ranked Pairs
- Electoral systems
- Monotonic Condorcet methods
- Single-winner electoral systems