Daventry (UK Parliament constituency)
| Daventry | |
|---|---|
| County constituency for the House of Commons | |
 Boundary of Daventry in Northamptonshire | |
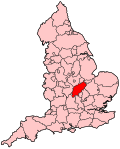 Location of Northamptonshire within England | |
| County | Northamptonshire |
| Electorate | 74,674 (2018)[1] |
| Major settlements | Daventry, Earls Barton, Brixworth |
| Current constituency | |
| Created | 1974 |
| Member of Parliament | Chris Heaton-Harris (Conservative) |
| Number of members | One |
| Created from | South Northamptonshire |
| 1918–1950 | |
| Replaced by | South Northamptonshire |
| Created from | South Northamptonshire and Mid Northamptonshire |
Daventry is a constituency[n 1] represented in the House of Commons of the UK Parliament since 2010 by Chris Heaton-Harris of the Conservative Party.
History[]
The seat, one of many created in 1918, was a narrower form of the oldest creation of South Northamptonshire and lasted 32 years until it reverted into "South Northamptonshire". Finally today's seat was recreated mostly from the north of the South Northants seat[n 2] in 1974. Since its recreation and during its first existence it has been served by Conservative MPs. As the 1997 majority was also not marginal, it has been to date an archetypal safe seat.
Boundaries[]

1918–1950: The Boroughs of Daventry and Brackley, the Rural Districts of Brackley, Crick, Daventry, Hardingstone, Middleton Cheney, Potterspury, and Towcester, and part of the Rural District of Northampton.
1974–1983: The Boroughs of Daventry and Brackley, and the Rural Districts of Brackley, Brixworth, Daventry, Northampton, and Towcester.
1983–1997: The District of Daventry wards of Abbey North, Abbey South, Badby, Barby, Brampton, Braunston, Byfield, Crick and West Haddon, Drayton, Everdon, Flore, Guilsborough, Hill, Kilsby, Long Buckby, Ravensthorpe, Spratton, Weedon, Welford, Woodford, and Yelvertoft, and the District of South Northamptonshire wards of Astwell, Blakesley, Brackley East, Brackley West, Cosgrove, Danvers, Deanshanger, Forest, Grafton, Greatworth, King's Sutton, Kingthorn, Middleton Cheney, Potterspury, Rainsborough, Slapton, Tove, Towcester, and Wardoun.
1997–2010: The District of Daventry wards of Abbey North, Abbey South, Badby, Barby, Brampton, Braunston, Byfield, Crick and West Haddon, Drayton, Everdon, Flore, Hill, Kilsby, Long Buckby, Ravensthorpe, Weedon, Woodford, and Yelvertoft, and the District of South Northamptonshire wards of Astwell, Blakesley, Blisworth, Brackley East, Brackley West, Bugbrooke, Cosgrove, Danvers, Deanshanger, Forest, Gayton, Grafton, Greatworth, Heyford, King's Sutton, Kingthorn, Middleton Cheney, Potterspury, Rainsborough, Slapton, Tove, Towcester, and Wardoun.
2010–present: The District of Daventry, the District of South Northamptonshire wards of Cote, Downs, Grange, Harpole, and Heyford, and the Borough of Wellingborough wards of Earls Barton and West.
The constituency covers the west of Northamptonshire and is named for the market town of Daventry. It covers the western part of Daventry and South Northamptonshire local government districts.
Members of Parliament[]
MPs 1918–1950[]
| Election | Member[2] | Party | |
|---|---|---|---|
| 1918 | Edward FitzRoy | Conservative | |
| 1928 | Speaker | ||
| 1943 by-election | Reginald Manningham-Buller | Conservative | |
| 1950 | constituency abolished | ||
MPs since Feb 1974[]
| Election | Member[2] | Party | |
|---|---|---|---|
| Feb 1974 | Arthur Jones | Conservative | |
| 1979 | Reg Prentice | Conservative | |
| 1987 | Tim Boswell | Conservative | |
| 2010 | Chris Heaton-Harris | Conservative | |
Elections[]
Elections in the 2010s[]
| Party | Candidate | Votes | % | ±% | |
|---|---|---|---|---|---|
| Conservative | Chris Heaton-Harris | 37,055 | 64.6 | +0.9 | |
| Labour | Paul Joyce | 10,975 | 19.1 | -5.6 | |
| Liberal Democrats | Andrew Simpson | 7,032 | 12.3 | +5.1 | |
| Green | Clare Slater | 2,341 | 4.1 | +2.4 | |
| Majority | 26,080 | 45.4 | +6.5 | ||
| Turnout | 57,403 | 74.1 | +0.1 | ||
| Conservative hold | Swing | +3.2 | |||
| Party | Candidate | Votes | % | ±% | |
|---|---|---|---|---|---|
| Conservative | Chris Heaton-Harris[5] | 35,464 | 63.7 | +5.5 | |
| Labour | Aiden Ramsey | 13,730 | 24.7 | +6.6 | |
| Liberal Democrats | Andrew Simpson | 4,015 | 7.2 | +2.7 | |
| UKIP | Ian Gibbins | 1,497 | 2.7 | -13.1 | |
| Green | Jamie Wildman | 957 | 1.7 | -1.8 | |
| Majority | 21,734 | 39.0 | -1.1 | ||
| Turnout | 55,663 | 74.0 | +1.8 | ||
| Conservative hold | Swing | -0.55 | |||
| Party | Candidate | Votes | % | ±% | |
|---|---|---|---|---|---|
| Conservative | Chris Heaton-Harris[5] | 30,550 | 58.2 | +1.7 | |
| Labour | Abigail Campbell[7] | 9,491 | 18.1 | +2.3 | |
| UKIP | Michael Gerard[8] | 8,296 | 15.8 | +11.3 | |
| Liberal Democrats | Callum Delhoy[9] | 2,352 | 4.5 | -14.9 | |
| Green | Steve Whiffen | 1,829 | 3.5 | +2.0 | |
| Majority | 21,059 | 40.1 | +3.0 | ||
| Turnout | 52,518 | 72.2 | -0.3 | ||
| Conservative hold | Swing | ||||
UKIP originally selected Nigel Wickens,[10] who was also selected for Mid Bedfordshire.
| Party | Candidate | Votes | % | ±% | |
|---|---|---|---|---|---|
| Conservative | Chris Heaton-Harris | 29,252 | 56.5 | +3.5 | |
| Liberal Democrats | Christopher McGlynn[14] | 10,064 | 19.4 | +4.9 | |
| Labour | Paul Corazzo | 8,168 | 15.8 | −12.1 | |
| UKIP | Jim Broomfield | 2,333 | 4.5 | +1.6 | |
| English Democrat | Alan Bennett-Spencer | 1,187 | 2.3 | New | |
| Green | Steve Whiffen | 770 | 1.5 | New | |
| Majority | 19,188 | 37.1 | +12.8 | ||
| Turnout | 51,774 | 72.5 | +4.6 | ||
| Conservative hold | Swing | −0.7 | |||
After the 2005 general election, Daventry incurred massive boundary changes following the creation of the new South Northamptonshire seat. The results of the 2010 general election are based on the notional results for the new boundaries.
Elections in the 2000s[]
| Party | Candidate | Votes | % | ±% | |
|---|---|---|---|---|---|
| Conservative | Tim Boswell | 31,206 | 51.6 | +2.4 | |
| Labour | Andrew Hammond | 16,520 | 27.3 | −4.9 | |
| Liberal Democrats | Hannah Saul | 9,964 | 16.5 | +0.4 | |
| UKIP | Barry Mahoney | 1,927 | 3.2 | +0.8 | |
| Veritas | Barrie Wilkins | 822 | 1.4 | New | |
| Majority | 14,686 | 24.3 | +7.3 | ||
| Turnout | 60,439 | 68.1 | +2.6 | ||
| Conservative hold | Swing | +3.6 | |||
| Party | Candidate | Votes | % | ±% | |
|---|---|---|---|---|---|
| Conservative | Tim Boswell | 27,911 | 49.2 | +2.9 | |
| Labour | Kevin Quigley | 18,262 | 32.2 | -2.2 | |
| Liberal Democrats | Jamie Calder | 9,130 | 16.1 | +1.1 | |
| UKIP | Peter Baden | 1,381 | 2.4 | +1.7 | |
| Majority | 9,649 | 17.0 | +5.1 | ||
| Turnout | 56,684 | 65.5 | -11.5 | ||
| Conservative hold | Swing | +2.6 | |||
Elections in the 1990s[]
| Party | Candidate | Votes | % | ±% | |
|---|---|---|---|---|---|
| Conservative | Tim Boswell | 28,615 | 46.3 | −11.4 | |
| Labour | Ken Ritchie | 21,237 | 34.4 | +10.5 | |
| Liberal Democrats | John Gordon | 9,233 | 15.0 | −2.7 | |
| Referendum | Barbara Russocki | 2,018 | 3.3 | New | |
| UKIP | B.J. Mahoney | 443 | 0.7 | New | |
| Natural Law | Russell B. France | 204 | 0.3 | −0.4 | |
| Majority | 7,378 | 11.9 | -21.9 | ||
| Turnout | 61,750 | 77.0 | |||
| Conservative hold | Swing | −11.1 | |||
| Party | Candidate | Votes | % | ±% | |
|---|---|---|---|---|---|
| Conservative | Tim Boswell | 34,734 | 58.4 | +0.5 | |
| Labour | Lesley Koumi | 14,460 | 24.3 | +3.8 | |
| Liberal Democrats | Anthony S. Rounthwaite | 9,820 | 16.5 | −5.0 | |
| Natural Law | Russell B. France | 422 | 0.7 | New | |
| Majority | 20,274 | 34.1 | −2.3 | ||
| Turnout | 59,436 | 82.7 | +4.6 | ||
| Conservative hold | Swing | −1.7 | |||
Elections in the 1980s[]
| Party | Candidate | Votes | % | ±% | |
|---|---|---|---|---|---|
| Conservative | Tim Boswell | 31,353 | 57.94 | ||
| Liberal | Ian Miller | 11,663 | 21.55 | ||
| Labour | Lesley Koumi | 11,097 | 20.51 | ||
| Majority | 19,690 | 36.39 | |||
| Turnout | 54,113 | 78.15 | |||
| Conservative hold | Swing | ||||
| Party | Candidate | Votes | % | ±% | |
|---|---|---|---|---|---|
| Conservative | Reg Prentice | 26,357 | 53.33 | ||
| SDP | D Collins | 13,221 | 26.75 | New | |
| Labour | D Middleton | 9,840 | 19.91 | ||
| Majority | 13,136 | 26.58 | |||
| Turnout | 49,418 | 76.84 | |||
| Conservative hold | Swing | ||||
Elections in the 1970s[]
| Party | Candidate | Votes | % | ±% | |
|---|---|---|---|---|---|
| Conservative | Reg Prentice | 41,422 | 56.61 | ||
| Labour | JL Rawlings | 19,939 | 27.25 | ||
| Liberal | R Woodside | 11,286 | 15.42 | ||
| National Front | G Younger | 522 | 0.71 | New | |
| Majority | 21,483 | 29.36 | |||
| Turnout | 73,169 | 80.50 | |||
| Conservative hold | Swing | ||||
| Party | Candidate | Votes | % | ±% | |
|---|---|---|---|---|---|
| Conservative | Arthur Jones | 29,801 | 46.43 | ||
| Labour | D Forwood | 20,739 | 32.31 | ||
| Liberal | D Cassidy | 13,640 | 21.25 | ||
| Majority | 9,062 | 14.12 | |||
| Turnout | 64,180 | 77.09 | |||
| Conservative hold | Swing | ||||
| Party | Candidate | Votes | % | ±% | |
|---|---|---|---|---|---|
| Conservative | Arthur Jones | 31,273 | 44.93 | ||
| Labour | P Jones | 21,524 | 30.93 | ||
| Liberal | P Smout | 16,802 | 24.14 | ||
| Majority | 9,749 | 14.00 | |||
| Turnout | 69,599 | 84.33 | |||
| Conservative win (new seat) | |||||
Elections in the 1940s[]
| Party | Candidate | Votes | % | ±% | |
|---|---|---|---|---|---|
| Conservative | Reginald Manningham-Buller | 14,863 | 42.8 | New | |
| Labour | Paul F Williams | 13,693 | 39.5 | +3.2 | |
| Liberal | William George Ernest Dyer | 6,130 | 17.7 | N/A | |
| Majority | 1,170 | 3.3 | -24.1 | ||
| Turnout | 34,686 | 75.0 | -1.0 | ||
| Conservative hold | Swing | N/A | |||
| Party | Candidate | Votes | % | ±% | |
|---|---|---|---|---|---|
| Conservative | Reginald Manningham-Buller | 9,043 | 45.9 | -17.8 | |
| Common Wealth | Dennis G Webb | 6,591 | 33.4 | New | |
| Independent Liberal | William George Ernest Dyer | 4,093 | 20.7 | New | |
| Majority | 2,452 | 12.5 | -14.9 | ||
| Turnout | 19,727 | 48.7 | -27.3 | ||
| Conservative hold | Swing | N/A | |||
General Election 1939–40:
Another General Election was required to take place before the end of 1940. The political parties had been making preparations for an election to take place from 1939 and by the end of this year, the following candidates had been selected;
- Speaker: Edward FitzRoy
- Labour: Paul F Williams
Elections in the 1930s[]
| Party | Candidate | Votes | % | ±% | |
|---|---|---|---|---|---|
| Speaker | Edward FitzRoy | 18,934 | 63.7 | N/A | |
| Labour | TE Barnes | 10,767 | 36.3 | New | |
| Majority | 8,167 | 27.4 | N/A | ||
| Turnout | 29,701 | 76.0 | N/A | ||
| Speaker hold | Swing | N/A | |||
| Party | Candidate | Votes | % | ±% | |
|---|---|---|---|---|---|
| Speaker | Edward FitzRoy | Unopposed | N/A | N/A | |
| Speaker hold | |||||
Elections in the 1920s[]
| Party | Candidate | Votes | % | ±% | |
|---|---|---|---|---|---|
| Speaker | Edward FitzRoy | Unopposed | N/A | N/A | |
| Speaker hold | |||||
| Party | Candidate | Votes | % | ±% | |
|---|---|---|---|---|---|
| Unionist | Edward FitzRoy | 12,683 | 50.4 | +5.7 | |
| Liberal | Charles Kerr | 12,483 | 49.6 | +11.8 | |
| Majority | 200 | 0.8 | -6.1 | ||
| Turnout | 25,166 | 79.7 | +3.6 | ||
| Unionist hold | Swing | -3.1 | |||
| Party | Candidate | Votes | % | ±% | |
|---|---|---|---|---|---|
| Unionist | Edward FitzRoy | 10,514 | 44.7 | -14.9 | |
| Liberal | Charles Kerr | 8,914 | 37.8 | New | |
| Labour | Len Smith | 4,127 | 17.5 | -22.9 | |
| Majority | 1,600 | 6.9 | -12.3 | ||
| Turnout | 23,555 | 76.1 | +4.0 | ||
| Unionist hold | Swing | N/A | |||
| Party | Candidate | Votes | % | ±% | |
|---|---|---|---|---|---|
| Unionist | Edward FitzRoy | 13,055 | 59.6 | +0.8 | |
| Labour | Will Rogers | 8,850 | 40.4 | -0.8 | |
| Majority | 4,205 | 19.2 | +1.6 | ||
| Turnout | 21,905 | 72.1 | +9.4 | ||
| Unionist hold | Swing | +0.8 | |||
Elections in the 1910s[]
| Party | Candidate | Votes | % | ±% | |
|---|---|---|---|---|---|
| C | Unionist | Edward FitzRoy | 11,176 | 58.8 | |
| Labour | Will Rogers | 7,824 | 41.2 | ||
| Majority | 3,352 | 17.6 | |||
| Turnout | 19,000 | 62.7 | |||
| Unionist win (new seat) | |||||
| C indicates candidate endorsed by the coalition government. | |||||
Notes[]
References[]
- ^ "England Parliamentary electorates 2010-2018". Boundary Commission for England. Retrieved 23 March 2019.
- ^ a b Leigh Rayment's Historical List of MPs – Constituencies beginning with "D" (part 1)
- ^ "Daventry Parliamentary constituency". BBC News. BBC. Retrieved 20 November 2019.
- ^ a b "Daventry parliamentary constituency - Election 2017" – via www.bbc.co.uk.
- ^ a b "UK ELECTION RESULTS: DAVENTRY 2015".
- ^ "Election Data 2015". Electoral Calculus. Archived from the original on 17 October 2015. Retrieved 17 October 2015.
- ^ "Abigail Campbell". Archived from the original on 2015-04-19.
- ^ "Archived copy". Archived from the original on 2015-04-02. Retrieved 2015-03-07.
{{cite web}}: CS1 maint: archived copy as title (link) - ^ "Your Next MP | Blog Pemilihan Umum di Inggris".
- ^ "New candidate chosen by UKIP". www.daventryexpress.co.uk.
- ^ "Election Data 2010". Electoral Calculus. Archived from the original on 26 July 2013. Retrieved 17 October 2015.
- ^ Statement of Persons Nominated[permanent dead link], Daventry District Council
- ^ Daventry, BBC
- ^ Northampton Chronicle & Echo 21 April 2010
- ^ "Election Data 2005". Electoral Calculus. Archived from the original on 15 October 2011. Retrieved 18 October 2015.
- ^ "Election Data 2001". Electoral Calculus. Archived from the original on 15 October 2011. Retrieved 18 October 2015.
- ^ "Election Data 1997". Electoral Calculus. Archived from the original on 15 October 2011. Retrieved 18 October 2015.
- ^ "Election Data 1992". Electoral Calculus. Archived from the original on 15 October 2011. Retrieved 18 October 2015.
- ^ "Politics Resources". Election 1992. Politics Resources. 9 April 1992. Archived from the original on 24 July 2011. Retrieved 2010-12-06.
- ^ "Election Data 1987". Electoral Calculus. Archived from the original on 15 October 2011. Retrieved 18 October 2015.
- ^ "Election Data 1983". Electoral Calculus. Archived from the original on 15 October 2011. Retrieved 18 October 2015.
- ^ a b c d e f g h i British Parliamentary Election Results 1918-1949, FWS Craig
- ^ The Liberal Year Book, 1930
- ^ Debretts House of Commons & Judicial Bench 1922
See also[]
Coordinates: 52°18′N 1°05′W / 52.30°N 1.08°W
| Authority control |
|---|
- Parliamentary constituencies in Northamptonshire
- Constituencies of the Parliament of the United Kingdom disestablished in 1950
- Constituencies of the Parliament of the United Kingdom established in 1918
- Constituencies of the Parliament of the United Kingdom established in 1974