Wellingborough (UK Parliament constituency)
| Wellingborough | |
|---|---|
| County constituency for the House of Commons | |
 Boundary of Wellingborough in Northamptonshire | |
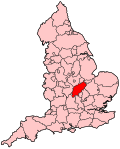 Location of Northamptonshire within England | |
| County | Northamptonshire |
| Electorate | 78,313 (2018)[1] |
| Major settlements | Wellingborough, Rushden, Higham Ferrers and Irchester |
| Current constituency | |
| Created | 1918 |
| Member of Parliament | Peter Bone (Conservative) |
| Created from | East Northamptonshire and North Northamptonshire |
Wellingborough is a constituency[n 1] represented in the House of Commons of the UK Parliament since 2005 by Peter Bone, a Conservative.[n 2]
History[]
This seat was created under the Representation of the People Act 1918.
- Political history
Wellingborough's earliest years were left-leaning. Between 1964 and 2005, the seat has kept on producing examples of bellwether results and rarely showed itself to be safe for more than one government term. Departing from this are two years where the result has defied the most common result nationwide, by leaning towards the Conservative Party, in 1974 (twice). Since 2010 it has become a safe seat for the conservatives.
In the 2016 EU referendum, Wellingborough voted 62.4% leave (25,679 votes) to 37.6% remain (15,462 votes)[2]
- Prominent frontbenchers
Sir Geoffrey Shakespeare was a Lloyd-Georgist National Liberal who served in junior minister roles through much of World War II including, briefly as the Secretary for Overseas Trade in 1940.
The lack of other senior positions is assisted by no majority having been gained by the winner which is in national terms generally shown to be insurmountable, see marginal seat.
Boundaries[]
1918–1950: The Borough of Higham Ferrers, the Urban Districts of Finedon, Irthlingborough, Raunds, Rushden, and Wellingborough, the Rural District of Wellingborough, and in the Rural District of Thrapston the parishes of Chelveston cum Caldecott, Hargrave, and Stanwick.
1950–1974: The Borough of Higham Ferrers, the Urban Districts of Irthlingborough, Raunds, Rushden, and Wellingborough, the Rural District of Wellingborough, and in the Rural District of Oundle and Thrapston the civil parishes of Chelveston cum Caldecott and Hargrave.
1974–1983: The Borough of Higham Ferrers, the Urban Districts of Irthlingborough, Oundle, Raunds, Rushden, and Wellingborough, and the Rural Districts of Oundle and Thrapston, and Wellingborough.
1983–2010: The Borough of Wellingborough, and the District of East Northamptonshire wards of Higham Ferrers, Rushden East, Rushden North, Rushden South, and Rushden West.
2010–present: The Borough of Wellingborough wards of Brickhill, Castle, Croyland, Finedon, Great Doddington and Wilby, Hemmingwell, Irchester, North, Queensway, Redwell East, Redwell West, South, Swanspool, and Wollaston, and the District of East Northamptonshire wards of Higham Ferrers, Rushden East, Rushden North, Rushden South, and Rushden West.
The constituency is named after the town of Wellingborough and covers most of the Borough of Wellingborough local government district. The constituency also includes Rushden (a broad town) and Higham Ferrers, a small town in the neighbouring local government district of East Northamptonshire.
Higham Ferrers was itself a former borough constituency until its abolition as one of the rotten boroughs in 1832.
Constituency profile[]
Strengths in local industries here or in neighbouring Northampton and Kettering include in printing, logistics and distribution, automotive (assembly and design), construction, food processing and advanced engineering sectors. Despite this a decline in the traditional local industries such as quarrying, furniture making and textiles pushes workless claimants who were registered jobseekers in November 2012 higher than the national (and regional) average of 3.8%, at 4.5% of the population based on a statistical compilation by The Guardian.[3]
Members of Parliament[]
| Election | Member[4] | Party | |
|---|---|---|---|
| 1918 | Walter Smith | Labour | |
| 1922 | Geoffrey Shakespeare | National Liberal | |
| 1923 | William Cove | Labour | |
| 1929 | George Dallas | Labour | |
| 1931 | Archibald James | Conservative | |
| 1945 | George Lindgren | Labour | |
| 1959 | Michael Hamilton | Conservative | |
| 1964 | Harry Howarth | Labour | |
| 1969 by-election | Peter Fry | Conservative | |
| 1997 | Paul Stinchcombe | Labour | |
| 2005 | Peter Bone | Conservative | |
Elections[]
Elections in the 2010s[]
| Party | Candidate | Votes | % | ±% | |
|---|---|---|---|---|---|
| Conservative | Peter Bone | 32,277 | 62.2 | +4.8 | |
| Labour | Andrea Watts | 13,737 | 26.5 | -7.5 | |
| Liberal Democrats | Suzanna Austin | 4,078 | 7.9 | +4.6 | |
| Green | Marion Turner-Hawes | 1,821 | 3.5 | +1.7 | |
| Majority | 18,540 | 35.7 | +12.3 | ||
| Turnout | 51,913 | 64.3 | -2.9 | ||
| Conservative hold | Swing | +6.15 | |||
| Party | Candidate | Votes | % | ±% | |
|---|---|---|---|---|---|
| Conservative | Peter Bone | 30,579 | 57.4 | +5.3 | |
| Labour | Andrea Watts | 18,119 | 34.0 | +14.5 | |
| UKIP | Alan Shipham | 1,804 | 3.4 | −16.2 | |
| Liberal Democrats | Chris Nelson | 1,782 | 3.3 | −1.1 | |
| Green | Jonathan Hornett | 956 | 1.8 | −2.6 | |
| Majority | 12,460 | 23.4 | −9.1 | ||
| Turnout | 53,240 | 67.2 | +1.8 | ||
| Conservative hold | Swing | -4.55 | |||
| Party | Candidate | Votes | % | ±% | |
|---|---|---|---|---|---|
| Conservative | Peter Bone | 26,265 | 52.1 | +3.9 | |
| UKIP | Jonathan Munday[10] | 9,868 | 19.6 | +16.4 | |
| Labour | Richard Garvie1 | 9,839 | 19.5 | -5.9 | |
| Liberal Democrats | Chris Nelson | 2,240 | 4.4 | -12.7 | |
| Green | Marion-Turner-Hawes | 2,218 | 4.4 | +3.5 | |
| Majority | 16,397 | 32.5 | +9.7 | ||
| Turnout | 50,430 | 65.4 | -1.8 | ||
| Conservative hold | Swing | -6.3 | |||
1: After nominations were closed, Garvie was suspended from the Labour Party after he was convicted of fraud after buying £900 of train tickets with a closed bank account.[11] He still appeared on ballot papers as Labour.
| Party | Candidate | Votes | % | ±% | |
|---|---|---|---|---|---|
| Conservative | Peter Bone | 24,918 | 48.2 | +5.5 | |
| Labour | Jayne Buckland | 13,131 | 25.4 | -16.0 | |
| Liberal Democrats | Kevin Barron | 8,848 | 17.1 | +5.6 | |
| UKIP | Adrian Haynes | 1,636 | 3.2 | +0.9 | |
| BNP | Rob Walker | 1,596 | 3.1 | New | |
| English Democrat | Terry Spencer | 530 | 1.0 | New | |
| Green | Jonathan Hornett | 480 | 0.9 | New | |
| TUSC | Paul Crofts | 249 | 0.5 | New | |
| Independent | Gary Donaldson | 240 | 0.5 | New | |
| Independent | Marcus Lavin | 33 | 0.1 | New | |
| Majority | 11,787 | 22.8 | +21.5 | ||
| Turnout | 51,661 | 67.2 | +1.4 | ||
| Conservative hold | Swing | +10.8 | |||
Elections in the 2000s[]
| Party | Candidate | Votes | % | ±% | |
|---|---|---|---|---|---|
| Conservative | Peter Bone | 22,674 | 42.8 | +0.6 | |
| Labour | Paul Stinchcombe | 21,987 | 41.5 | −5.3 | |
| Liberal Democrats | Richard Church | 6,147 | 11.6 | +2.3 | |
| UKIP | James Wrench | 1,214 | 2.3 | +0.6 | |
| Veritas | Nicholas Alex | 749 | 1.4 | New | |
| Socialist Labour | Andy Dickson | 234 | 0.4 | New | |
| Majority | 687 | 1.3 | N/A | ||
| Turnout | 53,005 | 66.5 | +2.4 | ||
| Conservative gain from Labour | Swing | +2.9 | |||
| Party | Candidate | Votes | % | ±% | |
|---|---|---|---|---|---|
| Labour | Paul Stinchcombe | 23,867 | 46.8 | +2.6 | |
| Conservative | Peter Bone | 21,512 | 42.2 | -1.6 | |
| Liberal Democrats | Peter Gaskell | 4,763 | 9.3 | -0.1 | |
| UKIP | Tony Ellwood | 864 | 1.7 | -0.4 | |
| Majority | 2,355 | 4.6 | +4.2 | ||
| Turnout | 51,006 | 64.1 | -10.7 | ||
| Labour hold | Swing | +2.1 | |||
Elections in the 1990s[]
| Party | Candidate | Votes | % | ±% | |
|---|---|---|---|---|---|
| Labour | Paul Stinchcombe | 24,854 | 44.2 | +10.3 | |
| Conservative | Peter Fry | 24,667 | 43.8 | −9.6 | |
| Liberal Democrats | Peter Smith | 5,279 | 9.4 | −3.4 | |
| UKIP | Tony Ellwood | 1,192 | 2.1 | New | |
| Natural Law | Annie Lorys | 297 | 0.5 | New | |
| Majority | 187 | 0.4 | N/A | ||
| Turnout | 56,289 | 74.8 | -7.1 | ||
| Labour gain from Conservative | Swing | +9.9 | |||
| Party | Candidate | Votes | % | ±% | |
|---|---|---|---|---|---|
| Conservative | Peter Fry | 32,302 | 53.4 | +0.7 | |
| Labour | Phil Sawford | 20,486 | 33.9 | +6.7 | |
| Liberal Democrats | Julie Trevor | 7,714 | 12.8 | -7.3 | |
| Majority | 11,816 | 19.5 | -6.0 | ||
| Turnout | 60,502 | 81.9 | |||
| Conservative hold | Swing | −3.0 | |||
Elections in the 1980s[]
| Party | Candidate | Votes | % | ±% | |
|---|---|---|---|---|---|
| Conservative | Peter Fry | 29,038 | 52.7 | +3.8 | |
| Labour | James Currie | 14,968 | 27.2 | +1.2 | |
| Liberal | Leslie Stringer | 11,047 | 20.1 | −4.6 | |
| Majority | 14,070 | 25.5 | +2.6 | ||
| Turnout | 55,053 | ||||
| Conservative hold | Swing | +1.3 | |||
| Party | Candidate | Votes | % | ±% | |
|---|---|---|---|---|---|
| Conservative | Peter Fry | 25,715 | 48.9 | -3.4 | |
| Labour | John H. Mann | 13,659 | 26.0 | -8.9 | |
| Liberal | L.E. Stringer | 12,994 | 24.7 | +12.9 | |
| Independent | D.M.P. Garnett | 228 | 0.4 | +0.1 | |
| Majority | 12,056 | 22.9 | +5.5 | ||
| Turnout | 52,596 | ||||
| Conservative hold | Swing | +2.8 | |||
Elections in the 1970s[]
| Party | Candidate | Votes | % | ±% | |
|---|---|---|---|---|---|
| Conservative | Peter Fry | 37,812 | 52.3 | +9.5 | |
| Labour | D.A. Forwood | 25,278 | 34.9 | -5.3 | |
| Liberal | L.E. Stringer | 8,506 | 11.8 | -5.2 | |
| National Front | S.F. Wright | 529 | 0.7 | New | |
| Independent | D.M.P. Garnett | 228 | 0.3 | New | |
| Majority | 12,534 | 17.4 | +14.8 | ||
| Turnout | 72,353 | 81.25 | +1.6 | ||
| Conservative hold | Swing | +7.4 | |||
| Party | Candidate | Votes | % | ±% | |
|---|---|---|---|---|---|
| Conservative | Peter Fry | 29,078 | 42.8 | +2.3 | |
| Labour | John H. Mann | 27,320 | 40.2 | +2.9 | |
| Liberal | Penelope Jessel | 11,500 | 17.0 | -3.9 | |
| Majority | 1,758 | 2.6 | -0.6 | ||
| Turnout | 67,898 | 79.61 | -5.39 | ||
| Conservative hold | Swing | -0.3 | |||
| Party | Candidate | Votes | % | ±% | |
|---|---|---|---|---|---|
| Conservative | Peter Fry | 29,099 | 40.5 | -11.7 | |
| Labour | John H. Mann | 26,829 | 37.3 | -10.5 | |
| Liberal | Penelope Jessel | 15,049 | 20.9 | New | |
| Ind. Conservative | D.T. James | 897 | 1.2 | New | |
| Majority | 2,720 | 3.2 | -1.3 | ||
| Turnout | 71,874 | 85.00 | -1.34 | ||
| Conservative hold | Swing | -0.6 | |||
| Party | Candidate | Votes | % | ±% | |
|---|---|---|---|---|---|
| Conservative | Peter Fry | 27,459 | 52.2 | +4.6 | |
| Labour | John H. Mann | 25,107 | 47.8 | -4.6 | |
| Majority | 2,352 | 4.4 | N/A | ||
| Turnout | 52,566 | 81.34 | -5.12 | ||
| Conservative gain from Labour | Swing | +4.6 | |||
Elections in the 1960s[]
| Party | Candidate | Votes | % | ±% | |
|---|---|---|---|---|---|
| Conservative | Peter Fry | 22,548 | 54.4 | +6.8 | |
| Labour | John H. Mann | 16,499 | 39.8 | -7.8 | |
| Independent | M.P. Coney | 2,421 | 5.8 | New | |
| Majority | 6,049 | 14.6 | N/A | ||
| Turnout | 41,468 | ||||
| Conservative gain from Labour | Swing | +7.3 | |||
| Party | Candidate | Votes | % | ±% | |
|---|---|---|---|---|---|
| Labour | Harry Howarth | 24,705 | 52.4 | +10.1 | |
| Conservative | John Lawson Leatham | 22,472 | 47.6 | +5.4 | |
| Majority | 2,233 | 4.8 | +4.7 | ||
| Turnout | 54,566 | 86.46 | -0.6 | ||
| Labour hold | Swing | ||||
| Party | Candidate | Votes | % | ±% | |
|---|---|---|---|---|---|
| Labour | Harry Howarth | 19,592 | 42.26 | -7.17 | |
| Conservative | Michael Hamilton | 19,545 | 42.16 | -8.51 | |
| Liberal | Philip Arthur John Pettit | 7,227 | 15.59 | New | |
| Majority | 47 | 0.10 | N/A | ||
| Turnout | 46,364 | 87.11 | |||
| Labour gain from Conservative | Swing | ||||
Elections in the 1950s[]
| Party | Candidate | Votes | % | ±% | |
|---|---|---|---|---|---|
| Conservative | Michael Hamilton | 22,964 | 50.67 | +1.61 | |
| Labour | George Lindgren | 22,358 | 49.33 | -1.61 | |
| Majority | 606 | 1.34 | N/A | ||
| Turnout | 45,322 | 86.72 | |||
| Conservative gain from Labour | Swing | +1.61 | |||
| Party | Candidate | Votes | % | ±% | |
|---|---|---|---|---|---|
| Labour | George Lindgren | 22,745 | 51.04 | -1.35 | |
| Conservative | Arthur Jones | 21,819 | 48.96 | +1.35 | |
| Majority | 926 | 2.08 | |||
| Turnout | 44,564 | 86.01 | |||
| Labour hold | Swing | -1.35 | |||
| Party | Candidate | Votes | % | ±% | |
|---|---|---|---|---|---|
| Labour | George Lindgren | 24,113 | 52.39 | +5.29 | |
| Conservative | F Richard Parsons | 21,912 | 47.61 | +19.15 | |
| Majority | 2,201 | 4.78 | |||
| Turnout | 46,025 | 88.38 | |||
| Labour hold | Swing | ||||
| Party | Candidate | Votes | % | ±% | |
|---|---|---|---|---|---|
| Labour | George Lindgren | 21,640 | 47.10 | -10.61 | |
| Conservative | Jaspar Carlisle Sayer | 13,075 | 28.46 | -13.83 | |
| Liberal | Edwin Malindine | 11,227 | 24.44 | New | |
| Majority | 8,565 | 18.64 | |||
| Turnout | 45,942 | 89.51 | |||
| Labour hold | Swing | ||||
Elections in the 1940s[]
| Party | Candidate | Votes | % | ±% | |
|---|---|---|---|---|---|
| Labour | George Lindgren | 22,416 | 57.71 | ||
| Conservative | Archibald James | 16,426 | 42.29 | ||
| Majority | 5,990 | 15.42 | N/A | ||
| Turnout | 38,842 | 74.39 | |||
| Labour gain from Conservative | Swing | ||||
Elections in the 1930s[]
| Party | Candidate | Votes | % | ±% | |
|---|---|---|---|---|---|
| Conservative | Archibald James | 18,085 | 50.52 | ||
| Labour | George Dallas | 17,713 | 49.48 | ||
| Majority | 372 | 1.04 | |||
| Turnout | 35,798 | 77.26 | |||
| Conservative hold | Swing | ||||
| Party | Candidate | Votes | % | ±% | |
|---|---|---|---|---|---|
| Conservative | Archibald James | 22,127 | 61.02 | ||
| Labour | George Dallas | 14,137 | 38.98 | ||
| Majority | 7,990 | 22.04 | N/A | ||
| Turnout | 36,264 | 81.24 | |||
| Conservative gain from Labour | Swing | ||||
Elections in the 1920s[]

| Party | Candidate | Votes | % | ±% | |
|---|---|---|---|---|---|
| Labour | George Dallas | 15,300 | 42.2 | +2.2 | |
| Liberal | Richard Pattinson Winfrey | 11,255 | 31.0 | +2.2 | |
| Unionist | Archibald James | 9,703 | 26.8 | -4.4 | |
| Majority | 4,045 | 11.2 | +2.4 | ||
| Turnout | 36,258 | 83.3 | -0.7 | ||
| Registered electors | 43,548 | ||||
| Labour hold | Swing | +0.0 | |||
| Party | Candidate | Votes | % | ±% | |
|---|---|---|---|---|---|
| Labour | William Cove | 11,381 | 40.0 | −2.1 | |
| Unionist | Ralph A Raphael | 8,900 | 31.2 | +5.8 | |
| Liberal | Humphrey Mackworth Paul | 8,223 | 28.8 | −3.7 | |
| Majority | 2,481 | 8.8 | −0.8 | ||
| Turnout | 28,504 | 84.0 | +4.1 | ||
| Registered electors | 33,934 | ||||
| Labour hold | Swing | −4.0 | |||
| Party | Candidate | Votes | % | ±% | |
|---|---|---|---|---|---|
| Labour | William Cove | 11,175 | 42.1 | -0.3 | |
| Liberal | Geoffrey Shakespeare | 8,638 | 32.5 | -25.1 | |
| Unionist | Robert Massy-Dawson Sanders | 6,747 | 25.4 | New | |
| Majority | 2,537 | 9.6 | N/A | ||
| Turnout | 26,560 | 79.9 | +0.5 | ||
| Registered electors | 33,226 | ||||
| Labour gain from Liberal | Swing | +12.4 | |||
| Party | Candidate | Votes | % | ±% | |
|---|---|---|---|---|---|
| National Liberal | Geoffrey Shakespeare | 14,995 | 57.6 | +10.1 | |
| Labour | Walter Smith | 11,057 | 42.4 | −8.1 | |
| Majority | 3,938 | 15.2 | N/A | ||
| Turnout | 26,052 | 79.4 | +17.5 | ||
| Registered electors | 32,820 | ||||
| National Liberal gain from Labour | Swing | N/A | |||
Elections in the 1910s[]
| Party | Candidate | Votes | % | ±% | |
|---|---|---|---|---|---|
| Labour | Walter Smith | 10,290 | 52.5 | ||
| C | Liberal | Milner Gray | 9,313 | 47.5 | |
| Majority | 977 | 5.0 | |||
| Turnout | 19,603 | 61.9 | |||
| Registered electors | 31,669 | ||||
| Labour win (new seat) | |||||
| C indicates candidate endorsed by the coalition government. | |||||
See also[]
Notes[]
- ^ A county constituency (for the purposes of election expenses and type of returning officer)
- ^ As with all constituencies, the constituency elects one Member of Parliament (MP) by the first past the post system of election at least every five years.
References[]
- ^ "England Parliamentary electorates 2010-2018". Boundary Commission for England. Retrieved 23 March 2019.
- ^ "EU Referendum local results - W". BBC News.
- ^ Unemployment claimants by constituency The Guardian
- ^ Leigh Rayment's Historical List of MPs – Constituencies beginning with "W" (part 2)
- ^ "Wellingborough Parliamentary constituency". BBC News. BBC. Retrieved 22 November 2019.
- ^ a b "Election Data 2010". Electoral Calculus. Archived from the original on 26 July 2013. Retrieved 17 October 2015.
- ^ a b Wellingborough BBC News | Election 2010
- ^ "Election Data 2015". Electoral Calculus. Archived from the original on 17 October 2015. Retrieved 17 October 2015.
- ^ "Election 2015:Wellingborough Parliamentary constituency". BBC News. Retrieved 13 May 2015.
- ^ "UK Polling Report".
- ^ Francesca Gosling. "Labour's candidate for Wellingborough and Rushden Richard Garvie suspended after conviction for fraud". Nothampton Chronicle & Echo.
- ^ "Election Data 2005". Electoral Calculus. Archived from the original on 15 October 2011. Retrieved 18 October 2015.
- ^ "Election Data 2001". Electoral Calculus. Archived from the original on 15 October 2011. Retrieved 18 October 2015.
- ^ "Election Data 1997". Electoral Calculus. Archived from the original on 15 October 2011. Retrieved 18 October 2015.
- ^ "Election Data 1992". Electoral Calculus. Archived from the original on 15 October 2011. Retrieved 18 October 2015.
- ^ "Election Data 1987". Electoral Calculus. Archived from the original on 15 October 2011. Retrieved 18 October 2015.
- ^ "Election Data 1983". Electoral Calculus. Archived from the original on 15 October 2011. Retrieved 18 October 2015.
- ^ a b c d e Craig, F. W. S. (1983). British parliamentary election results 1918-1949 (3 ed.). Chichester: Parliamentary Research Services. ISBN 0-900178-06-X.
Sources[]
| Settlements | 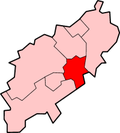 | |
|---|---|---|
| Places of interest |
| |
| Constituencies | ||
| Sport |
| |
| Transport | ||
| Education |
| |
| ||
| Authority control |
|---|

- Parliamentary constituencies in Northamptonshire
- Constituencies of the Parliament of the United Kingdom established in 1918
- Wellingborough
- Rushden