List of Parliamentary constituencies in the East Midlands (region)
The region[1] of East Midlands is divided into 46 parliamentary constituencies which is made up of 12 Borough Constituencies and 34 County Constituencies. Since the General Election of December 2019,[2] 38 are represented by Conservative MPs, 7 by Labour MPs, and 1 by an independent MP.
Constituencies[]
† Conservative ‡ Labour Independent
| Constituency[nb 1] | Electorate[3] | Majority[4][nb 2] | Member of Parliament[4] | Nearest opposition[4] | County | County Location | Constituency Map | ||
|---|---|---|---|---|---|---|---|---|---|
| Amber Valley CC | 69,976 | 16,886 | Nigel Mills† | Adam Thompson‡ | Derbyshire | 
|
 | ||
| Ashfield CC | 78,204 | 5,733 | Lee Anderson† | Jason Zadrozny (Ashfield Independents) | Nottinghamshire | 
|
 | ||
| Bassetlaw CC | 80,024 | 14,013 | Brendan Clarke-Smith† | Keir Morrison‡ | Nottinghamshire |
|
 | ||
| Bolsover CC | 75,161 | 5,299 | Mark Fletcher† | Dennis Skinner‡ | Derbyshire |
|
 | ||
| Boston and Skegness CC | 69,381 | 25,621 | Matt Warman† | Ben Cook‡ | Lincolnshire | 
|
 | ||
| Bosworth CC | 81,542 | 26,278 | Luke Evans† | Rick Middleton‡ | Leicestershire | 
|
 | ||
| Broxtowe CC | 73,052 | 5,331 | Darren Henry† | Greg Marshall‡ | Nottinghamshire |
|
 | ||
| Charnwood CC | 79,534 | 22,397 | Edward Argar† | Gary Godden‡ | Leicestershire |
|
 | ||
| Chesterfield BC | 71,034 | 1,451 | Toby Perkins‡ | Spencer Pitfield† | Derbyshire |
|
 | ||
| Corby CC | 86,153 | 10,268 | Tom Pursglove† | Beth Miller‡ | Northamptonshire | 
|
 | ||
| Daventry CC | 77,423 | 26,080 | Chris Heaton-Harris† | Pal Joyce‡ | Northamptonshire |
|
 | ||
| Derby North BC | 73,199 | 2,540 | Amanda Solloway† | Tony Tinley‡ | Derbyshire |
|
 | ||
| Derby South BC | 73,062 | 6,019 | Margaret Beckett‡ | Ed Barker† | Derbyshire |
|
 | ||
| Derbyshire Dales CC | 65,080 | 17,381 | Sarah Dines† | Claire Raw‡ | Derbyshire |
|
 | ||
| Erewash CC | 72,995 | 10,606 | Maggie Throup† | Catherine Atkinson‡ | Derbyshire |
|
 | ||
| Gainsborough CC | 76,343 | 22,967 | Sir Edward Leigh† | Perry Smith‡ | Lincolnshire |
|
 | ||
| Gedling CC | 71,366 | 679 | Tom Randall† | Vernon Coaker‡ | Nottinghamshire |
|
 | ||
| Grantham and Stamford CC | 81,502 | 26,003 | Gareth Davies† | Kathryn Salt‡ | Lincolnshire |
|
 | ||
| Harborough CC | 80,151 | 12,429 | Neil O'Brien† | Celia Hibbert‡ | Leicestershire |
|
 | ||
| High Peak CC | 74,265 | 590 | Robert Largan† | Ruth George‡ | Derbyshire |
|
 | ||
| Kettering CC | 73,164 | 16,765 | Philip Hollobone† | Claire Pavitt‡ | Northamptonshire |
|
 | ||
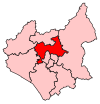
| Leicester East BC | 78,433 | 6,019 | Claudia Webbe[nb 3] | Bhupendra Dave† | Leicestershire |
|
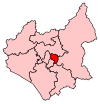 | ||
| Leicester South BC | 77,708 | 22,675 | Jon Ashworth‡ | Natalie Neale† | Leicestershire |
|
 | ||
| Leicester West BC | 64,940 | 4,212 | Liz Kendall‡ | Amanda Wright† | Leicestershire |
|
 | ||
| Lincoln BC | 74,942 | 3,514 | Karl McCartney† | Karen Lee‡ | Lincolnshire |
|
 | ||
| Louth and Horncastle CC | 79,634 | 28,668 | Victoria Atkins† | Ellie Green‡ | Lincolnshire |
|
 | ||
| Loughborough CC | 79,764 | 7,169 | Jane Hunt† | Stuart Brady‡ | Leicestershire |
|
 | ||
| Mansfield CC | 77,131 | 16,306 | Ben Bradley† | Sonya Ward‡ | Nottinghamshire |
|
 | ||
| Mid Derbyshire CC | 67,442 | 11,616 | Pauline Latham† | Emma Monkman‡ | Derbyshire |
|
 | ||
| Newark CC | 75,850 | 21,816 | Robert Jenrick† | James Baggaley‡ | Nottinghamshire |
|
 | ||
| North East Derbyshire CC | 72,345 | 12,876 | Lee Rowley† | Chris Peace‡ | Derbyshire |
|
 | ||
| North West Leicestershire CC | 78,935 | 20,400 | Andrew Bridgen† | Terri Eynon‡ | Leicestershire |
|
 | ||
| Northampton North BC | 58,768 | 5,507 | Michael Ellis† | Sally Keeble‡ | Northamptonshire |
|
 | ||
| Northampton South BC | 62,163 | 4,697 | Andrew Lewer† | Gareth Eales‡ | Northamptonshire |
|
 | ||
| Nottingham East BC | 66,262 | 17,393 | Nadia Whittome‡ | Victoria Stapleton† | Nottinghamshire |
|
 | ||
| Nottingham North BC | 66,495 | 4,490 | Alex Norris‡ | Staurt Beswick† | Nottinghamshire |
|
 | ||
| Nottingham South BC | 79,485 | 12,568 | Lilian Greenwood‡ | Marc Nykolyszyn† | Nottinghamshire |
|
 | ||
| Rushcliffe CC | 77,047 | 7,643 | Ruth Edwards† | Cheryl Pidgeon‡ | Nottinghamshire |
|
 | ||
| Rutland and Melton CC | 82,705 | 26,924 | Alicia Kearns† | Andy Thomas‡ | Leicestershire and Rutland |
|
 | ||
| Sherwood CC | 77,888 | 16,186 | Mark Spencer† | Jerry Hague‡ | Nottinghamshire |
|
 | ||
| Sleaford and North Hykeham CC | 94,761 | 32,565 | Dr Caroline Johnson† | Linda Edwards-Shea‡ | Lincolnshire |
|
 | ||
| South Derbyshire CC | 79,331 | 19,335 | Heather Wheeler† | Robert Pearson‡ | Derbyshire |
|
 | ||
| South Holland and The Deepings CC | 75,975 | 30,838 | John Hayes† | Mark Popple‡ | Lincolnshire |
|
 | ||
| South Leicestershire CC | 80,520 | 24,004 | Alberto Costa† | Tristan Koriya‡ | Leicestershire |
|
 | ||
| South Northamptonshire CC | 90,842 | 27,761 | Andrea Leadsom† | Gen Kitchen‡ | Northamptonshire |
|
 | ||
| Wellingborough CC | 80,765 | 18,550 | Peter Bone† | Andrea Watts‡ | Northamptonshire |
|
 | ||
Proposed boundary changes[]
See 2023 Periodic Review of Westminster constituencies for further details.
Following the abandonment of the Sixth Periodic Review (the 2018 review), the Boundary Commission for England formally launched the 2023 Review on 5 January 2021 and published their initial proposals on 8 June.[5] The Commission calculated that the number of seats to be allocated to the East Midlands region will increase by one, from 46 to 47.
The following seats are proposed:[6]
| Constituency | Electorate | Ceremonial County | Local authority |
|---|---|---|---|
| Amber Valley CC | 70,625 | Derbyshire | Amber Valley |
| Ashfield CC | 71,703 | Nottinghamshire | Ashfield / Mansfield |
| 76,041 | Leicestershire | Blaby / Oadby and Wigston | |
| Bolsover CC | 74,680 | Derbyshire | Bolsover / North East Derbyshire |
| Boston and Skegness CC | 71,680 | Lincolnshire | Boston / East Lindsey |
| Broxtowe CC | 72,461 | Nottinghamshire | Broxtowe |
| Chesterfield BC | 70,722 | Derbyshire | Chesterfield |
| Corby and East Northamptonshire CC | 76,706 | Northamptonshire | North Northamptonshire |
| Daventry CC | 76,539 | Northamptonshire | North Northamptonshire / West Northamptonshire |
| Derby North BC | 71,876 | Derbyshire | Derby |
| Derby South BC | 72,067 | Derbyshire | Derby |
| Derbyshire Dales CC | 71,435 | Derbyshire | Amber Valley / Derbyshire Dales / South Derbyshire |
| Gainsborough CC | 74,750 | Lincolnshire | West Lindsey |
| Gedling CC | 75,795 | Nottinghamshire | Gedling |
| Grantham CC | 72,071 | Lincolnshire | North Kesteven / South Kesteven |
| Harborough CC | 71,190 | Leicestershire | Harborough |
| High Peak CC | 73,960 | Derbyshire | High Peak |
| 75,683 | Leicestershire | Hinckley and Bosworth / North West Leicestershire | |
| 71,986 | Derbyshire | Erewash | |
| Kettering CC | 76,354 | Northamptonshire | North Northamptonshire |
| Leicester East BC | 75,970 | Leicestershire | Leicester |
| Leicester South BC | 75,553 | Leicestershire | Leicester |
| 76,992 | Leicestershire | Blaby / Leicester | |
| Lincoln BC | 74,128 | Lincolnshire | Lincoln / North Kesteven |
| Loughborough CC | 76,703 | Leicestershire | Charnwood |
| Louth and Horncastle CC | 73,791 | Lincolnshire | East Lindsey |
| Mansfield CC | 72,796 | Nottinghamshire | Mansfield |
| 74,216 | Leicestershire | Charnwood / Melton | |
| Mid Derbyshire CC | 70.085 | Derbyshire | Amber Valley / Derby / Erewash |
| 76,828 | Leicestershire | Blaby / Charnwood / Hinckley and Bosworth | |
| Newark CC | 76,478 | Nottinghamshire | Bassetlaw / Newark and Sherwood / Rushcliffe |
| North East Derbyshire CC | 72,344 | Derbyshire | Chesterfield / North East Derbyshire |
| North West Leicestershire CC | 75,373 | Leicestershire | North West Leicestershire |
| Northampton North BC | 71,214 | Northamptonshire | West Northamptonshire |
| Northampton South BC | 76,011 | Northamptonshire | West Northamptonshire |
| Nottingham East BC | 75,327 | Nottinghamshire | Nottingham |
| 74,515 | Nottinghamshire | Broxtowe / Nottingham | |
| Nottingham South BC | 76,076 | Nottinghamshire | Nottingham |
| Rushcliffe CC | 76,171 | Nottinghamshire | Rushcliffe |
| Rutland and Stamford CC | 70,895 | Lincolnshire / Rutland | Rutland / South Kesteven |
| Sherwood CC | 76,543 | Nottinghamshire | Ashfield / Gedling / Newark and Sherwood |
| Sleaford and North Hykeham CC | 73,380 | Lincolnshire | North Kesteven |
| South Derbyshire CC | 71,202 | Derbyshire | South Derbyshire |
| South Lincolnshire CC | 71,363 | Lincolnshire | Boston / South Holland |
| South Northamptonshire CC | 76,555 | Northamptonshire | North Northamptonshire / West Northamptonshire |
| 76,520 | Northamptonshire | North Northamptonshire | |
| 75,773 | Nottinghamshire | Bassetlaw |
Results history[]
Primary data source: House of Commons research briefing - General election results from 1918 to 2019[7]
2019[]
The number of votes cast for each political party who fielded candidates in constituencies comprising the East Midlands region in the 2019 general election were as follows:
| Party | Votes | % | Change from 2017 | Seats | Change from 2017 |
|---|---|---|---|---|---|
| Conservative | 1,280,724 | 54.8% | 38 | ||
| Labour | 740,975 | 31.7% | 8 | ||
| Liberal Democrats | 182,665 | 7.8% | 0 | 0 | |
| Greens | 60,067 | 2.6% | 0 | 0 | |
| Brexit | 35,344 | 1.5% | new | 0 | 0 |
| Others | 38,677 | 1.6% | 0 | 0 | |
| Total | 2,338,452 | 100.0 | 46 |
Percentage votes[]

Key:
CON - Conservative Party, including National Liberal Party up to 1966
LAB - Labour Party
LIB - Liberal Party up to 1979; SDP-Liberal Alliance 1983 & 1987; Liberal Democrats from 1992
UKIP/Br - UK Independence Party 2010 to 2017 (included in Other up to 2005 and in 2019); Brexit Party in 2019
Green - Green Party of England and Wales (included in Other up to 2005)
Seats[]

Key:
CON - Conservative Party, including National Liberal Party up to 1966
LAB - Labour Party
LIB - Liberal Party up to 1979; SDP-Liberal Alliance 1983 & 1987; Liberal Democrats from 1992
OTH - 1945 - Independent (Denis Kendall); 1974 (Feb) - Democratic Labour (Dick Taverne)
See also[]
- List of United Kingdom Parliament constituencies
- List of Parliamentary constituencies in Derbyshire
- List of Parliamentary constituencies in Leicestershire and Rutland
- List of Parliamentary constituencies in Lincolnshire
- List of Parliamentary constituencies in Northamptonshire
- List of Parliamentary constituencies in Nottinghamshire
Notes[]
References[]
- ^ See NUTS 1 statistical regions of England
- ^ "Results of the 2019 General Election". BBC News. Retrieved 17 December 2019.
- ^ Baker, Carl; Uberoi, Elise; Cracknell, Richard (28 January 2020). "General Election 2019: full results and analysis". Cite journal requires
|journal=(help) - ^ a b c "Constituencies A-Z - Election 2019". BBC News. Retrieved 26 April 2020.
- ^ "2023 Review". Boundary Commission for England. Retrieved 8 January 2021.
- ^ "East Midlands". boundarycommissionforengland.independent.gov.ukBoundary Commission for England. Retrieved 11 November 2021.
- ^ Watson, Christopher; Uberoi, Elise; Loft, Philip (17 April 2020). "General election results from 1918 to 2019". Cite journal requires
|journal=(help)
- Lists of constituencies of the Parliament of the United Kingdom in England