List of Parliamentary constituencies in Devon
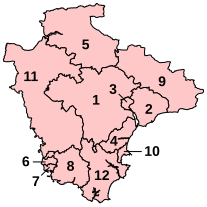
The ceremonial county of Devon, which includes the unitary authorities of Torbay and Plymouth, is divided into 12 Parliamentary constituencies: 4 Borough constituencies and 8 County constituencies.
Constituencies[]
† Conservative ‡ Labour ¤ Liberal Democrat Independent
| Constituency[nb 1] | Electorate[1] | Majority[2][nb 2] | Member of Parliament[2] | Nearest opposition[2] | Map | ||
|---|---|---|---|---|---|---|---|
| Central Devon CC | 74,926 | 17,721 | Mel Stride† | Lisa Robillard Webb‡ |  | ||
| East Devon CC | 87,168 | 6,708 | Simon Jupp† | Claire Wright |  | ||
| Exeter BC | 82,054 | 10,403 | Ben Bradshaw‡ | John Gray† |  | ||
| Newton Abbot CC | 72,529 | 17,501 | Anne-Marie Morris† | Martin Wrigley¤ |  | ||
| North Devon CC | 75,859 | 14,813 | Selaine Saxby† | Alex White¤ |  | ||
| Plymouth, Moor View BC | 69,430 | 12,897 | Johnny Mercer† | Charlotte Holloway‡ |  | ||
| Plymouth, Sutton and Devonport BC | 77,852 | 4,757 | Luke Pollard‡ | Rebecca Smith† |  | ||
| South West Devon CC | 72,535 | 21,430 | Gary Streeter† | Philippa Davey‡ | 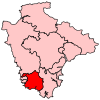 | ||
| Tiverton and Honiton CC | 82,953 | 24,239 | Neil Parish† | Alex Beverley‡ |  | ||
| Torbay BC | 75,054 | 17,749 | Kevin Foster† | Lee Howgate¤ |  | ||
| Torridge and West Devon CC | 80,403 | 24,992 | Geoffrey Cox† | David Chalmers¤ |  | ||
| Totnes CC | 69,863 | 12,724 | Anthony Mangnall† | Sarah Wollaston¤ |  | ||
2010 boundary changes[]
Under the Fifth Periodic Review of Westminster constituencies, the Boundary Commission for England decided to increase the number of seats in Devon from 11 to 12, with the creation of Central Devon, which impacted on neighbouring constituencies. An adjusted Teignbridge constituency was renamed Newton Abbot. Plymouth, Devonport, and Plymouth, Sutton were renamed Plymouth, Moor View, and Plymouth, Sutton and Devonport respectively following a small realignment of the boundary between the two constituencies.
| Former name | Boundaries 1997-2010 | Current name | Boundaries 2010–present |
|---|---|---|---|
 |
 |
Proposed boundary changes[]
See 2023 Periodic Review of Westminster constituencies for further details.
Following the abandonment of the Sixth Periodic Review (the 2018 review), the Boundary Commission for England formally launched the 2023 Review on 5 January 2021 and published their initial proposals on 8 June 2021.[3]
The commission has proposed that Devon be combined with Avon and Somerset as a sub-region of the South West Region, resulting in significant change to the existing pattern of constituencies. In Devon, East Devon, and Tiverton and Honiton would disappear, being replaced by Exmouth, Honiton, and the cross-county boundary constituency of Tiverton and Minehead. Torridge and West Devon would be renamed Torridge and Tavistock.[4][5] The following seats are proposed:
Containing electoral wards from East Devon
- Central Devon (part)
- (part)
- Honiton (part)
Containing electoral wards from Exeter
- Exeter
- Exmouth (part)
Containing electoral wards from Mid Devon
- Central Devon (part)
- Honiton (part)
- (part in the Somerset District of Somerset West and Taunton)
Containing electoral wards from North Devon
Containing electoral wards from Plymouth
Containing electoral wards from South Hams
- South West Devon (part)
- Totnes (part)
Containing electoral wards from Teignbridge
- Central Devon (part)
- Newton Abbot
Containing electoral wards from Torbay
- Torbay
- Totnes (part)
Containing electoral wards from Torridge
- (part)
Containing electoral wards from West Devon
- Central Devon (part)
- South West Devon (part)
- Torridge and Tavistock (part)
Revised proposals will be published in late 2022 and the final report will be submitted in June 2023.
Results history[]
Primary data source: House of Commons research briefing - General election results from 1918 to 2019[6]
2019[]
The number of votes cast for each political party who fielded candidates in constituencies comprising Devon in the 2019 general election were as follows:
| Party | Votes | % | Change from 2017 | Seats | Change from 2017 |
|---|---|---|---|---|---|
| Conservative | 355,052 | 53.9% | 10 | 0 | |
| Labour | 150,169 | 22.8% | 2 | 0 | |
| Liberal Democrats | 96,809 | 14.7% | 0 | 0 | |
| Greens | 22,004 | 3.3% | 0 | 0 | |
| Brexit | 4,337 | 0.7% | new | 0 | 0 |
| Others | 30,836 | 4.6% | 0 | 0 | |
| Total | 659,207 | 100.0 | 12 |
Percentage votes[]
| Election year | 1924 | 1929 | 1945 | 1950 | 1951 | 1955 | 1959 | 1964 | 1966 | 1970 | 1974
(Feb) |
1974
(Oct) |
1979 | 1983 | 1987 | 1992 | 1997 | 2001 | 2005 | 2010 | 2015 | 2017 | 2019 |
|---|---|---|---|---|---|---|---|---|---|---|---|---|---|---|---|---|---|---|---|---|---|---|---|
| Conservative1 | 52.3 | 43.0 | 49.3 | 50.3 | 55.8 | 55.3 | 52.9 | 47.6 | 47.5 | 52.8 | 45.5 | 45.0 | 43.9 | 52.8 | 49.5 | 47.6 | 36.8 | 39.0 | 38.1 | 43.3 | 46.2 | 51.1 | 53.9 |
| Labour | 13.7 | 16.3 | 34.1 | 34.1 | 36.5 | 33.3 | 27.6 | 26.9 | 32.8 | 29.4 | 21.8 | 24.9 | 22.1 | 11.1 | 13.1 | 19.2 | 25.9 | 23.6 | 20.4 | 14.2 | 18.0 | 29.0 | 22.8 |
| Liberal Democrat2 | 34.0 | 36.4 | 16.2 | 15.6 | 7.7 | 11.3 | 19.5 | 25.5 | 19.6 | 17.8 | 32.6 | 29.9 | 22.8 | 35.4 | 36.6 | 30.3 | 31.3 | 31.9 | 32.7 | 33.4 | 13.2 | 12.5 | 14.7 |
| Green Party | - | - | - | - | - | - | - | - | - | - | - | - | - | - | * | * | * | * | * | 1.6 | 5.6 | 2.0 | 3.3 |
| UKIP | - | - | - | - | - | - | - | - | - | - | - | - | - | - | - | - | * | * | * | 6.1 | 14.6 | 1.7 | * |
| Brexit Party | - | - | - | - | - | - | - | - | - | - | - | - | - | - | - | - | - | - | - | - | - | - | 0.7 |
| Other | - | 4.2 | 0.4 | 0.1 | - | - | - | - | - | - | 0.1 | 0.2 | 1.2 | 0.7 | 0.9 | 2.9 | 6.1 | 5.5 | 8.8 | 1.3 | 2.3 | 3.7 | 4.6 |
1Includes National Liberal Party up to 1966 and one National candidate in 1945
2pre-1979 - Liberal; 1983 & 1987 - SDP-Liberal Alliance
* Included in Other
Meaningful vote percentages are not available for the elections of 1918, 1922, 1923, 1931 and 1935 since at least one seat was gained unopposed.
Seats[]
| Election year | 1950 | 1951 | 1955 | 1959 | 1964 | 1966 | 1970 | 1974
(Feb) |
1974
(Oct) |
1979 | 1983 | 1987 | 1992 | 1997 | 2001 | 2005 | 2010 | 2015 | 2017 | 2019 |
|---|---|---|---|---|---|---|---|---|---|---|---|---|---|---|---|---|---|---|---|---|
| Conservative1 | 8 | 9 | 10 | 9 | 9 | 7 | 8 | 8 | 8 | 9 | 10 | 10 | 9 | 5 | 4 | 5 | 8 | 11 | 10 | 10 |
| Labour | 2 | 1 | 0 | 0 | 0 | 2 | 1 | 1 | 1 | 1 | 0 | 0 | 1 | 3 | 3 | 3 | 2 | 1 | 2 | 2 |
| Liberal Democrat2 | 0 | 0 | 0 | 1 | 1 | 1 | 1 | 1 | 1 | 0 | 1 | 1 | 1 | 3 | 4 | 3 | 2 | 0 | 0 | 0 |
| Total | 10 | 10 | 10 | 10 | 10 | 10 | 10 | 10 | 10 | 10 | 11 | 11 | 11 | 11 | 11 | 11 | 12 | 12 | 12 | 12 |
1Includes National Liberal Party up to 1966
21950-1979 - Liberal; 1983 & 1987 - SDP-Liberal Alliance
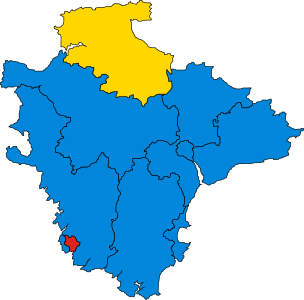
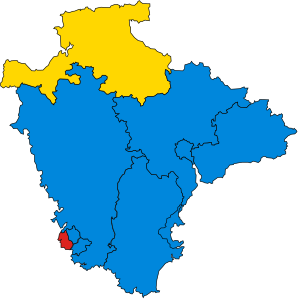
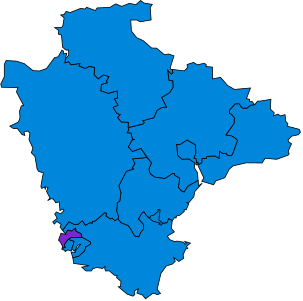
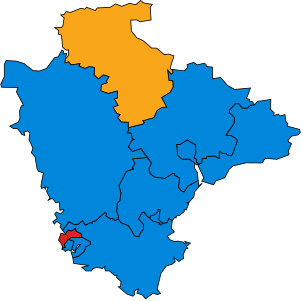
Maps[]

1950
1951

1955
1959

1964

1966
1970
1974 Feb
1974 Oct

1979
1983
1987
1992

1997
2001

2005

2010
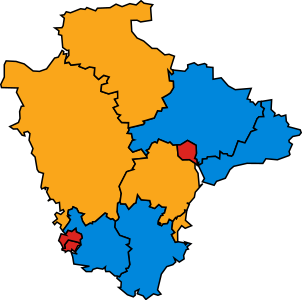
2015

2017
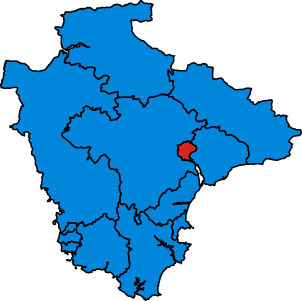
2019


Historical results by party[]
A cell marked → (with a different colour background to the preceding cell) indicates that the previous MP continued to sit under a new party name.
1885 to 1918 (13 MPs)[]
Conservative Liberal Liberal Unionist
| Constituency | 1885 | 1886 | 91 | 1892 | 1895 | 98 | 99 | 00 | 1900 | 02 | 04 | 1906 | 08 | Jan 1910 | Dec 1910 | 11 | 12 | 15 | 18 |
|---|---|---|---|---|---|---|---|---|---|---|---|---|---|---|---|---|---|---|---|
| Ashburton | Seale-Hayne | Eve | Morrison-Bell | Buxton | Morrison-Bell | → | |||||||||||||
| Barnstaple | Pitt-Lewis | → | Billson | Gull | Soares | Baring | |||||||||||||
| Devonport (two MPs) | Puleston | Morton | Lockie | J. Benn | Jackson | ||||||||||||||
| Price | Kearley | Kinloch-Cooke | |||||||||||||||||
| Exeter | Northcote | Vincent | Kekewich | Duke | St Maur | Duke | Newman | ||||||||||||
| Honiton | Kennaway | Morrison-Bell | |||||||||||||||||
| Plymouth (two MPs) | Clarke | Guest | → | Dobson | Williams | W. Astor | |||||||||||||
| Bates | Pearce | Harrison | Mendl | Duke | Mallet | A. Benn | |||||||||||||
| South Molton | Wallop | → | Lambert | ||||||||||||||||
| Tavistock | Fortescue | → | Luttrell | Spear | Luttrell | Spear | |||||||||||||
| Tiverton | Walrond | Walrond jnr | Carew | ||||||||||||||||
| Torquay | McIver | Mallock | Philpotts | Layland-Barratt | Burn | → | |||||||||||||
| Totnes | Mildmay | → | → | ||||||||||||||||
1918 to 1950 (11 MPs)[]
Coalition Liberal (1918-22) / National Liberal (1922-23) Common Wealth Conservative Independent Conservative Independent National Labour Liberal National Liberal (1931-68)
| Constituency | 1918 | 19 | 1922 | 23 | 1923 | 1924 | 28 | 1929 | 31 | 1931 | 1935 | 37 | 42 | 1945 |
|---|---|---|---|---|---|---|---|---|---|---|---|---|---|---|
| Barnstaple | Rees | B. Peto | Rees | B. Peto | R. Dyke Acland | → | C. Peto | |||||||
| Exeter | Newman | → | Reed | Maude | ||||||||||
| Honiton | Morrison-Bell | Drewe | ||||||||||||
| Plymouth Devonport | Kinloch-Cooke | Hore-Belisha | → | → | Foot | |||||||||
| Plymouth Drake | A. Benn | Moses | F. Guest | C. Guest | Medland | |||||||||
| Plymouth Sutton | W. Astor | N. Astor | Middleton | |||||||||||
| South Molton | Lambert | → | Drewe | Lambert | → | Lambert jnr | ||||||||
| Tavistock | Williams | Thornton | Kenyon-Slaney | Wright | Patrick | Studholme | ||||||||
| Tiverton | Carew | Sparkes | F. Dyke Acland | Acland-Troyte | Heathcoat-Amory | |||||||||
| Torquay | Burn | Thompson | Williams | |||||||||||
| Totnes | Mildmay | Harvey | Vivian | Harvey | Rayner | |||||||||
1950 to 1983 (10 MPs)[]
Conservative Labour Liberal National Liberal (1931-68) Social Democratic
| Constituency | 1950 | 1951 | 1955 | 55 | 58 | 1959 | 60 | 1964 | 1966 | 67 | 1970 | Feb 1974 | Oct 1974 | 1979 | 81 |
|---|---|---|---|---|---|---|---|---|---|---|---|---|---|---|---|
| Devon North | C. Peto | Lindsay | Thorpe | Speller | |||||||||||
| Exeter | Maude | Dudley-Williams | Dunwoody | Hannam | |||||||||||
| Honiton | Drewe | Mathew | Emery | ||||||||||||
| Plymouth Devonport | Foot | Vickers | → | Owen | → | ||||||||||
| Plymouth Drake | Fookes | ||||||||||||||
| Plymouth Sutton | Middleton | J. Astor | Fraser | Owen | Clark | ||||||||||
| Tavistock | Studholme | Heseltine | |||||||||||||
| Tiverton | Heathcoat-Amory | Maxwell-Hyslop | |||||||||||||
| Torquay (1950–74) / Torbay (1974-83) | Williams | Bennett | |||||||||||||
| Torrington (1950–74) / Devon W (1974-83) | Lambert jnr | Bonham-Carter | Browne | Mills | |||||||||||
| Totnes | Rayner | Mawby | |||||||||||||
1983 to present[]
Change UK Conservative Independent Labour Liberal Democrats Social Democratic (1983-88) / Social Democratic Party (1988-90)
| Constituency | 1983 | 1987 | 90 | 1992 | 95 | 1997 | 2001 | 2005 | 2010 | 2015 | 2017 | 17 | 17 | 19 | 19 | 2019 | 22 |
|---|---|---|---|---|---|---|---|---|---|---|---|---|---|---|---|---|---|
| Plymouth Drake | Fookes | ||||||||||||||||
| Honiton / East Devon (1997) | Emery | Swire | Jupp | ||||||||||||||
| Exeter | Hannam | Bradshaw | |||||||||||||||
| Plymouth Devonport / Plymouth Moor View (2010) | Owen | → | Jamieson | Seabeck | Mercer | ||||||||||||
| Plymouth Sutton / Plymouth Sutton & Devonport (2010) | Clark | Streeter | Gilroy | Colvile | Pollard | ||||||||||||
| Teignbridge / Newton Abbot (2010) | Nicholls | Younger-Ross | Morris | → | → | → | |||||||||||
| Torbay | Bennett | Allason | Sanders | Foster | |||||||||||||
| Devon North | Speller | Harvey | Heaton-Jones | Saxby | |||||||||||||
| Devon West and Torridge | Mills | Nicholson | → | Burnett | Cox | ||||||||||||
| South Hams / Totnes (1997) | Steen | Wollaston | → | → | Mangnall | ||||||||||||
| Tiverton (1983–97) / Tiverton & Honiton (1997) | Maxwell-Hyslop | Browning | Parish | ||||||||||||||
| South West Devon | Streeter | ||||||||||||||||
| Central Devon | Stride | ||||||||||||||||
See also[]
Notes[]
References[]
- ^ Baker, Carl; Uberoi, Elise; Cracknell, Richard (2020-01-28). "General Election 2019: full results and analysis".
- ^ a b c "Constituencies A-Z - Election 2019". BBC News. Retrieved 2020-04-24.
- ^ "2023 Review | Boundary Commission for England". boundarycommissionforengland.independent.gov.uk. Retrieved 2021-10-07.
- ^ Electoral map shake-up for Devon Devon Live
- ^ 2023 review South West Boundary Commission for England
- ^ Watson, Christopher; Uberoi, Elise; Loft, Philip (2020-04-17). "General election results from 1918 to 2019".
- Lists of constituencies of the Parliament of the United Kingdom in England
- Parliamentary constituencies in South West England
- Parliamentary constituencies in Devon
- Devon-related lists