List of Parliamentary constituencies in Wales

| This article is part of a series within UK politics on the |
| Politics of Wales |
|---|
Category ·
|
Wales is currently divided into forty Parliamentary constituencies which elect Members of Parliament to the House of Commons of the United Kingdom. After the General Election of December 2019, 22 of the Welsh constituencies are represented by Labour MPs, 14 by Conservative MPs, and 4 by Plaid Cymru MPs.[1]
On 8 September 2021, the boundary commission for Wales published its proposals for the new constituencies of Wales, reducing the number from 40 to 32.[2] As of September 2021, the same constituencies are used for elections to the Senedd, with the same boundaries used to make up the Senedd constituencies, however proposed changes to Westminister constituencies are not automatically applied to Senedd ones, and there are proposals to increase Senedd constituencies.
Constituencies[]
‡Labour †Conservative ₪Plaid Cymru ¤Liberal Democrat *Brexit Party/Reform UK ȼIndependent
| Constituency | Electorate[3] | Majority[4] | Member of Parliament[4] | Nearest opposition[4] | Map | ||
|---|---|---|---|---|---|---|---|
| Aberavon | 50,750 | 10,490 | Stephen Kinnock‡ | Charlotte Lang† |  | ||
| Aberconwy | 44,699 | 2,034 | Robin Millar† | Emily Owen ‡ |  | ||
| Alyn and Deeside | 62,789 | 213 | Mark Tami‡ | Sanjoy Sen† |  | ||
| Arfon | 42,215 | 2,781 | Hywel Williams₪ | Steffie Williams Roberts‡ |  | ||
| Blaenau Gwent | 50,739 | 8,647 | Nick Smith‡ | Richard Taylor* |  | ||
| Brecon and Radnorshire | 55,490 | 7,131 | Fay Jones† | Jane Dodds¤ |  | ||
| Bridgend | 63,303 | 1,157 | Jamie Wallis† | Madeleine Moon‡ |  | ||
| Caerphilly | 63,166 | 6,833 | Wayne David‡ | Jane Pratt† |  | ||
| Cardiff Central | 64,037 | 17,179 | Jo Stevens‡ | Meirion Jenkins† |  | ||
| Cardiff North | 68,438 | 6,982 | Anna McMorrin‡ | Mo Ali† |  | ||
| Cardiff South and Penarth | 78,837 | 12,737 | Stephen Doughty‡ | Philippa Broom† |  | ||
| Cardiff West | 68,508 | 10,986 | Kevin Brennan‡ | Carolyn Webster† |  | ||
| Carmarthen East and Dinefwr | 57,419 | 1,809 | Jonathan Edwardsȼ | David Darkin† |  | ||
| Carmarthen West and South Pembrokeshire | 59,158 | 7,745 | Simon Hart† | Marc Tierney‡ |  | ||
| Ceredigion | 56,250 | 6,329 | Ben Lake₪ | Amanda Jenner¤ |  | ||
| Clwyd South | 53,919 | 1,239 | Simon Baynes† | Susan Elan Jones‡ |  | ||
| Clwyd West | 57,714 | 6,747 | David Jones† | Jo Thomas‡ |  | ||
| Cynon Valley | 51,134 | 8,822 | Beth Winter‡ | Pauline Church† |  | ||
| Delyn | 54,560 | 865 | Rob Roberts† | David Hanson‡ |  | ||
| Dwyfor Meirionnydd | 44,362 | 4,740 | Liz Saville-Roberts₪ | Tomos Davies† |  | ||
| Gower | 61,762 | 1,837 | Tonia Antoniazzi‡ | Francesca O'Brien† |  | ||
| Islwyn | 55,423 | 5,464 | Christopher James Evans‡ | Gavin Chambers† |  | ||
| Llanelli | 60,518 | 4,670 | Nia Griffith‡ | Tamara Reay† |  | ||
| Merthyr Tydfil and Rhymney | 56,322 | 10,606 | Gerald Jones‡ | Sara Jones† |  | ||
| Monmouth | 67,098 | 9,982 | David Davies† | Yvonne Murphy‡ |  | ||
| Montgomeryshire | 48,997 | 12,138 | Craig Williams† | Kishan Devani¤ |  | ||
| Neath | 56,419 | 5,637 | Christina Rees‡ | Jon Burns† |  | ||
| Newport East | 58,554 | 1,992 | Jessica Morden‡ | Mark Brown† |  | ||
| Newport West | 66,657 | 902 | Ruth Jones‡ | Matthew Evans† |  | ||
| Ogmore | 57,581 | 7,805 | Chris Elmore‡ | Sadie Vidal† |  | ||
| Pontypridd | 60,327 | 5,887 | Alex Davies-Jones‡ | Sam Trask† |  | ||
| Preseli Pembrokeshire | 59,606 | 5,062 | Stephen Crabb† | Philippa Thompson‡ |  | ||
| Rhondda | 50,262 | 11,440 | Chris Bryant‡ | Hannah Jarvis |  | ||
| Swansea East | 58,450 | 11,440 | Carolyn Harris‡ | Denise Howard† |  | ||
| Swansea West | 57,078 | 8,116 | Geraint Davies‡ | James Price† |  | ||
| Torfaen | 62,330 | 3,742 | Nick Thomas-Symonds‡ | Graham Smith† |  | ||
| Vale of Clwyd | 56,649 | 1,827 | James Davies† | Chris Ruane‡ |  | ||
| Vale of Glamorgan | 76,508 | 3,562 | Alun Cairns† | Belinda Loveluck-Edwards‡ |  | ||
| Wrexham | 49,737 | 2,131 | Sarah Atherton† | Mary Wimbury‡ |  | ||
| Ynys Môn (Anglesey) | 51,925 | 1,968 | Virginia Crosbie† | Mary Roberts‡ |  | ||
Proposed boundary changes[]
Failed sixth periodic review[]
Under the terms of the Parliamentary Voting System and Constituencies Act 2011, the Sixth Periodic Review of Westminster Constituencies (the 2018 review) was based on reducing the total number of MPs from 650 to 600 and a strict electoral parity requirement that the electorate of all constituencies should be within a range of 5% either side of the electoral quota.
The Boundary Commission for Wales submitted their final proposals in respect of the Sixth Review in September 2018. Although the proposals were immediately laid before Parliament they were not brought forward by the Government for approval. Accordingly, they did not come into effect for the 2019 election which took place on 12 December 2019, and which was contested using the constituency boundaries in place since 2010.
On 24 March 2020, the Minister of State for the Cabinet Office, Chloe Smith, issued a written statement to Parliament setting out the Government's thinking with regard to parliamentary boundaries.[5] Subsequently, the Parliamentary Constituencies Act 2020[6] was passed into law on 14 December 2020 which formally removed the duty to implement the 2018 review and set out the framework for future boundary reviews.
2023 periodic review[]

The Parliamentary Constituencies Act 2020 was passed in December 2020, and the publication of the most recent data of electorate sizes of constituencies on 5 January 2021, lead the Boundary Commission for Wales to begin its review of the parliamentary constituencies in Wales. With the commission required to publish its final recommendations for boundary changes by 1 July 2023. By December 2021, the commission will publish the responses collected during the consultation period, and then conduct a six-week 'secondary consultation. Unlike the previous periodic review, the total UK constituencies was kept at 650.
When proportionally dividing the total 2021 electoral population of the United Kingdom using a statutory formula between the constituent countries of the UK, it results in England having 543 constituencies, Scotland having 57, Wales having 32 and Northern Ireland with the remaining 18. Each constituency recommended to have no more than 77,062 electors and no less than 69,724.[7] The figure from Wales is calculated to be 8 seats lower from the total constituencies used for the 2019 UK general election when there were 40 constituencies, the largest decrease of any UK country or region. Wales has one 'protected constituency' not subject to UK electoral quotas, Ynys Môn on the Isle of Anglesey, where boundary changes are not applied. The decrease in constituencies in Wales has been described by the commission to represent "the most significant change to Wales’s constituencies in a century", and the commission has no control over the number of constituencies in Wales. The final proposal published by the commission will no longer require Parliamentary approval and the recommendations in the final report will be implemented automatically, however the second consultation period will allow public hearing about the proposals. The commission stated that it tried wherever possible to use existing local government boundaries, such as those of existing constituencies and principal areas.
Draft proposals[]
On 8 September 2021, the Boundary Commission for Wales published its draft proposals for the new UK parliamentary constituencies in Wales. From publication, there would be a 8 week public consultation period up to 3 November 2021. These are not the final constituencies to be used at the next UK general election, between now and 2023 minor changes to the boundaries may take place following the consultation period, and marked on the table below.[7]
New - not existed prior, Expanded - keeps name of and contains an entire former constituency, Redefined - keeps name of and most of a former constituency.
| Draft proposed constituency | New electorate | Electoral wards from | Status | Notes | |
|---|---|---|---|---|---|
| Constituency | Principal area | ||||
| Aberafan Porthcawl | 76,792 | Aberavon (part) | Neath Port Talbot | New constituency | Considered due to good transport and communication links |
| Bridgend (part) | Bridgend | ||||
| Aberconwy | 69,909 | Aberconwy (all) | Conwy | Expanded constituency | Considered well connected by transport links and similar characteristics. |
| Clwyd West (part) | Conwy | ||||
| Arfon (part) | Gwynedd | ||||
| Alyn and Deeside | 74,144 | Alyn and Deeside (all) | Flintshire | Expanded constituency | Considered well connected by transport links and similar characteristics. |
| Clwyd South (part) | Wrexham | ||||
| Delyn (part) | Flintshire | ||||
| Blaenau Gwent and Rhymney | 71,079 | Blaenau Gwent (all) | Blaenau Gwent | New constituency | Considered well connected by transport links and similar characteristics. |
| Merthyr Tydfil and Rhymney (part) | Caerphilly | ||||
| Islwyn (part) | Caerphilly | ||||
| Caerphilly (part) | Caerphilly | ||||
| Brecon and Radnor | 72,113 | Brecon and Radnorshire (all) | Powys | New constituency | Considered due to similar characteristics, with Pontardawe sharing a semi-rural nature with Ystradgynlais, good road and communication links. |
| Neath (part) | Neath Port Talbot | ||||
| Bridgend | 74,388 | Bridgend (part) | Bridgend | Redefined constituency | Considered due to good transport links and entirely within Bridgend County Borough. |
| Ogmore (part) | Bridgend | ||||
| Caerfyrddin | 70,606 | Carmarthen East and Dinefwr (part) | Carmarthenshire | New constituency | Considered due to it entirely within Carmarthenshire, and linguistic characteristics. |
| Carmarthen West and South Pembrokeshire (part) | Carmarthenshire | ||||
| Cardiff Central | 74,486 | Cardiff Central (all) | Cardiff | Expanded constituency | Considered due to good transport links, and entirely within the City and County of Cardiff |
| Cardiff South and Penarth (part) | Cardiff | ||||
| Cardiff North | 71,143 | Cardiff North (all) | Cardiff | Expanded constituency | Considered due to good transport links such as the A470 and Manor Way. |
| Pontypridd (part) | Rhondda Cynon Taf | ||||
| Cardiff South and Penarth | 70,246 | Cardiff South and Penarth (part) | Cardiff | Redefined constituency | Considered due to road links. |
| Cardiff South and Penarth (part) | Vale of Glamorgan | ||||
| Vale of Glamorgan (part) | Vale of Glamorgan | ||||
| Cardiff West | 73,947 | Cardiff West (all) | Cardiff | Expanded constituency | Considered due to good transport links such as the M4 and Llantrisant Road. |
| Pontypridd (part) | Rhondda Cynon Taf | ||||
| Ceredigion Preseli | 76,269 | Ceredigion (all) | Ceredigion | New constituency | Considered due to similar characteristics including a rural and coastal nature, and good road links such as the A487. |
| Preseli Pembrokeshire (part) | Pembrokeshire | ||||
| Clwyd | 76,380 | Vale of Clwyd (part) | Denbighshire | New constituency | Considered due to good transport and communication links. Denbighshire principal area could've been a constituency on its own, however such a proposal impacted the ability to create other constituencies in North Wales, therefore was not considered. |
| Clwyd West (part) | Denbighshire | ||||
| Clwyd West (part) | Conwy | ||||
| Delyn | 76,074 | Delyn (part) | Flintshire | Redefined constituency | Considered due to good transport and communication links. |
| Vale of Clwyd (part) | Denbighshire | ||||
| Clwyd West (part) | Denbighshire | ||||
| Dwyfor Meirionnydd | 71,962 | Dwyfor Meirionnydd (all) | Gwynedd | Expanded constituency | Considered due to similarities in nature and character, in addition to good transport and communication links. |
| Arfon (part) | Gwynedd | ||||
| Islwyn | 70,735 | Islwyn (part) | Caerphilly | Redefined constituency | Considered due to good transport and communication links. |
| Caerphilly (part) | Caerphilly | ||||
| Llanelli | 71,972 | Llanelli (all) | Carmarthenshire | Expanded constituency | Considered due to good transport and communication links. |
| Carmarthen East and Dinefwr (part) | Carmarthenshire | ||||
| Merthyr Tydfil and Aberdare | 71,218 | Merthyr Tydfil and Rhymney (part) | Merthyr Tydfil (all) | New constituency | Recognised to not follow the geography of the valleys, however considered due to good road links across the Heads of the Valleys. |
| Cynon Valley (part) | Rhondda Cynon Taf | ||||
| Caerphilly (part) | Caerphilly | ||||
| Mid and South Pembrokeshire | 74,614 | Preseli Pembrokeshire (part) | Pembrokeshire | New constituency | Considered due to entirely being within the Pembrokeshire principal area. |
| Carmarthen West and South Pembrokeshire (part) | Pembrokeshire | ||||
| Monmouthshire | 72,681 | Monmouth (part) | Monmouthshire (all) | New constituency | Considered to have the entire Monmouthshire principal area as one constituency. |
| Newport East (part) | Monmouthshire (all) | ||||
| Montgomeryshire and Glyndŵr | 72,363 | Montgomeryshire (all) | Powys | New constituency | Considered due to similar in nature, and share similar rural characteristics. |
| Clwyd South (part) | Wrexham | ||||
| Clwyd South (part) | Denbighshire | ||||
| Newport East | 76,159 | Newport East (part) | Newport | Redefined constituency | Considered due to entirely being within the City of Newport. |
| Newport West (part) | Newport | ||||
| Newport West and Caerphilly | 74,394 | Newport West (part) | Newport | New constituency | Considered due to good road links and both part of the Aneurin Bevan University Health Board. |
| Caerphilly (part) | Caerphilly | ||||
| Pontypridd | 71,237 | Pontypridd (part) | Rhondda Cynon Taf | Redefined constituency | Considered due to entirely being within Rhondda Cynon Taf County Borough, and follows valley roads from north to south. |
| Cynon Valley (part) | Rhondda Cynon Taf | ||||
| Rhondda | 71,684 | Rhondda (all) | Rhondda Cynon Taf | Expanded constituency | Considered due to entirely being within Rhondda Cynon Taf County Borough, and good valley road links from north to south, to retain the local identity. |
| Ogmore (part) | Rhondda Cynon Taf | ||||
| Pontypridd (part) | Rhondda Cynon Taf | ||||
| Swansea Central and North | 76,199 | Gower (part) | Swansea | New constituency | Considered due to entirely being within the City and County of Swansea, and good transport and communication links. |
| Swansea East (part) | Swansea | ||||
| Swansea West (part) | Swansea | ||||
| Swansea East and Neath | 75,641 | Swansea East (part) | Swansea | New constituency | Considered due to similar characteristics as mixed-rural areas with good transport links. |
| Gower (part) | Swansea | ||||
| Aberavon (part) | Neath Port Talbot | ||||
| Neath (part) | Neath Port Talbot | ||||
| Swansea West and Gower | 75,214 | Gower (part) | Swansea | New constituency | Considered due to containing all electoral wards on the Gower Peninsula, all contained within the City and County of Swansea, and good transport and communication links. |
| Swansea West (part) | Swansea | ||||
| Torfaen | 70,591 | Torfaen (all) | Torfaen (all) | Expanded constituency | Considered to have the entire Torfaen County Borough as one constituency. |
| Monmouth (part) | Torfaen (all) | ||||
| Vale of Glamorgan | 70,426 | Vale of Glamorgan (part) | Vale of Glamorgan | Redefined constituency | Considered due to containing all but one of the electoral wards of the existing constituency of the same name, all contained within Vale of Glamorgan County Borough, with the exception of Dinas Powys. |
| Wrexham | 75,596 | Wrexham (all) | Wrexham | Expanded constituency | Considered due to entirely being within Wrexham County Borough, similar in nature, and with good transport and communication links. |
| Clwyd South (part) | Wrexham | ||||
| Ynys Môn | 52,415 | Ynys Môn (all) | Isle of Anglesey (all) | Protected constituency | Constituency not subject to the statutory UK electoral quota. |
Results history[]
Primary data source: House of Commons research briefing - General election results from 1918 to 2019[8]
2019[]
The number of votes cast for each political party who fielded candidates in constituencies comprising Wales in the 2019 general election were as follows:
| Party | Votes | % | Change from 2017 | Seats | Change from 2017 |
|---|---|---|---|---|---|
| Labour | 632,035 | 40.9% | 22 | ||
| Conservative | 557,234 | 36.1% | 14 | ||
| Plaid Cymru | 153,265 | 9.9% | 4 | 0 | |
| Liberal Democrats | 92,171 | 6.0% | 0 | 0 | |
| Brexit | 83,908 | 5.4% | new | 0 | 0 |
| Greens | 15,828 | 1.0% | 0 | 0 | |
| Others | 9,916 | 0.6% | 0 | 0 | |
| Total | 1,544,357 | 100.0 | 40 |
Percentage votes[]

Key:
CON - Conservative Party, including National Liberal Party up to 1966
LAB - Labour Party
LIB - Liberal Party up to 1979; SDP-Liberal Alliance 1983 & 1987; Liberal Democrats from 1992
PC - Plaid Cymru
UKIP/Br - UK Independence Party 2010 to 2017 (included in Other up to 2005 and in 2019); Brexit Party in 2019
Green - Green Party of England and Wales (included in Other up to 2005)
Seats[]

CON - Conservative Party, including National Liberal Party up to 1966
LAB - Labour Party
LIB - Liberal Party up to 1979; SDP-Liberal Alliance 1983 & 1987; Liberal Democrats from 1992
OTH - 1970 - Independent (S. O. Davies); 2005 - Independent (Peter Law)
PC - Plaid Cymru
Maps[]

2010

2015
2017

2019 by-elections

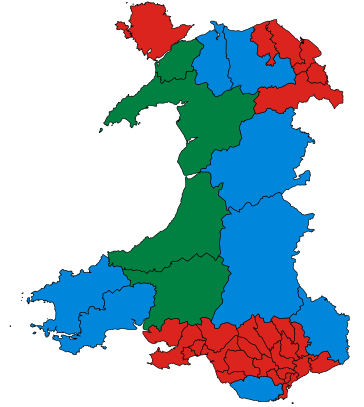
December 2019


These are maps of the results of the last four general elections in Wales and changes in 2019 following a by-election and a change of affiliation.
- Red represents the Labour Party's MPs.
- Blue represents the Conservative Party's MPs.
- Amber represents the Liberal Democrats' MPs.
- Green represents Plaid Cymru's MPs.
- Grey represents Independent MPs.
2019 by-elections[]
*Two by-elections were held in 2019:
See also[]
- List of Parliamentary constituencies in Clwyd
- List of Parliamentary constituencies in Dyfed
- List of Parliamentary constituencies in Gwent
- List of Parliamentary constituencies in Gwynedd
- List of Parliamentary constituencies in Mid Glamorgan
- List of Parliamentary constituencies in Powys
- List of Parliamentary constituencies in South Glamorgan
- List of Parliamentary constituencies in West Glamorgan
- Senedd constituencies and electoral regions
References[]
- ^ "Wales 2019 results". Election 2019 Results. BBC. Retrieved 15 December 2019.
- ^ "Major changes to cut number of Welsh MPs published". BBC News. 8 September 2021. Retrieved 8 September 2021.
- ^ Baker, Carl; Uberoi, Elise; Cracknell, Richard (28 January 2020). "General Election 2019: full results and analysis". Cite journal requires
|journal=(help) - ^ a b c "BBC Elections 2019 results". BBC Elections. 15 December 2019.
- ^ "Update: Strengthening Democracy:Written statement - HCWS183". UK Parliament. Retrieved 20 April 2020.
- ^ "Parliamentary Constituencies Act 2020".
- ^ a b c 2023 Review of Parliamentary Constituencies—Initial Proposals (PDF). bcomm-wales.gov.uk: Boundary Commission for Wales. 8 September 2021. Retrieved 8 September 2021.
- ^ Watson, Christopher; Uberoi, Elise; Loft, Philip (17 April 2020). "General election results from 1918 to 2019". parliament.uk. Cite journal requires
|journal=(help)
- Lists of constituencies of the Parliament of the United Kingdom in Wales
- Wales-related lists