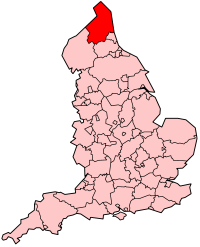
List of Parliamentary constituencies in the North East (region)
The region[1] of North East England is divided into 29 parliamentary constituencies which is made up of 19 Borough Constituencies and 10 County Constituencies. Since the 2019 general election,[2] 19 are represented by Labour MPs and 10 by Conservative MPs.
Constituencies[]
Proposed boundary changes[]
See 2023 Periodic Review of Westminster constituencies for further details.
Following the abandonment of the Sixth Periodic Review (the 2018 review), the Boundary Commission for England formally launched the 2023 Review on 5 January 2021 and published their initial proposals on 8 June 2021. The Commission have calculated that the number of seats to be allocated to the North East region will decrease by two, from 29 to 27.[5]
The following seats are proposed:[6]
| Constituency | Electorate | Ceremonial county | Local authority |
|---|---|---|---|
| 72,541 | Northumberland | Northumberland | |
| Bishop Auckland CC | 72,307 | Durham | County Durham |
| Blaydon CC | 74,066 | Tyne and Wear | Gateshead |
| 75,452 | Northumberland | Northumberland | |
| City of Durham CC | 70,603 | Durham / Tyne and Wear | County Durham / Sunderland |
| Darlington CC | 70,446 | Durham | Darlington |
| Gateshead BC | 70,553 | Tyne and Wear | Gateshead |
| Hartlepool CC | 71,228 | Durham | Hartlepool |
| Hexham CC | 72,738 | Northumberland / Tyne and Wear | Newcastle upon Tyne / Northumberland |
| 69,762 | Tyne and Wear | South Tyneside / Sunderland | |
| Middlesbrough BC | 71,742 | North Yorkshire | Middlesbrough / Stockton-on-Tees |
| Middlesbrough South and East Cleveland CC | 70,063 | North Yorkshire | Middlesbrough / Redcar and Cleveland |
| Newcastle upon Tyne East BC | 77,038 | Tyne and Wear | Newcastle upon Tyne |
| Newcastle upon Tyne North BC | 74,087 | Tyne and Wear | Newcastle upon Tyne / North Tyneside |
| Newcastle upon Tyne West BC | 73,536 | Tyne and Wear | Newcastle upon Tyne |
| 70,149 | Durham | County Durham | |
| North Durham CC | 73,327 | Durham | County Durham |
| North West Durham CC | 70,300 | Durham | County Durham |
| 71,235 | North Yorkshire | Middlesbrough / Redcar and Cleveland | |
| 72,787 | Durham / Tyne and Wear | County Durham / Sunderland | |
| South Shields BC | 69,725 | Tyne and Wear | South Tyneside |
| Stockton North CC | 69,779 | Durham | Stockton-on-Tees |
| 70.108 | Durham / North Yorkshire | Darlington / Stockton-on-Tees | |
| Sunderland Central BC | 72,688 | Tyne and Wear | Sunderland |
| Tynemouth BC | 76,984 | Tyne and Wear | North Tyneside |
| 75,245 | Tyne and Wear | Sunderland | |
| 74,510 | Northumberland / Tyne and Wear | North Tyneside / Northumberland |
Results history[]
Primary data source: House of Commons research briefing - General election results from 1918 to 2019[7]
2019[]
The number of votes cast for each political party who fielded candidates in constituencies comprising the North East region in the 2019 general election were as follows:
| Party | Votes | % | Change from 2017 | Seats | Change from 2017 |
|---|---|---|---|---|---|
| Labour | 532,122 | 42.6% | 19 | ||
| Conservative | 478,208 | 38.3% | 10 | ||
| Brexit | 98,958 | 7.9% | new | 0 | 0 |
| Liberal Democrats | 85,243 | 6.8% | 0 | 0 | |
| Greens | 29,732 | 2.4% | 0 | 0 | |
| Others | 23,872 | 2.0% | 0 | 0 | |
| Total | 1,248,135 | 100.0 | 29 |
Percentage votes[]

Key:
CON - Conservative Party, including National Liberal Party up to 1966
LAB - Labour Party
LIB - Liberal Party up to 1979; SDP-Liberal Alliance 1983 & 1987; Liberal Democrats from 1992
UKIP/Br - UK Independence Party 2010 to 2017 (included in Other up to 2005 and in 2019); Brexit Party in 2019
Green - Green Party of England and Wales (included in Other up to 2005)
Seats[]

Key:
CON - Conservative Party, including National Liberal Party up to 1966
LAB - Labour Party
LIB - Liberal Party up to 1979; SDP-Liberal Alliance 1983 & 1987; Liberal Democrats from 1992
OTH - 1974 (Feb) - Independent Labour (Eddie Milne)
See also[]
- List of United Kingdom Parliament constituencies
- List of Parliamentary constituencies in Cleveland
- List of Parliamentary constituencies in County Durham
- List of Parliamentary constituencies in Northumberland
- List of Parliamentary constituencies in Tyne and Wear
Notes[]
- ^ BC denotes borough constituency, CC denotes county constituency.
- ^ The majority is the number of votes the winning candidate receives more than their nearest rival.
- ^ Per by-election held on 6 May 2021.
References[]
- ^ NUTS statistical regions of England - NUTS 1 statistical regions of England
- ^ "Results of the 2019 General Election". BBC News. Retrieved 26 April 2020.
- ^ Baker, Carl; Uberoi, Elise; Cracknell, Richard (28 January 2020). "General Election 2019: full results and analysis". Commons Library. Retrieved 26 April 2020.
- ^ a b c "Constituencies A-Z - Election 2019". BBC News. Retrieved 26 April 2020.
- ^ "2023 Review". Boundary Commission for England. Retrieved 8 January 2021.
- ^ "Initial proposals for new Parliamentary constituency boundaries in the North East region | Boundary Commission for England". boundarycommissionforengland.independent.gov.uk. Retrieved 13 October 2021.
- ^ Watson, Christopher; Uberoi, Elise; Loft, Philip (17 April 2020). "General election results from 1918 to 2019". Retrieved 28 April 2020.
- Parliamentary constituencies in North East England
- Lists of constituencies of the Parliament of the United Kingdom in England
- Northumberland-related lists
- County Durham-related lists
- Tyne and Wear-related lists
- Cleveland, England


