Demography of Luton

Luton, Bedfordshire, England is an ethnically and culturally diverse town of 203,201 people.[1] It's primarily urban, with a population density of 4,696/km2 (12,160/sq mi). Luton has seen several waves of immigration. In the early part of the 20th century, there was internal migration of Irish and Scottish people to the town. These were followed by Afro-Caribbean and Asian immigrants. More recently immigrants from other European Union countries have made Luton their home. As a result of this Luton has a diverse ethnic mix, with a significant population of Asian descent, mainly Pakistani 29,353 (14.4%) and Bangladeshi 13,606 (6.7%).[2]
Since the 2011 census, Luton has had a white British population less than 50%, one of three towns in the United Kingdom along with Leicester and Slough. Luton has a majority white population, when non-British white people such as the Irish and Eastern Europeans are included.[2] 81% of the population of Luton define themselves as British.[3]
Ethnicity[]
The following table shows the ethnic group of respondents in the 2001 and 2011 censuses in Luton.
| Ethnic Group | 2001[4] | 2011[5] | ||
|---|---|---|---|---|
| Number | % | Number | % | |
| White: British | 119,793 | 64.97% | 90,530 | 44.55% |
| White: Irish | 8,569 | 4.65% | 6,126 | 3.01% |
| White: Gypsy or Irish Traveller[note 1] | 198 | 0.10% | ||
| White: Other | 4,204 | 2.28% | 14,225 | 7.00% |
| White: Total | 132,566 | 71.90% | 111,079 | 54.66% |
| Asian or Asian British: Indian | 7,538 | 4.09% | 10,625 | 5.23% |
| Asian or Asian British: Pakistani | 17,012 | 9.23% | 29,353 | 14.45% |
| Asian or Asian British: Bangladeshi | 7,641 | 4.14% | 13,606 | 6.70% |
| Asian or Asian British: Chinese[note 2] | 1,096 | 0.59% | 1,497 | 0.74% |
| Asian or Asian British: Other Asian | 1,486 | 0.81% | 5,871 | 2.89% |
| Asian or Asian British: Total | 34,773 | 18.86% | 60,952 | 30.00% |
| Black or Black British: Caribbean | 7,653 | 4.15% | 8,177 | 4.02% |
| Black or Black British: African | 3,204 | 1.74% | 9,169 | 4.51% |
| Black or Black British: Other Black | 827 | 0.45% | 2,563 | 1.26% |
| Black or Black British: Total | 11,684 | 6.34% | 19,909 | 9.80% |
| Mixed: White and Black Caribbean | 2,414 | 1.31% | 3,831 | 1.89% |
| Mixed: White and Black African | 389 | 0.21% | 915 | 0.45% |
| Mixed: White and Asian | 1,058 | 0.57% | 1,805 | 0.89% |
| Mixed: Other Mixed | 867 | 0.47% | 1,730 | 0.85% |
| Mixed: Total | 4,728 | 2.56% | 8,281 | 4.08% |
| Other: Arab[note 3] | 1,646 | 0.81% | ||
| Other: Any other ethnic group | 620 | 0.34% | 1,334 | 0.66% |
| Other: Total | 620 | 0.34% | 2,980 | 1.47% |
| Total | 184,371 | 100.00% | 203,201 | 100.00% |
Notes
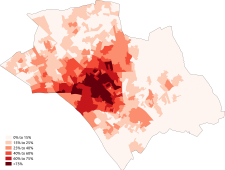
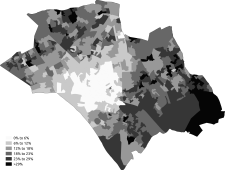
Distribution[]

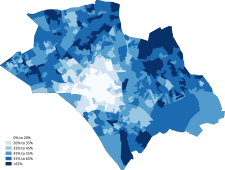
White

White-British

White-Irish

White-Other
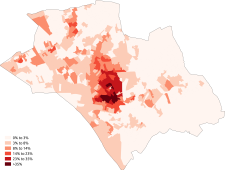
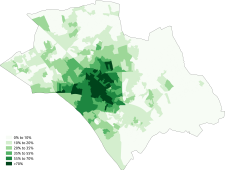
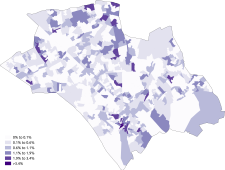
Asian

Asian-Indian

Asian-Pakistani
Asian-Bangladeshi

Asian-Chinese
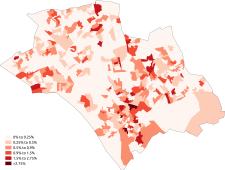
Black

Black-African
Black-Caribbean

Other-Arab


Languages[]
The most common main languages spoken in Luton according to the 2011 census are shown in the following table.[6]
| Rank | Language | Usual residents aged 3+ | Proportion |
|---|---|---|---|
| 1 | English | 153,463 | 79.43% |
| 2 | Urdu | 8,567 | 4.43% |
| 3 | Polish | 8,006 | 4.14% |
| 4 | Bengali (with Sylheti and Chatgaya) | 6,337 | 3.28% |
| 5 | Punjabi | 2,203 | 1.14% |
| 6 | Gujarati | 1,714 | 0.89% |
| 7 | Arabic | 1,037 | 0.54% |
| 8 | Lithuanian | 698 | 0.36% |
| 9 | Tamil | 653 | 0.34% |
| 10 | Tagalog/Filipino | 524 | 0.27% |
| 11 | Shona | 489 | 0.25% |
| 12 | Hindi | 484 | 0.25% |
| 13 | French | 439 | 0.23% |
| 14 | Portuguese | 397 | 0.21% |
| 15 | Slovak | 352 | 0.18% |
| 16 | Italian | 342 | 0.18% |
| 17 | Romanian | 340 | 0.18% |
| 18 | Russian | 324 | 0.17% |
| 19 | Malayalam | 316 | 0.16% |
| 20 | Pashto | 293 | 0.15% |
| Other | 6,217 | 3.22% |
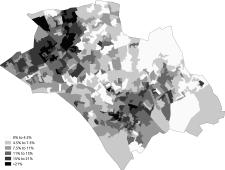
Religion[]
The following table shows the religion of respondents in the 2001 and 2011 censuses in Luton.
| Religion | 2001[7] | 2011[8] | ||
|---|---|---|---|---|
| Number | % | Number | % | |
| Christian | 109,973 | 59.65% | 96,271 | 47.38% |
| Buddhist | 456 | 0.25% | 652 | 0.32% |
| Hindu | 5,025 | 2.73% | 6,749 | 3.32% |
| Jewish | 534 | 0.29% | 326 | 0.16% |
| Muslim | 26,963 | 14.62% | 49,991 | 24.60% |
| Sikh | 1,487 | 0.81% | 2,347 | 1.16% |
| Other religion | 642 | 0.35% | 898 | 0.44% |
| No religion | 25,960 | 14.08% | 33,594 | 16.53% |
| Religion not stated | 13,331 | 7.23% | 12,373 | 6.09% |
| Total | 184,371 | 100.00% | 203,201 | 100.00% |
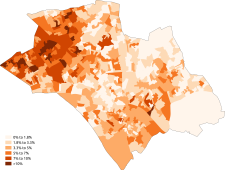
Distribution[]
Christianity
Islam

Judaism

Hinduism

Sikhism
Buddhism
Other religion
No religion


See also[]
- Demography of the United Kingdom
- Demography of England
- Demography of London
- Demography of Birmingham
- Demography of Greater Manchester
- List of English cities by population
- List of English districts by population
- List of English districts and their ethnic composition
- List of English districts by area
- List of English districts by population density
References[]
- ^ "LUTON BOROUGH PROFILE 2011 CENSUS DATA" (PDF).
- ^ a b "Local Authority by Ethnic Group". Office for National Statistics. Retrieved 20 February 2013.
- ^ Philipson, Alice. "White Britons a minority in Leicester, Luton and Slough". Telegraph. Retrieved 17 March 2013.
- ^ "2001 census - theme tables". NOMIS. Retrieved 17 June 2015.
- ^ "Download:local authorities: county / unitary". NOMIS. Retrieved 17 June 2015.
- ^ "Download:local authorities: county / unitary". NOMIS. Retrieved 17 June 2015.
- ^ "2001 census - theme tables". Retrieved 17 June 2015.
- ^ "Download:local authorities: county / unitary". NOMIS. Retrieved 17 June 2015.
| Places |
| |||||
|---|---|---|---|---|---|---|
| Amenities | ||||||
| Culture & Sport | ||||||
| Education |
| |||||
| Politics | ||||||
| Transport | ||||||
| Media | ||||||
| ||||||
| Unitary authorities | |
|---|---|
| Major settlements | |
| Topics |
|
- Luton
- Demographics of England