Eemian


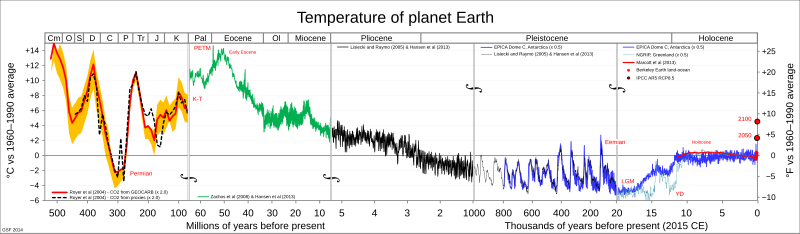
The Eemian (also called the last interglacial,[1] Sangamonian Stage, Ipswichian, Mikulin, Kaydaky, penultimate,[2] Valdivia or Riss-Würm) was the interglacial period which began about 130,000 years ago at the end of the Penultimate Glacial Period and ended about 115,000 years ago at the beginning of the Last Glacial Period.[3] It corresponds to Marine Isotope Stage 5e.[4] Although sometimes referred to as the "last interglacial" (in the "most recent previous" sense of "last"), it was the second-to-latest interglacial period of the current Ice Age, the most recent being the Holocene which extends to the present day (having followed the last glacial period). The prevailing Eemian climate was, on average, around 1 to 2 degrees Celsius (1.8 to 3.6 Fahrenheit) warmer than that of the Holocene.[5] During the Eemian, the proportion of CO2 in the atmosphere was about 280 parts per million.[6]
The Eemian is known as the Ipswichian in the UK, the Mikulin interglacial in Russia, the Valdivia interglacial in Chile and the Riss-Würm interglacial in the Alps. Depending on how a specific publication defines the Sangamonian Stage of North America, the Eemian is equivalent to either all or part of it.
The period falls into the Middle Paleolithic and is of some interest for the evolution of anatomically modern humans, who were present in Western Asia (Skhul and Qafzeh hominins) as well as in Southern Africa by this time, representing the earliest split of modern human populations that persists to the present time (associated with mitochondrial haplogroup L0).[7]
Climate[]

Global temperatures[]
The Eemian climate is believed to have been warmer than the current Holocene.[8][9] Changes in the Earth's orbital parameters from today (greater obliquity and eccentricity, and perihelion), known as Milankovitch cycles, probably led to greater seasonal temperature variations in the Northern Hemisphere.[citation needed] During summer months, temperatures in the Arctic region were about 2-4 °C higher than today.[10] The warmest peak of the Eemian was around 125,000 years ago, when forests reached as far north as North Cape, Norway (which is now tundra) well above the Arctic Circle at 71°10′21″N 25°47′40″E / 71.17250°N 25.79444°E. Hardwood trees such as hazel and oak grew as far north as Oulu, Finland.
 WikiMiniAtlas
At the peak of the Eemian, the Northern Hemisphere winters were generally warmer and wetter than now, though some areas were actually slightly cooler than today. The hippopotamus was distributed as far north as the rivers Rhine and Thames.[11] Trees grew as far north as southern Baffin Island in the Canadian Arctic Archipelago: currently, the northern limit is further south at Kuujjuaq in northern Quebec. Coastal Alaska was warm enough during the summer due to reduced sea ice in the Arctic Ocean to allow Saint Lawrence Island (now tundra) to have boreal forest, although inadequate precipitation caused a reduction in the forest cover in interior Alaska and Yukon Territory despite warmer conditions.[12] The prairie-forest boundary in the Great Plains of the United States lay further west near Lubbock, Texas, whereas the current boundary is near Dallas. The period closed as temperatures steadily fell to conditions cooler and drier than the present, with a 468-year-long aridity pulse in central Europe at about 116,000 BC,[13] and by 112,000 BC, a glacial period had returned.
Kaspar et al. (GRL, 2005) performed a comparison of a coupled general circulation model (GCM) with reconstructed Eemian temperatures for Europe. Central Europe (north of the Alps) was found to be 1–2 °C (1.8–3.6 °F) warmer than present; south of the Alps, conditions were 1–2 °C cooler than today. The model (generated using observed greenhouse gas concentrations and Eemian orbital parameters) generally reproduces these observations, leading them to conclude that these factors are enough to explain the Eemian temperatures.[14]
A 2018 study based on soil samples from Sokli in northern Finland identified abrupt cold spells ca. 120,000 years ago caused by shifts in the North Atlantic Current, lasting hundreds of years and causing temperature drops of a few degrees and vegetation changes in these regions.[15]
Sea level[]
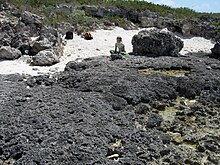
Sea level at peak was probably 6 to 9 metres (20 to 30 feet) higher than today,[17][18] with Greenland contributing 0.6 to 3.5 m (2.0 to 11.5 ft),[19] thermal expansion and mountain glaciers contributing up to 1 m (3.3 ft),[20] and an uncertain contribution from Antarctica.[21] Recent research on marine sediment cores offshore of the West Antarctic Ice Sheet suggest that the sheet melted during the Eemian, and that ocean waters rose as fast as 2.5 meters per century.[22] Global mean sea surface temperatures are thought to have been higher than in the Holocene, but not by enough to explain the rise in sea level through thermal expansion alone, and so melting of polar ice caps must also have occurred. Because of the sea level drop since the Eemian, exposed fossil coral reefs are common in the tropics, especially in the Caribbean and along the Red Sea coastlines. These reefs often contain internal erosion surfaces showing significant sea level instability during the Eemian.
A 2007 study found evidence that the Greenland ice core site Dye 3 was glaciated during the Eemian,[23] which implies that Greenland could have contributed at most 2 m (6.6 ft) to sea level rise.[24][25] Scandinavia was an island. Vast areas of northwestern Europe and the West Siberian Plain were inundated.[26]
Definition of the Eemian[]

The Eemian Stage was first recognized from boreholes in the area of the city of Amersfoort, Netherlands, by Pieter Harting (1875). He named the beds "Système Eémien", after the river Eem on which Amersfoort is located. Harting noticed the marine molluscan assemblages to be very different from the modern fauna of the North Sea. Many species from the Eemian layers nowadays show a much more southern distribution, ranging from South of the Strait of Dover to Portugal (Lusitanian faunal province) and even into the Mediterranean (Mediterranean faunal province). More information on the molluscan assemblages is given by Lorié (1887), and Spaink (1958). Since their discovery, Eemian beds in the Netherlands have mainly been recognized by their marine molluscan content combined with their stratigraphical position and other palaeontology. The marine beds there are often underlain by tills that are considered to date from the Saalian, and overlain by local fresh water or wind-blown deposits from the Weichselian. In contrast to e.g. the deposits in Denmark, the Eemian deposits in the type area have never been found overlain by tills, nor in ice-pushed positions.
Van Voorthuysen (1958) described the foraminifera from the type site, whereas Zagwijn (1961) published the palynology, providing a subdivision of this stage into pollen stages. At the end of the 20th century, the type site was re-investigated using old and new data in a multi-disciplinary approach (Cleveringa et al., 2000). At the same time a parastratotype was selected in the Amsterdam glacial basin in the Amsterdam-Terminal borehole and was the subject of a multidisciplinary investigation (Van Leeuwen, et al., 2000). These authors also published a U/Th age for late Eemian deposits from this borehole of 118,200 ± 6,300 years ago. A historical review of Dutch Eemian research is provided by Bosch, Cleveringa and Meijer, 2000.
See also[]
References[]
- ^ Adams, Jonathan; Maslin, Mark; Thomas, Ellen. "Sudden climate transitions during the Quaternary". Oak Ridge National Laboratory. Archived from the original on 2016-05-18. Retrieved 2017-01-24.
- ^ NOAA - Penultimate Interglacial Period http://www.ncdc.noaa.gov/global-warming/penultimate-interglacial-period
- ^ Dahl-Jensen, D.; Albert, M. R.; Aldahan, A.; Azuma, N.; Balslev-Clausen, D.; Baumgartner, M.; Berggren, A. -M.; Bigler, M.; Binder, T.; Blunier, T.; Bourgeois, J. C.; Brook, E. J.; Buchardt, S. L.; Buizert, C.; Capron, E.; Chappellaz, J.; Chung, J.; Clausen, H. B.; Cvijanovic, I.; Davies, S. M.; Ditlevsen, P.; Eicher, O.; Fischer, H.; Fisher, D. A.; Fleet, L. G.; Gfeller, G.; Gkinis, V.; Gogineni, S.; Goto-Azuma, K.; et al. (2013). "Eemian interglacial reconstructed from a Greenland folded ice core" (PDF). Nature. 493 (7433): 489–94. Bibcode:2013Natur.493..489N. doi:10.1038/nature11789. PMID 23344358. S2CID 4420908.
- ^ Shackleton, Nicholas J.; Sánchez-Goñi, Maria Fernanda; Pailler, Delphine; Lancelot, Yves (2003). "Marine Isotope Substage 5e and the Eemian Interglacial" (PDF). Global and Planetary Change. 36 (3): 151–155. Bibcode:2003GPC....36..151S. CiteSeerX 10.1.1.470.1677. doi:10.1016/S0921-8181(02)00181-9. Archived from the original (PDF) on 2016-03-03. Retrieved 2014-08-07.
- ^ "Current & Historical Global Temperature Graph".
- ^ "Earth is the warmest it's been in 120,000 years". Mashable. 2018.
- ^ M Richards et al. in: Bandelt et al. (eds.), Human Mitochondrial DNA and the Evolution of Homo sapiens, Springer (2006), p. 233.
- ^ "Current & Historical Global Temperature Graph".
- ^ Arctic Council, Impacts of a Warming Climate: Arctic Climate Impact Assessment, Cambridge U. Press, Cambridge, 2004
- ^ "Warm past climates: is our future in the past?". The National Centre for Atmospheric Science. 27 May 2020. Archived from the original on 13 August 2018.
- ^ van Kolfschoten, Th. (2000). "The Eemian mammal fauna of central Europe". Netherlands Journal of Geosciences. 79 (2/3): 269–281. doi:10.1017/S0016774600021752.
- ^ Vegetation and paleoclimate of the last interglacial period, central Alaska. USGS
- ^ Sirocko, F.; Seelos, K.; Schaber, K.; Rein, B.; Dreher, F.; Diehl, M.; Lehne, R.; Jäger, K.; Krbetschek, M.; Degering, D. (2005). "A late Eemian aridity pulse in central Europe during the last glacial inception". Nature. 436 (7052): 833–6. Bibcode:2005Natur.436..833S. doi:10.1038/nature03905. PMID 16094365. S2CID 4328192.
- ^ Kaspar, F.; Kühl, Norbert; Cubasch, Ulrich; Litt, Thomas (2005). "A model-data comparison of European temperatures in the Eemian interglacial". Geophysical Research Letters. 32 (11): L11703. Bibcode:2005GeoRL..3211703K. doi:10.1029/2005GL022456. hdl:11858/00-001M-0000-0011-FED3-9.
- ^ "Slowdown of North Atlantic circulation rocked the climate of ancient northern Europe". Faculty of Science. 2018.
- ^ Wilson, M. A.; Curran, H. A.; White, B. (2007). "Paleontological evidence of a brief global sea-level event during the last interglacial". Lethaia. 31 (3): 241–250. doi:10.1111/j.1502-3931.1998.tb00513.x.
- ^ Dutton, A; Lambeck, K (13 July 2012). "Ice volume and sea level during the last interglacial". Science. 337 (6091): 216–9. Bibcode:2012Sci...337..216D. doi:10.1126/science.1205749. PMID 22798610. S2CID 206534053.
- ^ Kopp, RE; Simons, FJ; Mitrovica, JX; Maloof, AC; Oppenheimer, M (17 December 2009). "Probabilistic assessment of sea level during the last interglacial stage". Nature. 462 (7275): 863–7. arXiv:0903.0752. Bibcode:2009Natur.462..863K. doi:10.1038/nature08686. PMID 20016591. S2CID 4313168.
- ^ Stone, E.J; Lundt, D.J; Annan, J.D.; Hargreaves, J.C. (2013). "Quantification of Greenland ice-sheet contribution to Last Interglacial sea-level rise". Clim. Past. 9 (2): 621–639. Bibcode:2013CliPa...9..621S. doi:10.5194/cp-9-621-2013.
- ^ McKay, Nicholas P.; Overpeck, Jonathan T.; Otto-Bliesner, Bette L. (July 2011). "The role of ocean thermal expansion in Last Interglacial sea level rise". Geophysical Research Letters. 38 (14): n/a. Bibcode:2011GeoRL..3814605M. doi:10.1029/2011GL048280.
- ^ Scherer, RP; Aldahan, A; Tulaczyk, S; Possnert, G; Engelhardt, H; Kamb, B (3 July 1998). "Pleistocene collapse of the west antarctic ice sheet". Science. 281 (5373): 82–5. Bibcode:1998Sci...281...82S. doi:10.1126/science.281.5373.82. PMID 9651249.
- ^ Voosen, Paul (2018-12-20). "Antarctic ice melt 125,000 years ago offers warning". Science. 362 (6421): 1339. Bibcode:2018Sci...362.1339V. doi:10.1126/science.362.6421.1339. ISSN 0036-8075. PMID 30573605. S2CID 58627262.
- ^ Willerslev, E.; Cappellini, E.; Boomsma, W.; Nielsen, R.; Hebsgaard, M. B.; Brand, T. B.; Hofreiter, M.; Bunce, M.; Poinar, H. N.; Dahl-Jensen, D.; Johnsen, S.; Steffensen, J. P.; Bennike, O.; Schwenninger, J. -L.; Nathan, R.; Armitage, S.; De Hoog, C. -J.; Alfimov, V.; Christl, M.; Beer, J.; Muscheler, R.; Barker, J.; Sharp, M.; Penkman, K. E. H.; Haile, J.; Taberlet, P.; Gilbert, M. T. P.; Casoli, A.; Campani, E.; Collins, M. J. (2007). "Ancient Biomolecules from Deep Ice Cores Reveal a Forested Southern Greenland". Science. 317 (5834): 111–4. Bibcode:2007Sci...317..111W. doi:10.1126/science.1141758. PMC 2694912. PMID 17615355.
- ^ Cuffey, K. M.; Marshall, S. J. (2000). "Substantial contribution to sea-level rise during the last interglacial from the Greenland ice sheet". Nature. 404 (6778): 591–4. Bibcode:2000Natur.404..591C. doi:10.1038/35007053. PMID 10766239. S2CID 4422775.
- ^ Otto-Bliesner, B. L.; Marshall, Shawn J.; Overpeck, Jonathan T.; Miller, Gifford H.; Hu, Aixue (2006). "Simulating Arctic Climate Warmth and Icefield Retreat in the Last Interglaciation". Science. 311 (5768): 1751–3. Bibcode:2006Sci...311.1751O. CiteSeerX 10.1.1.728.3807. doi:10.1126/science.1120808. PMID 16556838. S2CID 35153489.
- ^ Gornitz, Vivien (2013). Rising Seas: Past, Present, Future. New York: Columbia University Press. p. 101. ISBN 978-0-231-14739-2. Retrieved August 9, 2021.
Further reading[]
- Bosch, J. H. A.; Cleveringa, P.; Meijer, T. (2000). "The Eemian stage in the Netherlands: history, character and new research". Netherlands Journal of Geosciences. 79 (2/3): 135–145. doi:10.1017/S0016774600021673.
- Cleveringa, P., Meijer, T., van Leeuwen, R.J.W., de Wolf, H., Pouwer, R., Lissenberg T. and Burger, A.W., 2000. The Eemian stratotype locality at Amersfoort in the central Netherlands: a re-evaluation of old and new data. Geologie & Mijnbouw / Netherlands Journal of Geosciences, 79(2/3): 197–216.
- Harting, P., 1875. Le système Éemien Archives Néerlandaises Sciences Exactes et Naturelles de la Société Hollandaise des Sciences (Harlem), 10: 443–454.
- Harting, P., 1886. Het Eemdal en het Eemstelsel Album der Natuur, 1886: 95–100.
- Overpeck, Jonathan T.; et al. (2006). "Paleoclimatic Evidence for Future Ice-Sheet Instability and Rapid Sea-Level Rise". Science. 311 (5768): 1747–1750. Bibcode:2006Sci...311.1747O. doi:10.1126/science.1115159. PMID 16556837. S2CID 36048003.
- Lorié, J., 1887. Contributions a la géologie des Pays Bas III. Le Diluvium plus récent ou sableux et le système Eémien Archives Teyler, Ser. II, Vol. III: 104–160.
- Müller, Ulrich C.; et al. (2005). "Cyclic climate fluctuations during the last interglacial in central Europe". Geology. 33 (6): 449–452. Bibcode:2005Geo....33..449M. doi:10.1130/G21321.1.
- Spaink, G., 1958. De Nederlandse Eemlagen, I: Algemeen overzicht. Wetenschappelijke Mededelingen Koninklijke Nederlandse Natuurhistorische Vereniging 29, 44 pp.
- Van Leeuwen, R.J., Beets, D., Bosch, J.H.A., Burger, A.W., Cleveringa, P., van Harten, D., Herngreen, G.F.W., Langereis, C.G., Meijer, T., Pouwer, R., de Wolf, H., 2000. Stratigraphy and integrated facies analysis of the Saalian and Eemian sediments in the Amsterdam-Terminal borehole, the Netherlands. Geologie en Mijnbouw / Netherlands Journal of Geosciences 79, 161–196.
- Van Voorthuysen, J.H., 1958. Foraminiferen aus dem Eemien (Riss-Würm-Interglazial) in der Bohrung Amersfoort I (Locus Typicus). Mededelingen Geologische Stichting NS 11(1957), 27–39.
- Zagwijn, W.H., 1961. Vegetation, climate and radiocarbon datings in the Late Pleistocene of the Netherlands. Part 1: Eemian and Early Weichselian. Mededelingen Geologische Stichting NS 14, 15–45.
External links[]
The cold and warm periods of the Quaternary in the Alpine region | ||
|---|---|---|
- Interglacials
- Paleoclimatology
- Pleistocene