Effects of climate change on oceans

The effects of climate change on oceans include the rise in sea level from ocean warming and ice sheet melting, and changes in ocean stratification and circulation due to changing temperatures leading to changes in oxygen concentrations. There is clear evidence that the Earth is warming due to anthropogenic emissions of greenhouse gases and leading inevitably to ocean warming.[1] The greenhouse gases taken up by the ocean (via carbon sequestration) help to mitigate climate change but lead to ocean acidification.
Physical effects of climate change on oceans include sea level rise which will in particular affect coastal areas, ocean currents, weather and the seafloor. Chemical effects include ocean acidification and reductions in oxygen levels. Furthermore, there will be effects on marine life. The consensus of many studies of coastal tide gauge records is that during the past century sea level has risen worldwide at an average rate of 1–2 mm/yr reflecting a net flux of heat into the surface of the land and oceans. The rate at which ocean acidification will occur may be influenced by the rate of surface ocean warming, because the chemical equilibria that govern seawater pH are temperature-dependent.[2] Increase of water temperature will also have a devastating effect on different oceanic ecosystems like coral reefs. The direct effect is the coral bleaching of these reefs, which live within a narrow temperature margin, so a small increase in temperature would have a drastic effects in these environments.
Physical effects[]
Sea level rise[]
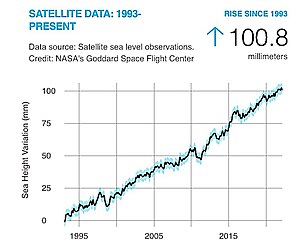
Tide gauge measurements show that the current global sea level rise began at the start of the 20th century. Between 1900 and 2017, the globally averaged sea level rose by 16–21 cm (6.3–8.3 in), or 1.4–1.8 mm (0.055–0.071 in) per year.[3] More precise data gathered from satellite radar measurements reveal an accelerating rise of 7.5 cm (3.0 in) from 1993 to 2017,[4]: 1554 for an average rate of 31 mm (1.22 in) per decade. This acceleration is due mostly to climate change, which is driving thermal expansion of seawater and the melting of land-based ice sheets and glaciers.[5] Between 1993 and 2018, thermal expansion of the oceans contributed 42% to sea level rise; the melting of temperate glaciers, 21%; Greenland, 15%; and Antarctica, 8%.[4]: 1576 Climate scientists expect the rate to further accelerate during the 21st century, with the latest measurements saying the sea levels are currently rising by 3.6 mm per year.[6]: 62 [7]
Projecting future sea level is challenging, due to the complexity of many aspects of the climate system and to time lags in sea level reactions to Earth temperature changes. As climate research into past and present sea levels leads to improved computer models, projections have consistently increased. In 2007, the Intergovernmental Panel on Climate Change (IPCC) projected a high end estimate of 60 cm (2 ft) through 2099,[8] but their 2014 report raised the high-end estimate to about 90 cm (3 ft).[9] A number of later studies have concluded that a global sea level rise of 200 to 270 cm (6.6 to 8.9 ft) this century is "physically plausible".[10][4][11] A conservative estimate of the long-term projections is that each Celsius degree of temperature rise triggers a sea level rise of approximately 2.3 meters (4.2 ft/degree Fahrenheit) over a period of two millennia (2,000 years): an example of climate inertia.[3] In February 2021, a paper published in Ocean Science suggested that past projections for global sea level rise by 2100 reported by the IPCC were likely conservative, and that sea levels will rise more than previously expected.[12]
The sea level will not rise uniformly everywhere on Earth, and it will even drop slightly in some locations, such as the Arctic.[13] Local factors include tectonic effects and subsidence of the land, tides, currents and storms. Sea level rises can affect human populations considerably in coastal and island regions.[14] Widespread coastal flooding is expected with several degrees of warming sustained for millennia.[15] Further effects are higher storm-surges and more dangerous tsunamis, displacement of populations, loss and degradation of agricultural land and damage in cities.[16][17][18] Natural environments like marine ecosystems are also affected, with fish, birds and plants losing parts of their habitat.[19]
Societies can adapt to sea level rise in three different ways: implement managed retreat, accommodate coastal change, or protect against sea level rise through hard-construction practices like seawalls or soft approaches such as dune rehabilitation and beach nourishment. Sometimes these adaptation strategies go hand in hand, but at other times choices have to be made among different strategies.[20] For some human environments, such as so called sinking cities, adaptation to sea level rise may be compounded by other environmental issues such as subsidence. Natural ecosystems typically adapt to rising sea levels by moving inland; however, they might not always be able to do so, due to natural or artificial barriers.[21]

Coasts[]
There are a number of factors affecting rising sea levels, including the thermal expansion of seawater, the melting of glaciers and ice sheets on land, and possibly human changes to groundwater storage.
The consensus of many studies of coastal tide gauge records is that during the past century sea level has risen worldwide at an average rate of 1–2 mm/yr reflecting a net flux of heat into the surface of the land and oceans. Corresponding studies based on satellite altimetry shows that this rate has increased to closer to 3 mm/yr during the more completely monitored past 20 years.[22] A recent review of the literature[23] suggests that 30% of the sea level rise since 1993 is due to thermal expansion and 55% due to continental ice melt, both resulting from warming global temperatures. In another study,[24] results estimate the heat content of the ocean in the upper 700 meters has increased significantly from 1955–2010. It has to be reminded that in this context the usage of the word heat is extremely improper, as heat cannot be stored in a body but only exchanged between bodies. Observations of the changes in "heat content" of the ocean are important for providing realistic estimates of how the ocean is changing with global warming. An even more recent study of the contributions to global sea level due to melting of the two large ice sheets based on satellite measurements of gravity fluctuations suggests that the melting of these alone are causing global sea level to about 1 mm/yr.[25] In a recent modeling study,[26] scientists used an earth system model to study several variables of the ocean, one of which was the "heat content" of the oceans over the past several hundred years. The earth system model incorporated the atmosphere, land surface processes, and other earth components to make it more realistic and similar to observations. Results of their model simulation showed that since 1500, the ocean "heat content" of the upper 500 m has increased.
The connection between sea level rise and ocean thermal expansion follows from Charles's law (also known as the law of volumes) put simply states that the volume of a given mass is proportional to its temperature. This contribution to sea level is monitored by oceanographers using a succession of temperature measuring profiling instruments, which is then compiled at national data centers such as the United States National Oceanographic Data Center. The International Panel on Climate Change (IPCC) Fifth Assessment Report estimates that the upper ocean (surface to 750 m deep) has warmed by 0.09 to 0.13 degrees C per decade over the past 40 years.[27] Other processes important in influencing global sea level include changes to groundwater storage including dams and reservoirs.
Global warming also has an enormous impact with respect to melting glaciers and ice sheets. Higher global temperatures melt glaciers such as the one in Greenland,[28] which flow into the oceans, adding to the amount of seawater. A large rise (on the order of several feet) in global sea levels poses many threats. According to the U.S. Environmental Protection Agency (EPA), "such a rise would inundate coastal wetlands and lowlands, erode beaches, increase the risk of flooding, and increase the salinity of estuaries, aquifers, and wetlands."[29] The seasonal cycles are closely linked with the seasonal changes in sea ice and sea surface temperatures. The timing and amplitude of the seasonal cycle has been altered by global warming.
Superimposed on the global rise in sea level, is strong regional and decadal variability which may cause sea level along a particular coastline to decline with time (for example along the Canadian eastern seaboard), or to rise faster than the global average. Regions that have shown a rapid rise in sea level during the past two decades include the western tropical Pacific and the United States northeastern seaboard. These regional variations in sea level are the result of many factors, such as local sedimentation rates, geomorphology, post-glacial rebound, and coastal erosion. Large storm events, such as Hurricane Sandy in the eastern Atlantic, can dramatically alter coastlines and affect sea level rise as well.
Coastal regions would be most affected by rising sea levels. The increase in sea level along the coasts of continents, especially North America are much more significant than the global average. According to 2007 estimates by the International Panel on Climate Change (IPCC), "global average sea level will rise between 0.6 and 2 feet (0.18 to 0.59 meters) in the next century.[30] Along the U.S. Mid-Atlantic and Gulf Coasts, however, sea level rose in the last century 5 to 6 inches more than the global average. This is due to the subsiding of coastal lands.[30] The sea level along the U.S. Pacific coast has also increased more than the global average but less than along the Atlantic coast. This can be explained by the varying continental margins along both coasts; the Atlantic type continental margin is characterized by a wide, gently sloping continental shelf, while the Pacific type continental margin incorporates a narrow shelf and slope descending into a deep trench.[31] Since low-sloping coastal regions should retreat faster than higher-sloping regions, the Atlantic coast is more vulnerable to sea level rise than the Pacific coast.[32]
Society[]
The rise in sea level along coastal regions carries implications for a wide range of habitats and inhabitants. Firstly, rising sea levels will have a serious impact on beaches— a place which humans love to visit recreationally and a prime location for real estate. It is ideal to live on the coast, due to a more moderate climate and pleasant scenery, but beachfront property is at risk from eroding land and rising sea levels. Since the threat posed by rising sea levels has become more prominent, property owners and local government have taken measures to prepare for the worst. For example, "Maine has enacted a policy declaring that shorefront buildings will have to be moved to enable beaches and wetlands to migrate inland to higher ground."[29] Additionally, many coastal states add sand to their beaches to offset shore erosion, and many property owners have elevated their structures in low-lying areas. As a result of the erosion and ruin of properties by large storms on coastal lands, governments have looked into buying land and having residents relocate further inland.[33] The seas now absorb much of human-generated carbon dioxide, which then affects temperature change. The oceans store 93 percent of that energy[34] which helps keep the planet livable by moderating temperatures.
Another important coastal habitat that is threatened by sea level rise is wetlands, which "occur along the margins of estuaries and other shore areas that are protected from the open ocean and include swamps, tidal flats, coastal marshes and bayous."[35] Wetlands are extremely vulnerable to rising sea levels, since they are within several feet of sea level. The threat posed to wetlands is serious, due to the fact that they are highly productive ecosystems, and they have an enormous impact on the economy of surrounding areas. Wetlands in the U.S. are rapidly disappearing due to an increase in housing, industry, and agriculture, and rising sea levels contribute to this dangerous trend. As a result of rising sea levels, the outer boundaries of wetlands tend to erode, forming new wetlands more inland. According to the EPA, "the amount of newly created wetlands, however, could be much smaller than the lost area of wetlands— especially in developed areas protected with bulkheads, dikes, and other structures that keep new wetlands from forming inland."[36] When estimating a sea level rise within the next century of 50 cm (20 inches), the U.S. would lose 38% to 61% of its existing coastal wetlands.[37]
A rise in sea level will have a negative impact not only on coastal property and economy but on our supply of fresh water. According to the EPA, "Rising sea level increases the salinity of both surface water and ground water through salt water intrusion."[36] Coastal estuaries and aquifers, therefore, are at a high risk of becoming too saline from rising sea levels. With respect to estuaries, an increase in salinity would threaten aquatic animals and plants that cannot tolerate high levels of salinity. Aquifers often serve as a primary water supply to surrounding areas, such as Florida's Biscayne aquifer, which receives freshwater from the Everglades and then supplies water to the Florida Keys. Rising sea levels would submerge low-lying areas of the Everglades, and salinity would greatly increase in portions of the aquifer.[36] The considerable rise in sea level and the decreasing amounts of freshwater along the Atlantic and Gulf coasts would make those areas rather uninhabitable. Many economists predict that global warming will be one of the main economic threats to the West Coast, specifically in California. "Low-lying coastal areas, such as along the Gulf Coast, are particularly vulnerable to sea-level rise and stronger storms—and those risks are reflected in rising insurance rates and premiums. In Florida, for example, the average price of a homeowners' policy increased by 77 percent between 2001 and 2006."[38]
Global issue[]
Since rising sea levels present a pressing problem not only to coastal communities but to the whole global population as well, much scientific research has been performed to analyze the causes and consequences of a rise in sea level. The U.S. Geological Survey has conducted such research, addressing coastal vulnerability to sea level rise and incorporating six physical variables to analyze the changes in sea level: geomorphology; coastal slope (percent); rate of relative sea level rise (mm/yr); shoreline erosion and acceleration rates (m/yr); mean tidal range (m); and mean wave height (m).[39] The research was conducted on the various coasts of the U.S., and the results are very useful for future reference. Along the Pacific coast, the most vulnerable areas are low-lying beaches, and "their susceptibility is primarily a function of geomorphology and coastal slope."[40] With regard to research performed along the Atlantic coast, the most vulnerable areas to sea level rise were found to be along the Mid-Atlantic coast (Maryland to North Carolina) and Northern Florida, since these are "typically high-energy coastlines where the regional coastal slope is low and where the major landform type is a barrier island."[41] For the Gulf coast, the most vulnerable areas are along the Louisiana-Texas coast. According to the results, "the highest-vulnerability areas are typically lower-lying beach and marsh areas; their susceptibility is primarily a function of geomorphology, coastal slope and rate of relative sea-level rise."[42]
Many humanitarians and environmentalists believe that political policy needs to have a bigger role in carbon dioxide reduction. Humans have a substantial influence on the rise of sea level because we emit increasing levels of carbon dioxide into the atmosphere through automobile use and industry. A higher amount of carbon dioxide in the atmosphere leads to higher global temperatures, which then results in thermal expansion of seawater and melting of glaciers and ice sheets.
Ocean currents[]
The currents in the world's oceans are a result of varying temperatures associated with the changing latitudes of our planet. As the atmosphere is warmed nearest the equator, the hot air at the surface of our planet is heated, causing it to rise and draw in cooler air to take its place, creating what is known as circulation cells.[43] This ultimately causes the air to be significantly colder near the poles than at the equator.
Wind patterns associated with these circulation cells drive surface currents[44] which push the surface water to the higher latitudes where the air is colder. This cools the water down enough to where it is capable of dissolving more gasses and minerals, causing it to become very dense in relation to lower latitude waters, which in turn causes it to sink to the bottom of the ocean, forming what is known as North Atlantic Deep Water (NADW) in the north and Antarctic Bottom Water (AABW) in the south.[45] Driven by this sinking and the upwelling that occurs in lower latitudes, as well as the driving force of the winds on surface water, the ocean currents act to circulate water throughout the entire sea. When global warming is added into the equation, changes occur, especially in the regions where deep water is formed. With the warming of the oceans and subsequent melting of glaciers and the polar ice caps, more and more fresh water is released into the high latitude regions where deep water is formed. This extra water that gets thrown into the chemical mix dilutes the contents of the water arriving from lower latitudes, reducing the density of the surface water. Consequently, the water sinks more slowly than it normally would.[46]
In 2021 scientists find signs of possible transition of the Atlantic meridional overturning circulation to the weak mode of circulation due to climate change in the next 10 - 50 years. The currents move in the slowest speed at the latest 1600 years. Such change will cause severe disasters by: "severely disrupting the rains that billions of people depend on for food in India, South America and West Africa; increasing storms and lowering temperatures in Europe; and pushing up the sea level off eastern North America. It would also further endanger the Amazon rainforest and Antarctic ice sheets".[47]
It is important to note that ocean currents provide the necessary nutrients for life to sustain itself in the lower latitudes.[48] Should the currents slow down, fewer nutrients would be brought to sustain ocean life resulting in a crumbling of the food chain and irreparable damage to the marine ecosystem. Slower currents would also mean less carbon fixation. Naturally, the ocean is the largest sink within which carbon is stored. When waters become saturated with carbon, excess carbon has nowhere to go, because the currents are not bringing up enough fresh water to fix the excess. This causes a rise in atmospheric carbon dioxide which in turn causes positive feedback that can lead to a runaway greenhouse effect.[49]
Weather[]
Global warming also affects weather patterns as they pertain to cyclones. Scientists have found that although there have been fewer cyclones than in the past, the intensity of each cyclone has increased.[50] A simplified definition of what global warming means for the planet is that colder regions would get warmer and warmer regions would get much warmer.[51] However, there is also speculation that the complete opposite could be true. A warmer earth could serve to moderate temperatures worldwide. There is still much that is not understood about the earth's climate, because it is very difficult to make climate models. As such, predicting the effects that global warming might have on our planet is still an inexact science.[52] Global warming is also causing the amount of hazards on the ocean to increase. It has increased the amount of fog at sea level, making it harder for ships to navigate without crashing into other boats or other objects in the ocean. The warmness and dampness of the ground is causing the fog to come closer to the surface level of the ocean. As the rain falls it makes the ground wet, then the warm air rises leaving a layer of cold air that turns into fog causing an unsafe ocean for travel and for working conditions on the ocean.[53] It is also causing the ocean to create more floods due to the fact that it is warming up and the glaciers from the ice age are now melting causing the sea levels to rise, which causes the ocean to take over part of the land and beaches.[54] Glaciers are melting at an alarming rate which is causing the ocean to rise faster than predicted. Inside of this ice there are traces of bubbles that are filled with CO2 that are then released into the atmosphere when they melt causing the greenhouse effect to grow at an even faster rate.[55]
Regional weather patterns across the globe are also changing due to tropical ocean warming. The Indo-Pacific warm pool has been warming rapidly and expanding during the recent decades, largely in response to increased carbon emissions from fossil fuel burning.[56] The warm pool expanded to almost double its size, from an area of 22 million km2 during 1900–1980, to an area of 40 million km2 during 1981–2018.[57] This expansion of the warm pool has altered global rainfall patterns, by changing the life cycle of the Madden Julian Oscillation (MJO), which is the most dominant mode of weather fluctuation originating in the tropics.
Seafloor[]
It is known that climate affects the ocean and the ocean affects the climate. Due to climate change, as the ocean gets warmer this too has an effect on the seafloor. Because of greenhouse gases such as carbon dioxide, this warming will have an effect on the bicarbonate buffer of the ocean. The bicarbonate buffer is the concentration of bicarbonate ions that keeps the ocean's acidity balanced within a pH range of 7.5–8.4.[58] Addition of carbon dioxide to the ocean water makes the oceans more acidic. Increased ocean acidity is not good for the planktonic organisms that depend on calcium to form their shells. Calcium dissolves with very weak acids and any increase in the ocean's acidity will be destructive for the calcareous organisms. Increased ocean acidity will lead to decreased Calcite Compensation Depth (CCD), causing calcite to dissolve in shallower waters.[58] This will then have a great effect on the calcareous ooze in the ocean, because the sediment itself would begin to dissolve.
If ocean temperatures rise it will have an effect right beneath the ocean floor and it will allow the addition of another greenhouse gas, methane gas. Methane gas has been found under methane hydrate, frozen methane and water, beneath the ocean floor. With the ocean warming, this methane hydrate will begin to melt and release methane gas, contributing to global warming.[59] However, recent research has found that CO2 uptake outpaces methane release in these areas of the ocean causing overall decreases in global warming.[60]
Chemical effects[]
Ocean acidification[]

2 between the 1700s and the 1990s, from the Global Ocean Data Analysis Project (GLODAP) and the World Ocean Atlas


2 on transect line 5 off Pt. St. George, California. The potential density surfaces are superimposed on the temperature section. The 26.2 potential density surface delineates the location of the first instance in which the undersaturated water is upwelled from depths of 150 to 200 m onto the shelf and outcropping at the surface near the coast. The red dots represent sample locations.[61]

Ocean acidification is the ongoing decrease in the pH value of the Earth's oceans, caused by the uptake of carbon dioxide (CO
2) from the atmosphere.[62] The main cause of ocean acidification is the burning of fossil fuels. Ocean acidification is one of several effects of climate change on oceans. Seawater is slightly basic (meaning pH > 7), and ocean acidification involves a shift towards pH-neutral conditions rather than a transition to acidic conditions (pH < 7).[63] The concern with ocean acidification is that it can lead to the decreased production of the shells of shellfish and other aquatic life with calcium carbonate shells, as well as some other physiological challenges for marine organisms. The calcium carbonate shelled organisms can not reproduce under high saturated acidotic waters. An estimated 30–40% of the carbon dioxide from human activity released into the atmosphere dissolves into oceans, rivers and lakes.[64][65] Some of it reacts with the water to form carbonic acid. Some of the resulting carbonic acid molecules dissociate into a bicarbonate ion and a hydrogen ion, thus increasing ocean acidity (H+ ion concentration).
Between 1751 and 1996, the pH value of the ocean surface is estimated to have decreased from approximately 8.25 to 8.14,[66] representing an increase of almost 30% in H+ ion concentration in the world's oceans (note the pH scale is logarithmic so a change of one in pH unit is equivalent to a ten fold change in H+ ion concentration).[67][68] Increasing acidity is thought to have a range of potentially harmful consequences for marine organisms such as depressing metabolic rates and immune responses in some organisms and causing coral bleaching.[69] By increasing the presence of free hydrogen ions, the additional carbonic acid that forms in the oceans ultimately results in the conversion of carbonate ions into bicarbonate ions. Ocean alkalinity (roughly equal to [HCO3−] + 2[CO32−]) is not changed by the process, or may increase over long time periods due to carbonate dissolution.[70] This net decrease in the amount of carbonate ions available may make it more difficult for marine calcifying organisms, such as coral and some plankton, to form biogenic calcium carbonate, and such structures become vulnerable to dissolution.[71] Ongoing acidification of the oceans may threaten future food chains linked with the oceans.[72][73]
Ocean acidification has been compared to anthropogenic climate change and called the "evil twin of global warming"[74][75][76][77][78] and "the other CO
2 problem".[75][77][79] Freshwater bodies also appear to be acidifying, although this is a more complex and less obvious phenomenon.[80][81] To ensure that ocean acidification is minimized, the United Nation's Sustainable Development Goal 14 ("Life below Water") aims to ensure that oceans are conserved and sustainably used.[82] As members of the InterAcademy Panel, 105 science academies have issued a statement on ocean acidification recommending that by 2050, global CO
2 emissions be reduced by at least 50% compared to the 1990 level.[83]
Oxygen depletion[]
Ocean deoxygenation is the reduction of the oxygen content of the oceans due to human activities[88] as a consequence of anthropogenic emissions of carbon dioxide[89][90] and eutrophication driven excess production.[88] It is manifest in the increasing number of coastal and estuarine hypoxic areas, or dead zones, and the expansion of oxygen minimum zones in the world's oceans. The decrease in oxygen content of the oceans has been fairly rapid and poses a threat to all aerobic marine life, as well as to people who depend on marine life for nutrition or livelihood.[91][92][93][94]
Oceanographers and others have discussed what phrase best describes the phenomenon to non-specialists. Among the options considered have been ocean suffocation (which was used in a news report from May 2008[95]), "ocean oxygen deprivation",[96] "decline in ocean oxygen", "marine deoxygenation", "ocean oxygen depletion" and "ocean hypoxia". The term “Ocean Deoxygenation” has been used increasingly by international scientific bodies because it captures the decreasing trend of the world ocean’s oxygen inventory [88]Other[]
A report from NOAA scientists published in the journal Science in May 2008 found that large amounts of relatively acidified water are upwelling to within four miles of the Pacific continental shelf area of North America. This area is a critical zone where most local marine life lives or is born. While the paper dealt only with areas from Vancouver to northern California, other continental shelf areas may be experiencing similar effects.[97]
A related issue is the methane clathrate reservoirs found under sediments on the ocean floors. These trap large amounts of the greenhouse gas methane, which ocean warming has the potential to release. In 2004 the global inventory of ocean methane clathrates was estimated to occupy between one and five million cubic kilometres.[98] If all these clathrates were to be spread uniformly across the ocean floor, this would translate to a thickness between three and fourteen metres.[99] This estimate corresponds to 500–2500 gigatonnes carbon (Gt C), and can be compared with the 5000 Gt C estimated for all other fossil fuel reserves.[98][100]
Effects on marine life[]

Research indicates that increasing ocean temperatures are taking a toll on the marine ecosystem. A study on phytoplankton changes in the Indian Ocean indicates a decline of up to 20% in marine phytoplankton during the past six decades.[101] During the summer, the western Indian Ocean is home to one of the largest concentrations of marine phytoplankton blooms in the world when compared to other oceans in the tropics. Increased warming in the Indian Ocean enhances ocean stratification, which prevents nutrient mixing in the euphotic zone where there is ample light available for photosynthesis. Thus, primary production is constrained and the region's entire food web is disrupted. If rapid warming continues, experts predict that the Indian Ocean will transform into an ecological desert and will no longer be productive.[101] The same study also addresses the abrupt decline of tuna catch rates in the Indian Ocean during the past half century. This decrease is mostly due to increased industrial fisheries, with ocean warming adding further stress to the fish species. These rates show a 50-90% decrease over 5 decades.[101]
A study that describes climate-driven trends in contemporary ocean productivity looked at global-ocean net primary production (NPP) changes detected from satellite measurements of ocean color from 1997 to 2006.[102] These measurements can be used to quantify ocean productivity on a global scale and relate changes to environmental factors. They found an initial increase in NPP from 1997 to 1999 followed by a continuous decrease in productivity after 1999. These trends are propelled by the expansive stratified low-latitude oceans and are closely linked to climate variability. This relationship between the physical environment and ocean biology effects the availability of nutrients for phytoplankton growth since these factors influence variations in upper-ocean temperature and stratification.[102] The downward trends of ocean productivity after 1999 observed in this study can give insight into how climate change can affect marine life in the future.
As stated before, marine life has been decreasing in percentage as the time goes on due to the increase in ocean pollution being the main component plastic that is eaten by marine animals.[103] Along with marine life, humans are also being affected by ocean pollution. One of the biggest animal protein industries, as it is the seafood industry, is affected since marine life has been decreasing and it is predicted that if they continue using the harmful techniques that are being used, by 2048 there is the possibility of an ocean without fish.[104] The seafood industry has a big impact in the world's food industry, providing food for approximately 3 billion people.[105] One of the many famous and trending diets that are out there are the pescatarian diet, in which vegetarian diets followers add fish or other types of seafood in order to obtain the nutrients from the fish.[106] If it comes to the point in which the seafood industry keep growing, as more people are joining this type of food trends and eating more fish (more demand means more production[107]), and using techniques that deteriorate the marine life beyond catching the animals we will end up at the point of no return: where the marine life is extinct and we as humans will not be able to consume such as good source of protein in order to meet the required necessities. The ocean pollution does not mean that only marine life is being damaged, but also that we as humans will deprive ourselves from a great privilege as it is seafood and marine life.
Future impacts on marine life[]


A temperature rise of 1.5 °C above preindustrial levels is projected[according to whom?] to make existence impossible for 10% of fishes in their typical geographical range. A temperature rise of 5 °C above this level is projected to make existence impossible for 60% of fishes in their geographical range. The main reason is Oxygen depletion as one of the consequences of the rise in temperature. Further, the change in temperature and decrease in oxygen is expected to occur too quickly for effective adaptation of affected species. Fishes can migrate to cooler places, but there are not always appropriate .[108]
Increase of water temperature will also have a devastating effect on different oceanic ecosystems like coral reefs. The direct effect is the coral bleaching of these reefs, which live within a narrow temperature margin, so a small increase in temperature would have a drastic effects in these environments. When corals bleach it is because the coral loses 60–90% of their zooxanthellae due to various stressors, ocean temperature being one of them. If the bleaching is prolonged, the coral host would die.[109]
Although uncertain, another effect of climate change may be the growth, toxicity, and distribution of harmful algal blooms.[110] These algal blooms have serious effects on not only marine ecosystems, killing sea animals and fish with their toxins, but also for humans as well. Some of these blooms deplete the oxygen around them to levels low enough to kill fish.
See also[]
- Effects of global warming on marine mammals
- History of climate change science
- Index of climate change articles
- Marine heatwave
- Polar ice packs
- Shutdown of thermohaline circulation
- Special Report on the Ocean and Cryosphere in a Changing Climate
 Climate change portal
 Oceans portal
References[]
- ^ Cheng, Lijing; Abraham, John; Hausfather, Zeke; Trenberth, Kevin E. (2019). "How fast are the oceans warming?". Science. 363 (6423): 128–129. Bibcode:2019Sci...363..128C. doi:10.1126/science.aav7619. ISSN 0036-8075. PMID 30630919. S2CID 57825894.
- ^ Humphreys, M. P. (2016). "Climate sensitivity and the rate of ocean acidification: future impacts, and implications for experimental design". ICES Journal of Marine Science. 74 (4): 934–940. doi:10.1093/icesjms/fsw189.
- ^ Jump up to: a b USGCRP (2017). "Climate Science Special Report. Chapter 12: Sea Level Rise". science2017.globalchange.gov. Retrieved 2018-12-27.
- ^ Jump up to: a b c WCRP Global Sea Level Budget Group (2018). "Global sea-level budget 1993–present". Earth System Science Data. 10 (3): 1551–1590. Bibcode:2018ESSD...10.1551W. doi:10.5194/essd-10-1551-2018.
This corresponds to a mean sea-level rise of about 7.5 cm over the whole altimetry period. More importantly, the GMSL curve shows a net acceleration, estimated to be at 0.08mm/yr2.
- ^ Mengel, Matthias; Levermann, Anders; Frieler, Katja; Robinson, Alexander; Marzeion, Ben; Winkelmann, Ricarda (8 March 2016). "Future sea level rise constrained by observations and long-term commitment". Proceedings of the National Academy of Sciences. 113 (10): 2597–2602. Bibcode:2016PNAS..113.2597M. doi:10.1073/pnas.1500515113. PMC 4791025. PMID 26903648.
- ^ Climate Change 2014 Synthesis Report Fifth Assessment Report, AR5 (Report). Intergovernmental Panel on Climate Change. 2014. Under all RCP scenarios, the rate of sea level rise will very likely exceed the rate of 2.0 [1.7–2.3] mm/yr observed during 1971–2010
- ^ "Chapter 4: Sea Level Rise and Implications for Low-Lying Islands, Coasts and Communities — Special Report on the Ocean and Cryosphere in a Changing Climate". Retrieved 2021-04-18.
- ^ IPCC, "Summary for Policymakers", Contribution of Working Group I to the Fourth Assessment Report of the Intergovernmental Panel on Climate Change, 2007, page 13-14"Models used to date do not include uncertainties in climate-carbon cycle feedback nor do they include the full effects of changes in ice sheet flow, because a basis in published literature is lacking."
- ^ Mooney, Chris. "Scientists keep upping their projections for how much the oceans will rise this century". The Washington Post.
- ^ Bamber, Jonathan L.; Oppenheimer, Michael; Kopp, Robert E.; Aspinall, Willy P.; Cooke, Roger M. (June 4, 2019). "Ice sheet contributions to future sea-level rise from structured expert judgment". Proceedings of the National Academy of Sciences. 116 (23): 11195–11200. Bibcode:2019PNAS..11611195B. doi:10.1073/pnas.1817205116. PMC 6561295. PMID 31110015.
- ^ Global and Regional Sea Level Rise Scenarios for the United States (PDF) (Report) (NOAA Technical Report NOS CO-OPS 083 ed.). National Oceanic and Atmospheric Administration. January 2017. p. vi. Retrieved 24 August 2018."The projections and results presented in several peer-reviewed publications provide evidence to support a physically plausible GMSL rise in the range of 2.0 meters (m) to 2.7 m, and recent results regarding Antarctic ice-sheet instability indicate that such outcomes may be more likely than previously thought."
- ^ Grinsted, Aslak; Christensen, Jens Hesselbjerg (2021-02-02). "The transient sensitivity of sea level rise". Ocean Science. 17 (1): 181–186. Bibcode:2021OcSci..17..181G. doi:10.5194/os-17-181-2021. ISSN 1812-0784. S2CID 234353584.
- ^ "The strange science of melting ice sheets: three things you didn't know". The Guardian. 12 September 2018.
- ^ Bindoff, N.L.; Willebrand, J.; Artale, V.; Cazenave, A.; Gregory, J.; Gulev, S.; Hanawa, K.; Le Quéré, C.; Levitus, S.; Nojiri, Y.; Shum, C.K.; Talley L.D.; Unnikrishnan, A. (2007), "Section 5.5.1: Introductory Remarks", in IPCC AR4 WG1 (ed.), Chapter 5: Observations: Ocean Climate Change and Sea Level, ISBN 978-0-521-88009-1, retrieved 25 January 2017
- ^ Box SYN-1: Sustained warming could lead to severe impacts, p. 5, in: Synopsis, in National Research Council 2011
- ^ TAR Climate Change 2001: The Scientific Basis (PDF) (Report). International Panel on Climate Change, Cambridge University Press. 2001. ISBN 0521-80767-0. Retrieved 23 July 2021.
- ^ "Sea level to increase risk of deadly tsunamis". UPI. 2018.
- ^ Holder, Josh; Kommenda, Niko; Watts, Jonathan (3 November 2017). "The three-degree world: cities that will be drowned by global warming". The Guardian. Retrieved 2018-12-28.
- ^ "Sea Level Rise". National Geographic. January 13, 2017.
- ^ Thomsen, Dana C.; Smith, Timothy F.; Keys, Noni (2012). "Adaptation or Manipulation? Unpacking Climate Change Response Strategies". Ecology and Society. 17 (3). doi:10.5751/es-04953-170320. JSTOR 26269087.
- ^ "Sea level rise poses a major threat to coastal ecosystems and the biota they support". birdlife.org. Birdlife International. 2015.
- ^ Nicholls, Robert J.; Cazenave, Anny (18 June 2010). "Sea-Level Sea-Level Rise and Its Impact on Coastal Zones". Science Magazine. 328 (5985): 1517–1520. Bibcode:2010Sci...328.1517N. doi:10.1126/science.1185782. PMID 20558707. S2CID 199393735.
- ^ Cazenave, Anny; Llovel, William (2010). "Contemporary Sea Level Rise". Annu. Rev. Mar. Sci. 2: 145–173. Bibcode:2010ARMS....2..145C. doi:10.1146/annurev-marine-120308-081105. PMID 21141661.
- ^ State of the Climate in 2008
- ^ Gardner, Alex S.; Moholdt, Geir; Cogley, J. Graham; et al. (2013). "A Reconciled Estimate of Glacier Contributions to Sea Level Rise: 2003 to 2009" (PDF). Science. 340 (6134): 852–857. Bibcode:2013Sci...340..852G. doi:10.1126/science.1234532. PMID 23687045. S2CID 206547524.
- ^ Sedláček, Jan; Mysak, Lawrence A. (2009). "A model study of the Little Ice Age and beyond: changes in ocean 'heat content', hydrography and circulation since 1500" (PDF). Climate Dynamics. 33 (4): 461–475. Bibcode:2009ClDy...33..461S. doi:10.1007/s00382-008-0503-6. hdl:20.500.11850/86413. S2CID 128424704.
- ^ </http://www.ipcc.ch/report/ar5/wg1/>
- ^ Rare Burst of Melting Seen in Greenland's Ice Sheet July 24, 2012 The New York Times
- ^ Jump up to: a b (Titus 1989, p. 119)
- ^ Jump up to: a b "Coastal Zones and Sea Level Rise," U.S. Environmental Protection Agency, 14 April 2011
- ^ Tripati, Aradhna, Lab 5¬-Istostasy, Physiography Reading, E&SSCI15-1, UCLA, 2012
- ^ "National Assessment of Coastal Vulnerability to Sea-Level Rise: Preliminary Results for the U.S. Pacific Coast," U.S. Geological Survey, 2001
- ^ Robertson, Ricky. "Crop Changes National Geographic". National Geographic. Madison. Retrieved 3 March 2016.
- ^ Chris Mooney and Brady Dennis, Startling new research finds large buildup of heat in the oceans, suggesting a faster rate of global warming WaPo, Oct. 31, 2018.
- ^ (Trujillo & Thurman 2005, p. 335)
- ^ Jump up to: a b c "Coastal Zones and Sea Level Rise," EPA
- ^ (Trujillo & Thurman 2005, p. 336)
- ^ Coplin, Kelly. "How Climate Change Will Affect Home Value". Stanford University. Retrieved 2013-10-27.
- ^ "National Assessment of Coastal Vulnerability to Sea-Level Rise: Preliminary Results for the U.S. Pacific Coast," USGS
- ^ National Assessment of Coastal Vulnerability to Sea-Level Rise: Preliminary Results for the U.S. Pacific Coast, USGS
- ^ "National Assessment of Coastal Vulnerability to Sea-Level Rise: Preliminary Results for the U.S. Atlantic Coast," USGS
- ^ "National Assessment of Coastal Vulnerability to Sea-Level Rise: Preliminary Results for the U.S. Gulf of Mexico Coast," USGS
- ^ (Trujillo & Thurman 2008, p. 172)
- ^ (Trujillo & Thurman 2008, p. 207)
- ^ Talley, L. (2000). Sio 210 talley topic 5: North Atlantic circulation and water masses. thermohaline forcing.
- ^ Roach, J. (2005, June 27). Global warming may alter atlantic currents, study says.
- ^ Carrington, Damian (5 August 2021). "Climate crisis: Scientists spot warning signs of Gulf Stream collapse". Guardian. Retrieved 6 August 2021.
- ^ (Trujillo & Thurman 2008, p. 216)
- ^ Canadell, J. G. et al (2007, November 01). Is the ocean carbon sink sinking?
- ^ Webster, P. J. et al. (2005). Changes in tropical cyclone number, duration, and intensity in a warming environment.
- ^ (Trujillo & Thurman 2008, p. 194)
- ^ (Trujillo & Thurman 2008, p. 195)
- ^ Renner, Jeff (1993). Northwest marine weather. the Mountaineers. pp. 71–72.
- ^ Collier, Michael (2002). Floods, Droughts, and Climate Change. The University of Arizona Press. pp. 13–19.
- ^ Archer, David (2009). The Long Thaw. Princeton University Press. pp. 69–77.
- ^ Weller, Evan; Min, Seung-Ki; Cai, Wenju; Zwiers, Francis W.; Kim, Yeon-Hee; Lee, Donghyun (July 2016). "Human-caused Indo-Pacific warm pool expansion". Science Advances. 2 (7): e1501719. Bibcode:2016SciA....2E1719W. doi:10.1126/sciadv.1501719. ISSN 2375-2548. PMC 4942332. PMID 27419228.
- ^ Roxy, M. K.; Dasgupta, Panini; McPhaden, Michael J.; Suematsu, Tamaki; Zhang, Chidong; Kim, Daehyun (November 2019). "Twofold expansion of the Indo-Pacific warm pool warps the MJO life cycle". Nature. 575 (7784): 647–651. Bibcode:2019Natur.575..647R. doi:10.1038/s41586-019-1764-4. ISSN 0028-0836. OSTI 1659516. PMID 31776488. S2CID 208329374.
- ^ Jump up to: a b Tripati, Aradhna, Lab 5-Ocean pH, Ocean pH Reading, E&SSCI15-1, UCLA, 2012
- ^ University Of Wyoming (2004, January 13). 2004/01/040113080810.htm Ocean Floor Reveals Clues To Global Warming. ScienceDaily. Retrieved May 21, 2012
- ^ Pohlman, John W.; Greinert, Jens; Ruppel, Carolyn; Silyakova, Anna; Vielstadte, Lisa; Casso, Michael; Mienert, Jurgen; Bunz, Stefan (May 8, 2017). "Enhanced CO2 uptake at a shallow Arctic Ocean seep field overwhelms the positive warming potential of emitted methane". PNAS. 114 (21): 5355–5360. Bibcode:2017PNAS..114R5355P. doi:10.1073/pnas.1618926114. PMC 5448205. PMID 28484018.
- ^ Feely, R. A.; Sabine, C. L.; Hernandez-Ayon, J. M.; Ianson, D.; Hales, B. (June 2008). "Evidence for upwelling of corrosive "acidified" water onto the continental shelf". Science. 320 (5882): 1490–2. Bibcode:2008Sci...320.1490F. CiteSeerX 10.1.1.328.3181. doi:10.1126/science.1155676. PMID 18497259. S2CID 35487689. Retrieved 2014-01-25 – via Pacific Marine Environmental Laboratory (PMEL).
- ^ Caldeira, K.; Wickett, M. E. (2003). "Anthropogenic carbon and ocean pH". Nature. 425 (6956): 365. Bibcode:2001AGUFMOS11C0385C. doi:10.1038/425365a. PMID 14508477. S2CID 4417880.
- ^ "Ocean Acidification". https://www.whoi.edu/. Retrieved 2021-09-13. External link in
|website=(help) - ^ Millero, Frank J. (1995). "Thermodynamics of the carbon dioxide system in the oceans". Geochimica et Cosmochimica Acta. 59 (4): 661–677. Bibcode:1995GeCoA..59..661M. doi:10.1016/0016-7037(94)00354-O.
- ^ Feely, R. A.; Sabine, C. L.; Lee, K.; Berelson, W.; Kleypas, J.; Fabry, V. J.; Millero, F. J. (July 2004). "Impact of Anthropogenic CO2 on the CaCO3 System in the Oceans". Science. 305 (5682): 362–366. Bibcode:2004Sci...305..362F. doi:10.1126/science.1097329. PMID 15256664. S2CID 31054160. Retrieved 2014-01-25 – via Pacific Marine Environmental Laboratory (PMEL).
- ^ Jacobson, M. Z. (2005). "Studying ocean acidification with conservative, stable numerical schemes for nonequilibrium air-ocean exchange and ocean equilibrium chemistry". Journal of Geophysical Research: Atmospheres. 110: D07302. Bibcode:2005JGRD..11007302J. doi:10.1029/2004JD005220.
- ^ Hall-Spencer, J. M.; Rodolfo-Metalpa, R.; Martin, S.; et al. (July 2008). "Volcanic carbon dioxide vents show ecosystem effects of ocean acidification". Nature. 454 (7200): 96–9. Bibcode:2008Natur.454...96H. doi:10.1038/nature07051. hdl:10026.1/1345. PMID 18536730. S2CID 9375062.
- ^ "Report of the Ocean Acidification and Oxygen Working Group, International Council for Science's Scientific Committee on Ocean Research (SCOR) Biological Observatories Workshop" (PDF).
- ^ Anthony, KRN; et al. (2008). "Ocean acidification causes bleaching and productivity loss in coral reef builders". Proceedings of the National Academy of Sciences. 105 (45): 17442–17446. Bibcode:2008PNAS..10517442A. doi:10.1073/pnas.0804478105. PMC 2580748. PMID 18988740.
- ^ Kump, L.R.; Bralower, T.J.; Ridgwell, A. (2009). "Ocean acidification in deep time". Oceanography. 22: 94–107. doi:10.5670/oceanog.2009.10. Retrieved 16 May 2016.
- ^ Orr, James C.; et al. (2005). "Anthropogenic ocean acidification over the twenty-first century and its impact on calcifying organisms" (PDF). Nature. 437 (7059): 681–686. Bibcode:2005Natur.437..681O. doi:10.1038/nature04095. PMID 16193043. S2CID 4306199. Archived from the original (PDF) on 25 June 2008.
- ^ Cornelia Dean (30 January 2009). "Rising Acidity Is Threatening Food Web of Oceans, Science Panel Says". New York Times.
- ^ Robert E. Service (13 July 2012). "Rising Acidity Brings and Ocean Of Trouble". Science. 337 (6091): 146–148. Bibcode:2012Sci...337..146S. doi:10.1126/science.337.6091.146. PMID 22798578.
- ^ "Ocean Acidification Is Climate Change's 'Equally Evil Twin,' NOAA Chief Says". Huffington Post. 9 July 2012. Archived from the original on 12 July 2012. Retrieved 2012-07-09.
- ^ Jump up to: a b Nina Notman (29 July 2014). "The other carbon dioxide problem". Chemistry World.
- ^ Alex Rogers (9 October 2013). "Global warming's evil twin: ocean acidification". The Conversation.
- ^ Jump up to: a b Hennige, S.J. (2014). "Short-term metabolic and growth responses of the cold-water coral Lophelia pertusa to ocean acidification". Deep-Sea Research Part II. 99: 27–35. Bibcode:2014DSRII..99...27H. doi:10.1016/j.dsr2.2013.07.005.
- ^ Pelejero, C. (2010). "Paleo-perspectives on ocean acidification". Trends in Ecology and Evolution. 25 (6): 332–344. doi:10.1016/j.tree.2010.02.002. PMID 20356649.
- ^ Doney, S.C. (2009). "Ocean Acidification: The Other CO
2 Problem". Annual Review of Marine Science. 1: 169–192. Bibcode:2009ARMS....1..169D. doi:10.1146/annurev.marine.010908.163834. PMID 21141034. S2CID 402398. - ^ Gies, E. (11 January 2018). "Like Oceans, Freshwater Is Also Acidifying". Scientific American. Retrieved 2018-01-13.
- ^ Weiss, L. C.; Pötter, L.; Steiger, A.; Kruppert, S.; Frost, U.; Tollrian, R. (2018). "Rising pCO2 in Freshwater Ecosystems Has the Potential to Negatively Affect Predator-Induced Defenses in Daphnia". Current Biology. 28 (2): 327–332.e3. doi:10.1016/j.cub.2017.12.022. PMID 29337079.
- ^ "Goal 14 targets". UNDP. Retrieved 2020-09-24.
- ^ IAP (June 2009). "Interacademy Panel (IAP) Member Academies Statement on Ocean Acidification"., Secretariat: TWAS (the Academy of Sciences for the Developing World), Trieste, Italy.
- ^ Zeebe, R.E. (2012). "History of Seawater Carbonate Chemistry, Atmospheric CO
2, and Ocean Acidification". Annual Review of Earth and Planetary Sciences. 40 (1): 141–165. Bibcode:2012AREPS..40..141Z. doi:10.1146/annurev-earth-042711-105521. S2CID 18682623. - ^ Henehan, Michael J.; Ridgwell, Andy; Thomas, Ellen; Zhang, Shuang; Alegret, Laia; Schmidt, Daniela N.; Rae, James W. B.; Witts, James D.; Landman, Neil H.; Greene, Sarah E.; Huber, Brian T. (2019-10-17). "Rapid ocean acidification and protracted Earth system recovery followed the end-Cretaceous Chicxulub impact". Proceedings of the National Academy of Sciences. 116 (45): 22500–22504. Bibcode:2019PNAS..11622500H. doi:10.1073/pnas.1905989116. ISSN 0027-8424. PMC 6842625. PMID 31636204.
- ^ Carrington, Damian (2019-10-21). "Ocean acidification can cause mass extinctions, fossils reveal". The Guardian. ISSN 0261-3077. Retrieved 2019-10-22.
- ^ Zachos, J.C.; Röhl, U.; Schellenberg, S.A.; Sluijs, A.; Hodell, D.A.; Kelly, D.C.; Thomas, E.; Nicolo, M.; Raffi, I.; Lourens, L. J.; McCarren, H.; Kroon, D. (2005). "Rapid acidification of the ocean during the Paleocene-Eocene thermal maximum". Science. 308 (5728): 1611–1615. Bibcode:2005Sci...308.1611Z. doi:10.1126/science.1109004. hdl:1874/385806. PMID 15947184. S2CID 26909706.
- ^ Jump up to: a b c Laffoley, D; Baxter, JM (2019). Ocean deoxygenation : everyone's problem. Switzerland: Gland. p. 562. ISBN 978-2-8317-2013-5.
- ^ Stramma, L; Johnson, GC; Printall, J; Mohrholz, V (2008). "Expanding Oxygen-Minimum Zones in the Tropical Oceans". Science. 320 (5876): 655–658. Bibcode:2008Sci...320..655S. doi:10.1126/science.1153847. PMID 18451300. S2CID 206510856.
- ^ Mora, C; et al. (2013). "Biotic and Human Vulnerability to Projected Changes in Ocean Biogeochemistry over the 21st Century". PLOS Biology. 11 (10): e1001682. doi:10.1371/journal.pbio.1001682. PMC 3797030. PMID 24143135.
- ^ Oceans suffocating as huge dead zones quadruple since 1950, scientists warn The Guardian, 2018
- ^ Ocean's Oxygen Starts Running Low
- ^ Finding forced trends in oceanic oxygen
- ^ How global warming is causing ocean oxygen levels to fall
- ^ "Ocean Dead Zones Growing; May Be Linked to Warming". National Geographic News. Archived from the original on 2011-07-23. Retrieved May 1, 2008.
- ^ "A problem without a name". Barely Imagined Beings. Retrieved October 13, 2008.
- ^ Feely, R. A.; Sabine, C. L.; Hernandez-Ayon, J. M.; Ianson, D.; Hales, B. (2008). "Evidence for Upwelling of Corrosive "Acidified" Water onto the Continental Shelf". Science. 320 (5882): 1490–2. Bibcode:2008Sci...320.1490F. CiteSeerX 10.1.1.328.3181. doi:10.1126/science.1155676. PMID 18497259. S2CID 35487689.
- ^ Jump up to: a b Milkov, A. V. (2004). "Global estimates of hydrate-bound gas in marine sediments: How much is really out there?". Earth-Science Reviews. 66 (3–4): 183–197. Bibcode:2004ESRv...66..183M. doi:10.1016/j.earscirev.2003.11.002.
- ^ The oceans occupy 361 million sq km
- ^ USGS World Energy Assessment Team, 2000. US Geological Survey world petroleum assessment 2000––description and results. USGS Digital Data Series DDS-60
- ^ Jump up to: a b c Roxy, M.K. (2016). "A reduction in marine primary productivity driven by rapid warming over the tropical Indian Ocean" (PDF). Geophysical Research Letters. 43 (2): 826–833. Bibcode:2016GeoRL..43..826R. doi:10.1002/2015GL066979.
- ^ Jump up to: a b Behrenfeld, Michael J.; O'Malley, Robert T.; Siegel, David A.; McClain, Charles R.; Sarmiento, Jorge L.; Feldman, Gene C.; Milligan, Allen J.; Falkowski, Paul G.; Letelier, Ricardo M.; Boss, Emmanuel S. (December 2006). "Climate-driven trends in contemporary ocean productivity". Nature. 444 (7120): 752–755. Bibcode:2006Natur.444..752B. doi:10.1038/nature05317. PMID 17151666. S2CID 4414391.
- ^ "Marine pollution, explained". National Geographic. 2019-08-02. Retrieved 2020-04-07.
- ^ Humphreys, M. P. (2016). "Climate sensitivity and the rate of ocean acidification: future impacts, and implications for experimental design". ICES Journal of Marine Science. 74 (4): 934–940. doi:10.1093/icesjms/fsw189.
- ^ "Sustainable Seafood | Industries | WWF". World Wildlife Fund. Retrieved 2020-04-07.
- ^ "What is a pescatarian diet?". BBC Good Food. Retrieved 2020-04-07.
- ^ Chappelow, Jim. "Learn about Law of Supply and Demand". Investopedia. Retrieved 2020-04-07.
- ^ Vaughan, Adam (2 July 2020). "Climate change will make world too hot for 60 per cent of fish species". New Scientist. Retrieved 3 July 2020.
- ^ Buchheim, Jason "Coral Reef Bleaching," Odyssey Expeditions Tropical Marine Biology Voyages
- ^ "Harmful Algal Blooms: Simple Plants with Toxic Implications," National Oceanic and Atmospheric Administration.
External links[]
- DISCOVER – satellite-based ocean and climate data since 1979 from NASA
- Effects of climate change
- Oceans