Nevada's 3rd congressional district
| Nevada's 3rd congressional district | |||
|---|---|---|---|
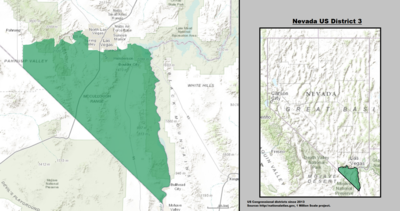 Nevada's 3rd congressional district since January 3, 2013 | |||
| Representative |
| ||
| Population (2019) | 857,197 | ||
| Median household income | $79,169[1] | ||
| Ethnicity |
| ||
| Cook PVI | R+2[2] | ||
Nevada's 3rd congressional district is a congressional district occupying the area south of Las Vegas, including Henderson, Boulder City and much of unincorporated Clark County. The district was initially created after the 2000 census.
It was intended to be a "fair fight" district, and as originally drawn had a relatively equal balance of registered Republicans and registered Democrats. It is currently represented by Democrat Susie Lee. It was one of only a handful of districts to vote for the national Presidential winner in 2004, 2008, 2012, 2016 and 2020 (in each case, by a very narrow margin).[3]
Cities and communities[]
- Las Vegas (part)
- Summerlin South
- Blue Diamond
- Spring Valley (part)
- Enterprise
- Paradise (part)
- Henderson
- Whitney (part)
- Boulder City
- Goodsprings
- Sandy Valley
- Searchlight
- Laughlin
Recent election results from statewide races[]
| Year | U.S. President | U.S. Senator | Governor | Attorney General[4] |
|---|---|---|---|---|
| 2004 | Bush (R): 50 – 49% | [Data unknown/missing] | — | — |
| 2006 | — | [Data unknown/missing] | [Data unknown/missing] | Cortez Masto (D): 56 – 39% |
| 2008 | Obama (D): 55 – 43% | — | — | — |
| 2010 | — | Reid (D): 47.4 – 46.2% | [Data unknown/missing] | Cortez Masto (D): 51 – 39% |
| 2012 | Obama (D): 50 – 49% | Berkley (D): 47.4 – 46.2% | — | — |
| 2014 | — | — | Sandoval (R): 75.9 – 18.7% | — |
| 2016 | Trump (R): 47.5 – 46.5% | Heck (R): 46.8 – 45.4% | — | — |
| 2018 | — | Rosen (D): 49.9 – 46.2% | Sisolak (D): 49.8 – 45.8% | — |
| 2020 | Biden (D): 49.1 – 48.9% | — | — |
List of members representing the district[]
| Member (District home) |
Party | Years | Cong ress |
Electoral history | District location |
|---|---|---|---|---|---|
| District created January 3, 2003 | |||||
 Jon Porter (Boulder City) |
Republican | January 3, 2003 – January 3, 2009 |
108th 109th 110th |
Elected in 2002. Re-elected in 2004. Re-elected in 2006. Lost re-election. |
2003–2013
|
 Dina Titus (Las Vegas) |
Democratic | January 3, 2009 – January 3, 2011 |
111th | Elected in 2008. Lost re-election. | |
 Joe Heck (Henderson) |
Republican | January 3, 2011 – January 3, 2017 |
112th 113th 114th |
Elected in 2010. Re-elected in 2012. Re-elected in 2014. Retired to run for U.S. senator. | |
2013–present
| |||||
 Jacky Rosen (Henderson) |
Democratic | January 3, 2017 – January 3, 2019 |
115th | Elected in 2016. Retired to run for U.S. senator. | |
 Susie Lee (Las Vegas) |
Democratic | January 3, 2019 – present |
116th 117th |
Elected in 2018. Re-elected in 2020. | |
Election results[]
2002[]
| Party | Candidate | Votes | % | ||
|---|---|---|---|---|---|
| Republican | Jon Porter | 100,378 | 56.08 | ||
| Democratic | Dario Herrera | 66,659 | 37.24 | ||
| Independent | Pete O'Neil | 6,842 | 3.82 | ||
| Libertarian | Neil Scott | 3,421 | 1.91 | ||
| Independent American | Richard Wayne O'Dell | 1,694 | 0.95 | ||
| Total votes | 178,994 | 100.0 | |||
| Republican win (new seat) | |||||
2004[]
| Party | Candidate | Votes | % | |
|---|---|---|---|---|
| Republican | Jon Porter (Incumbent) | 162,240 | 54.46 | |
| Democratic | Tom Gallagher | 120,365 | 40.40 | |
| Libertarian | Joseph P. Silvestri | 9,260 | 3.11 | |
| Independent American | Richard Wayne O'Dell | 6,053 | 2.03 | |
| Total votes | 297,918 | 100.0 | ||
| Republican hold | ||||
2006[]
| Party | Candidate | Votes | % | |
|---|---|---|---|---|
| Republican | Jon Porter (Incumbent) | 102,232 | 48.46 | |
| Democratic | Tessa M. Hafen | 98,261 | 46.57 | |
| Independent American | Joshua Hansen | 5,329 | 2.53 | |
| Libertarian | Joseph P. Silvestri | 5,157 | 2.44 | |
| Total votes | 210,979 | 100.0 | ||
| Republican hold | ||||
2008[]
| Party | Candidate | Votes | % | |||
|---|---|---|---|---|---|---|
| Democratic | Dina Titus | 165,912 | 47.43 | |||
| Republican | Jon Porter (Incumbent) | 147,940 | 42.29 | |||
| Independent | Jeffrey C. Reeves | 14,922 | 4.27 | |||
| Libertarian | Joseph P. Silvestri | 10,164 | 2.91 | |||
| Independent American | Floyd Fitzgibbons | 6,937 | 1.98 | |||
| Green | Bob Giaquinta | 3,937 | 1.13 | |||
| Total votes | 349,812 | 100.0 | ||||
| Democratic gain from Republican | ||||||
2010[]
| Party | Candidate | Votes | % | |||
|---|---|---|---|---|---|---|
| Republican | Joe Heck | 128,916 | 48.13 | |||
| Democratic | Dina Titus (Incumbent) | 127,168 | 47.47 | |||
| Independent | Barry Michaels | 6,473 | 2.42 | |||
| Libertarian | Joseph P. Silvestri | 4,026 | 1.50 | |||
| Independent American | Scott David Narter | 1,291 | 0.48 | |||
| Total votes | 267,874 | 100.0 | ||||
| Republican gain from Democratic | ||||||
2012[]
| Party | Candidate | Votes | % | |
|---|---|---|---|---|
| Republican | Joe Heck (Incumbent) | 137,244 | 50.36 | |
| Democratic | John Oceguera | 116,823 | 42.87 | |
| Independent American | Jim Murphy | 12,856 | 4.72 | |
| Independent American | Tom Jones | 5,600 | 2.05 | |
| Total votes | 272,523 | 100.0 | ||
| Republican hold | ||||
2014[]
| Party | Candidate | Votes | % | |
|---|---|---|---|---|
| Republican | Joe Heck (Incumbent) | 88,528 | 60.75 | |
| Democratic | Erin Bilbray | 52,644 | 36.13 | |
| Independent | David Goossen | 1,637 | 1.12 | |
| Libertarian | Randy Kimmick | 1,566 | 1.08 | |
| Independent | Steven St. John | 1,344 | 0.92 | |
| Total votes | 145,719 | 100 | ||
| Republican hold | ||||
2016[]
| Party | Candidate | Votes | % | |||
|---|---|---|---|---|---|---|
| Democratic | Jacklyn Rosen | 146,653 | 47.23 | |||
| Republican | Danny Tarkanian | 142,726 | 45.97 | |||
| Independent American | Warren Markowitz | 11,580 | 3.73 | |||
| Independent | David Goossen | 9,551 | 3.08 | |||
| Total votes | 310,510 | 100 | ||||
| Democratic gain from Republican | ||||||
2018[]
| Party | Candidate | Votes | % | ±% | |
|---|---|---|---|---|---|
| Democratic | Susie Lee | 148,474 | 51.89 | +4.66% | |
| Republican | Danny Tarkanian | 122,551 | 42.83 | -3.13% | |
| Libertarian | Steve Brown | 4,554 | 1.59 | N/A | |
| Independent | David Goossen | 3,627 | 1.27 | -1.81% | |
| Independent American | Harry Vickers | 3,481 | 1.22 | -2.51% | |
| Independent | Gil Eisner | 1,887 | 0.66 | N/A | |
| Independent | Tony Gumina | 1,551 | 0.54 | N/A | |
| Margin of victory | 25,923 | 9.06 | +7.79% | ||
| Total votes | 286,125 | 100.0 | N/A | ||
| Democratic hold | |||||
2020[]
| Party | Candidate | Votes | % | |
|---|---|---|---|---|
| Democratic | Susie Lee (Incumbent) | 203,421 | 48.8 | |
| Republican | Dan Rodimer | 190,975 | 45.8 | |
| Libertarian | Steve Brown | 12,315 | 2.9 | |
| Independent | Edward Bridges III | 10,541 | 2.5 | |
| Total votes | 417,252 | 100 | ||
| Democratic hold | ||||
See also[]
References[]
- ^ Center for New Media & Promotion (CNMP), US Census Bureau. "My Congressional District". www.census.gov.
- ^ "PVI Map and District List". The Cook Political Report. February 22, 2020. Retrieved February 22, 2020.
- ^ "Just 47 House districts flipped in the last three presidential elections. What do they tell us?".
- ^ "2006 and 2010 Nevada Attorney General and Senate Race Results by Congressional District". Twitter.
- ^ "2002 Election Results" (PDF). Retrieved November 7, 2018.
- ^ "2004 Election Results" (PDF). Retrieved November 7, 2018.
- ^ "2006 Election Results" (PDF). Retrieved November 7, 2018.
- ^ "2008 Election Results" (PDF). Retrieved November 7, 2018.
- ^ "Congressional results". www.nvsos.gov. Retrieved November 7, 2018.
- ^ "Nevada Secretary of State: Elections Results: Clark". www.nvsos.gov.
- ^ "Nevada Secretary of State: Elections Results: Clark". www.nvsos.gov.
- ^ "Silver State Election Night Results 2016". Nevada Secretary of State. November 8, 2016. Retrieved November 9, 2016.
- ^ "Silver State 2018 Election Night Results | U.S. House of Representatives". Nevada Secretary of State. November 14, 2018.
Coordinates: 35°39′48″N 115°09′15″W / 35.66333°N 115.15417°W

Categories:
- Congressional districts of Nevada
- Clark County, Nevada
- Constituencies established in 2003
- 2003 establishments in Nevada