2016 United States House of Representatives elections
| ||||||||||||||||||||||||||||||||||
All 435 seats in the United States House of Representatives[a] 218 seats needed for a majority | ||||||||||||||||||||||||||||||||||
|---|---|---|---|---|---|---|---|---|---|---|---|---|---|---|---|---|---|---|---|---|---|---|---|---|---|---|---|---|---|---|---|---|---|---|
| Turnout | 54.7% | |||||||||||||||||||||||||||||||||
| ||||||||||||||||||||||||||||||||||
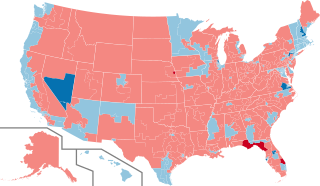 Results: Democratic hold Democratic gain Republican hold Republican gain | ||||||||||||||||||||||||||||||||||
| ||||||||||||||||||||||||||||||||||


The 2016 United States House of Representatives elections were held on November 8, 2016, to elect representatives for all 435 congressional districts across each of the 50 U.S. states. Non-voting members for the District of Columbia and Territories of the United States were also elected. These elections coincided with the election of President Donald Trump, although his party lost seats in both chambers of Congress. The winners of this election served in the 115th Congress, with seats apportioned among the states based on the 2010 United States Census. In October 2015, the House elected a new Speaker, Republican Paul Ryan, who was re-elected in the new term. Democrat Nancy Pelosi continued to lead her party as Minority Leader.
Elections were also held on the same day for the U.S. Senate, many governors, and other state and local elections.
As of 2021, this is the last time Republicans won a House majority, the most recent election cycle in which Republicans won a House race in Maine (or any state in the New England region), and the most recent time the Republicans won every seat in Kansas.
Results summary[]
Source: "Election Statistics – Office of the Clerk". Note: does not include blank and over/under votes which were included in the official results.
| 241 | 194 |
| Republican | Democratic |

| Parties | Seats | Popular vote | ||||||
|---|---|---|---|---|---|---|---|---|
| 2014 | 2016 | Net change |
Strength | Vote | % | Change | ||
| Republican Party | 247 | 241 | 55.4% | 63,182,073 | 49.1% | -2.1% | ||
| Democratic Party | 188 | 194 | 44.6% | 61,765,832 | 48.0% | +2.5% | ||
| Libertarian Party | — | — | — | — | 1,661,199 | 1.3% | +0.1% | |
| Independent | — | — | — | — | 878,234 | 0.7% | -0.1% | |
| Green Party | — | — | — | — | 491,095 | 0.4% | +0.1% | |
| Constitution Party | — | — | — | — | 127,374 | 0.1% | – | |
| Others | — | — | — | — | 521,203 | 0.4% | -0.2% | |
| Totals | 435 | 435 | 0 | 100.0% | 128,627,010 | 100.0% | — | |
| State | Total seats |
Democratic | Republican | ||
|---|---|---|---|---|---|
| Seats | Change | Seats | Change | ||
| Alabama | 7 | 1 | 6 | ||
| Alaska | 1 | 0 | 1 | ||
| Arizona | 9 | 4 | 5 | ||
| Arkansas | 4 | 0 | 4 | ||
| California | 53 | 39 | 14 | ||
| Colorado | 7 | 3 | 4 | ||
| Connecticut | 5 | 5 | 0 | ||
| Delaware | 1 | 1 | 0 | ||
| Florida | 27 | 11 | 16 | ||
| Georgia | 14 | 4 | 10 | ||
| Hawaii | 2 | 2 | 0 | ||
| Idaho | 2 | 0 | 2 | ||
| Illinois | 18 | 11 | 7 | ||
| Indiana | 9 | 2 | 7 | ||
| Iowa | 4 | 1 | 3 | ||
| Kansas | 4 | 0 | 4 | ||
| Kentucky | 6 | 1 | 5 | ||
| Louisiana | 6 | 1 | 5 | ||
| Maine | 2 | 1 | 1 | ||
| Maryland | 8 | 7 | 1 | ||
| Massachusetts | 9 | 9 | 0 | ||
| Michigan | 14 | 5 | 9 | ||
| Minnesota | 8 | 5 | 3 | ||
| Mississippi | 4 | 1 | 3 | ||
| Missouri | 8 | 2 | 6 | ||
| Montana | 1 | 0 | 1 | ||
| Nebraska | 3 | 0 | 3 | ||
| Nevada | 4 | 3 | 1 | ||
| New Hampshire | 2 | 2 | 0 | ||
| New Jersey | 12 | 7 | 5 | ||
| New Mexico | 3 | 2 | 1 | ||
| New York | 27 | 18 | 9 | ||
| North Carolina | 13 | 3 | 10 | ||
| North Dakota | 1 | 0 | 1 | ||
| Ohio | 16 | 4 | 12 | ||
| Oklahoma | 5 | 0 | 5 | ||
| Oregon | 5 | 4 | 1 | ||
| Pennsylvania | 18 | 5 | 13 | ||
| Rhode Island | 2 | 2 | 0 | ||
| South Carolina | 7 | 1 | 6 | ||
| South Dakota | 1 | 0 | 1 | ||
| Tennessee | 9 | 2 | 7 | ||
| Texas | 36 | 11 | 25 | ||
| Utah | 4 | 0 | 4 | ||
| Vermont | 1 | 1 | 0 | ||
| Virginia | 11 | 4 | 7 | ||
| Washington | 10 | 6 | 4 | ||
| West Virginia | 3 | 0 | 3 | ||
| Wisconsin | 8 | 3 | 5 | ||
| Wyoming | 1 | 0 | 1 | ||
| Total | 435 | 194 | 241 | ||
Retiring incumbents[]

| Democratic 100% 80-99% 70-79% 60-69% 51-59% 50% | Republican 100% 80-99% 70-79% 60-69% 51-59% 50% |

Democratic-held seats: Retiring Not retiring
Republican-held seats: Retiring Not retiring
Forty-two Representatives declined to seek re-election in 2016, divided into eighteen Democrats and twenty-four Republicans.
Democrats[]
Eighteen Democrats retired.[2]
- Arizona 1: Ann Kirkpatrick retired to run for U.S. Senator.
- California 20: Sam Farr retired.
- California 24: Lois Capps retired.
- California 44: Janice Hahn retired to run for the Los Angeles County Board of Supervisors.
- California 46: Loretta Sanchez retired to run for U.S. Senator.
- Delaware at-large: John Carney retired to run for Governor of Delaware.
- Florida 2: Gwen Graham retired.
- Florida 9: Alan Grayson retired to run for U.S. Senator.
- Florida 18: Patrick Murphy retired to run for U.S. Senator.
- Hawaii 1: Mark Takai died July 20, 2016 (had previously announced his retirement).
- Illinois 8: Tammy Duckworth retired to run for U.S. Senator.
- Maryland 4: Donna Edwards retired to run for U.S. Senator.
- Maryland 8: Chris Van Hollen retired to run for U.S. Senator.
- New York 3: Steve Israel retired.
- New York 13: Charles Rangel retired.
- Puerto Rico at-large: Pedro Pierluisi retired to run for Governor of Puerto Rico.
- Texas 15: Rubén Hinojosa retired.
- Washington 7: Jim McDermott retired.
Republicans[]
Twenty-four Republicans retired.[2]
- Arizona 5: Matt Salmon retired.
- Florida 1: Jeff Miller retired.
- Florida 4: Ander Crenshaw retired.
- Florida 11: Rich Nugent retired.
- Florida 19: Curt Clawson retired.
- Georgia 3: Lynn Westmoreland retired.
- Indiana 3: Marlin Stutzman retired to run for U.S. Senator.
- Indiana 9: Todd Young retired to run for U.S. Senator.
- Kentucky 1: Ed Whitfield resigned September 6, 2016 (had previously announced his retirement).
- Louisiana 3: Charles Boustany retired to run for U.S. Senator.
- Louisiana 4: John Fleming retired to run for U.S. Senator.
- Michigan 1: Dan Benishek retired.
- Michigan 10: Candice Miller retired.
- Minnesota 2: John Kline retired.
- Nevada 3: Joe Heck retired to run for U.S. Senator.
- New York 19: Chris Gibson retired.
- New York 22: Richard Hanna retired.
- Pennsylvania 16: Joe Pitts retired.
- Tennessee 8: Stephen Fincher retired.
- Texas 19: Randy Neugebauer retired.
- Virginia 2: Scott Rigell retired.
- Virginia 5: Robert Hurt retired.
- Wisconsin 8: Reid Ribble retired.
- Wyoming at-large: Cynthia Lummis retired.
Incumbents defeated[]
In primary elections[]
Democrats[]
- Florida 5: Corrine Brown lost renomination to Al Lawson; the 5th district was redrawn in 2016 due to a court order[3]
- Pennsylvania 2: Chaka Fattah lost renomination to Dwight E. Evans. Subsequently, resigned on June 23, 2016.
Republicans[]
- Kansas 1: Tim Huelskamp lost renomination to Roger Marshall.
- North Carolina 2: Renee Ellmers lost renomination to fellow incumbent George Holding after court-ordered redistricting forced them into the same district.
- Virginia 2: Randy Forbes lost renomination to Scott Taylor after running in a new district following court-ordered redistricting.
In the general election[]
The Democrats had a net gain of five seats, taken from Republicans.
Democrats[]
One Democrat lost re-election to a fellow Democrat.
- California 17: Mike Honda (D) lost to Ro Khanna (D).
One Democrat lost re-election to a Republican.
- Nebraska 2: Brad Ashford (D) lost to Don Bacon (R).
Republicans[]
Six Republicans lost re-election to Democrats.
- Florida 7: John Mica (R) lost to Stephanie Murphy (D).
- Florida 13: David Jolly (R) lost to Charlie Crist (D).
- Illinois 10: Bob Dold (R) lost to Brad Schneider (D).
- Nevada 4: Cresent Hardy (R) lost to Ruben Kihuen (D).
- New Hampshire 1: Frank Guinta (R) lost to Carol Shea-Porter (D).
- New Jersey 5: Scott Garrett (R) lost to Josh Gottheimer (D).
Open seats that changed parties[]
Democrats had a net gain of one seat in which the incumbent was not on the ballot.
Democratic seats[]
One open seat was lost.
- Florida 18: Patrick Murphy (D) retired to run for Senate. Seat won by Brian Mast (R).
One open seat was lost as a result of redistricting.
- Florida 2: Gwen Graham (D) retired. Seat won by Neal Dunn (R).
Republican seats[]
One open seat was lost.
Two open seats were lost as a result of redistricting.
- Florida 10: Daniel Webster (R) instead ran in the 11th district. Seat won by Val Demings (D).
- Virginia 4: J. Randy Forbes (R) instead ran in the 2nd district. Seat won by Don McEachin (D).
Closest races[]
In thirty-five races, the margin of victory was less than 10%.
| District | Winner | Margin |
|---|---|---|
| California 49th | Republican | 0.52% |
| Minnesota 8th | Democratic | 0.56% |
| Minnesota 1st | Democratic | 0.76% |
| Nebraska 2nd | Republican (flip) | 1.20% |
| Nevada 3rd | Democratic (flip) | 1.27% |
| Texas 23rd | Republican | 1.33% |
| New Hampshire 1st | Democratic (flip) | 1.34% |
| Puerto Rico at-large | Republican (flip) | 1.60% |
| Minnesota 2nd | Republican | 1.80% |
| California 7th | Democratic | 2.34% |
| Florida 7th | Democratic (flip) | 2.96% |
| California 10th | Republican | 3.40% |
| Florida 13th | Democratic (flip) | 3.81% |
| Nevada 4th | Democratic (flip) | 4.01% |
| California 44th | Democratic | 4.39% |
| New Jersey 5th | Democratic (flip) | 4.41% |
| New Hampshire 2nd | Democratic | 4.42% |
| Minnesota 7th | Democratic | 5.03% |
| Illinois 10th | Democratic (flip) | 5.21% |
| New York 22nd | Republican | 5.45% |
| New York 3rd | Democratic | 5.73% |
| Virginia 10th | Republican | 5.77% |
| California 25th | Republican | 6.26% |
| California 24th | Democratic | 6.84% |
| Arizona 1st | Democratic | 7.29% |
| Iowa 2nd | Democratic | 7.47% |
| Pennsylvania 17th | Democratic | 7.61% |
| Iowa 1st | Republican | 7.66% |
| Guam at-large | Democratic | 7.98% |
| Alabama 2nd | Republican | 8.24% |
| Colorado 6th | Republican | 8.30% |
| New York 19th | Republican | 8.56% |
| Pennsylvania 8th | Republican | 8.85% |
| Maine 2nd | Republican | 9.60% |
| Florida 27th | Republican | 9.79% |
Election ratings[]
Special elections[]
These elections were for the remainder of the term ending January 3, 2017. Sorted by date, then by state, then by district.
| District | Incumbent | This race | |||
|---|---|---|---|---|---|
| Member | Party | First elected | Results | Candidates | |
| Ohio 8 | John Boehner | Republican | 1990 | Incumbent resigned October 31, 2015. New member elected June 7, 2016. Republican hold.[4] |
Corey Foister (Democratic) 21.1% James J. Condit Jr. (Green) 2.2% |
| Pennsylvania 2 | Chaka Fattah | Democratic | 1994 | Incumbent resigned June 23, 2016, after being convicted on 23 counts of federal corruption charges. New member elected November 8, 2016.[5] Winner was also elected to the next term, see below. Democratic hold. |
James Jones (Republican) 9.8% |
| Hawaii 1 | Mark Takai | Democratic | 2014 | Incumbent died July 20, 2016. New member elected November 8, 2016. Winner was also elected to the next term, see below. Democratic hold.[6] |
Shirlene DelaCruz Ostrov (Republican) 20.6% Other candidates 18.9% |
| Kentucky 1 | Ed Whitfield | Republican | 1994 | Incumbent resigned September 6, 2016. New member elected November 8, 2016. Winner was also elected to the next term, see below. Republican hold.[7] |
Samuel L. Gaskins (Democratic) 27.8% |
Primary dates[]
This table shows the primary dates for regularly-scheduled elections. It also shows the type of primary. In an "open" primary, any registered voter can vote in any party's primary. In a "closed" primary, only voters registered with a specific party can vote in that party's primary. In a "top-two" primary, all candidates run against each other regardless of party affiliation, and the top two candidates advance to the second round of voting (in Louisiana, a candidate can win the election by winning a majority of the vote in the first round). All of the various other primary types are classified as "hybrid." Alaska in 2008 provides one example of a hybrid primary: the Democratic Party allowed unaffiliated voters to vote in its primary, while the Republican Party only allowed party members to vote in its primary.[8]
| State | Date[9] | Type[8] |
|---|---|---|
| Alabama | March 1R | Open |
| Arkansas | March 1R | Open |
| Texas | March 1R | Open |
| Mississippi | March 8 | Hybrid |
| Illinois | March 15 | Hybrid |
| North Carolina | March 15 | Hybrid |
| Ohio | March 15 | Hybrid |
| Maryland | April 26 | Hybrid |
| Pennsylvania | April 26 | Hybrid |
| Indiana | May 3 | Hybrid |
| Nebraska | May 10 | Hybrid |
| West Virginia | May 10 | Hybrid |
| Idaho | May 17 | Hybrid |
| Kentucky | May 17 | Closed |
| Oregon | May 17 | Hybrid |
| Georgia | May 24R | Open |
| California | June 7 | Top-two |
| Iowa | June 7 | Hybrid |
| Montana | June 7 | Open |
| New Jersey | June 7 | Closed |
| New Mexico | June 7 | Closed |
| North Carolina | June 7 | Hybrid |
| South Dakota | June 7R | Hybrid |
| Nevada | June 14 | Closed |
| North Dakota | June 14 | Open |
| South Carolina | June 14R | Hybrid |
| Virginia | June 14 | Hybrid |
| Colorado | June 28 | Hybrid |
| New York | June 28 | Closed |
| Oklahoma | June 28R | Hybrid |
| Utah | June 28 | Hybrid |
| Kansas | Aug 2 | Closed |
| Michigan | Aug 2 | Open |
| Missouri | Aug 2 | Open |
| Washington | Aug 2 | Top-two |
| Tennessee | Aug 4 | Hybrid |
| Connecticut | Aug 9 | Hybrid |
| Minnesota | Aug 9 | Open |
| Vermont | Aug 9 | Open |
| Wisconsin | Aug 9 | Open |
| Hawaii | Aug 13 | Open |
| Alaska | Aug 16 | Hybrid |
| Wyoming | Aug 16 | Closed |
| Arizona | Aug 30 | Hybrid |
| Florida | Aug 30 | Closed |
| Massachusetts | Sep 8 | Hybrid |
| Delaware | Sep 13 | Closed |
| New Hampshire | Sep 13 | Hybrid |
| Rhode Island | Sep 13 | Hybrid |
| Louisiana | Nov 8 | Top-two |
RIndicates a state that requires primary run-off elections under certain conditions.
Alabama[]
| District | Incumbent | This race | ||||
|---|---|---|---|---|---|---|
| Location | PVI | Member | Party | First elected | Results | Candidates[10] |
| Alabama 1 | R+15 | Bradley Byrne | Republican | 2013 | Incumbent re-elected. | |
| Alabama 2 | R+17 | Martha Roby | Republican | 2010 | Incumbent re-elected. | Nathan Mathis (Democratic) 40.5% |
| Alabama 3 | R+16 | Mike Rogers | Republican | 2002 | Incumbent re-elected. | Jesse Smith (Democratic) 32.9% |
| Alabama 4 | R+28 | Robert Aderholt | Republican | 1996 | Incumbent re-elected. | |
| Alabama 5 | R+17 | Mo Brooks | Republican | 2010 | Incumbent re-elected. | Will Boyd (Democratic) 33.2% |
| Alabama 6 | R+28 | Gary Palmer | Republican | 2014 | Incumbent re-elected. | David Putman (Democratic) 25.4% |
| Alabama 7 | D+20 | Terri Sewell | Democratic | 2010 | Incumbent re-elected. | |
Alaska[]
| District | Incumbent | This race | ||||
|---|---|---|---|---|---|---|
| Location | PVI | Member | Party | First elected | Results | Candidates[11] |
| Alaska at-large | R+12 | Don Young | Republican | 1973 (Special) | Incumbent re-elected. | Steve Lindbeck (Democratic) 36.0% Jim C. McDermott (Libertarian) 10.3% Bernie Souphanavong (Independent) 3.0% |
Arizona[]
| District | Incumbent | This race | ||||
|---|---|---|---|---|---|---|
| Location | PVI | Member | Party | First elected | Results | Candidates[12] |
| Arizona 1 | R+4 | Ann Kirkpatrick | Democratic | 2012 | Incumbent retired to run for U.S. Senator. Democratic hold. |
Paul Babeu (Republican) 43.4% Ray Parrish (Green) 6.0% |
| Arizona 2 | R+3 | Martha McSally | Republican | 2014 | Incumbent re-elected. | Matt Heinz (Democratic) 43.0% |
| Arizona 3 | D+8 | Raúl Grijalva | Democratic | 2002 | Incumbent re-elected. | |
| Arizona 4 | R+20 | Paul Gosar | Republican | 2010 | Incumbent re-elected. | Mikel Weisser (Democratic) 28.5% |
| Arizona 5 | R+17 | Matt Salmon | Republican | 2012 | Incumbent retired. Republican hold. |
Talia Fuentes (Democratic) 35.9% |
| Arizona 6 | R+12 | David Schweikert | Republican | 2010 | Incumbent re-elected. | W. John Williamson (Democratic) 37.9% |
| Arizona 7 | D+16 | Ruben Gallego | Democratic | 2014 | Incumbent re-elected. | Eve Nunez (Republican) 24.7% |
| Arizona 8 | R+15 | Trent Franks | Republican | 2002 | Incumbent re-elected. | Mark Salazar (Green) 31.43% |
| Arizona 9 | R+1 | Kyrsten Sinema | Democratic | 2012 | Incumbent re-elected. | Dave Giles (Republican) 39.1% |
Arkansas[]
| District | Incumbent | This race | ||||
|---|---|---|---|---|---|---|
| Location | PVI | Member | Party | First elected | Results | Candidates[13] |
| Arkansas 1 | R+14 | Rick Crawford | Republican | 2010 | Incumbent re-elected. | Mark West (Libertarian) 23.7% |
| Arkansas 2 | R+8 | French Hill | Republican | 2014 | Incumbent re-elected. | Dianne Curry (Democratic) 36.8% Chris Hayes (Libertarian) 4.7% |
| Arkansas 3 | R+19 | Steve Womack | Republican | 2010 | Incumbent re-elected. | Steve Isaacson (Libertarian) 22.7% |
| Arkansas 4 | R+15 | Bruce Westerman | Republican | 2014 | Incumbent re-elected. | Kerry Hicks (Libertarian) 25.1% |
California[]
| District | Incumbent | This race | ||||
|---|---|---|---|---|---|---|
| Location | PVI | Member | Party | First elected | Results | Candidates[14] |
| California 1 | R+10 | Doug LaMalfa | Republican | 2012 | Incumbent re-elected. | Jim Reed (Democratic) 40.9% |
| California 2 | D+20 | Jared Huffman | Democratic | 2012 | Incumbent re-elected. | Dale Mensing (Republican) 23.1% |
| California 3 | D+3 | John Garamendi | Democratic | 2009 | Incumbent re-elected. | Eugene Cleek (Republican) 40.6% |
| California 4 | R+10 | Tom McClintock | Republican | 2008 | Incumbent re-elected. | Bob Derlet (Democratic) 37.3% |
| California 5 | D+19 | Mike Thompson | Democratic | 1998 | Incumbent re-elected. | Carlos Santamaria (Republican) 23.1% |
| California 6 | D+18 | Doris Matsui | Democratic | 2005 | Incumbent re-elected. | Bob Evans (Republican) 24.6% |
| California 7 | Even | Ami Bera | Democratic | 2012 | Incumbent re-elected. | Scott Jones (Republican) 48.8% |
| California 8 | R+10 | Paul Cook | Republican | 2012 | Incumbent re-elected. | Rita Ramirez (Democratic) 37.7% |
| California 9 | D+6 | Jerry McNerney | Democratic | 2006 | Incumbent re-elected. | Tony Amador (Republican) 42.6% |
| California 10 | R+1 | Jeff Denham | Republican | 2010 | Incumbent re-elected. | Michael Eggman (Democratic) 48.3% |
| California 11 | D+17 | Mark DeSaulnier | Democratic | 2014 | Incumbent re-elected. | Roger Petersen (Republican) 27.9% |
| California 12 | D+34 | Nancy Pelosi | Democratic | 1987 | Incumbent re-elected. | Preston Picus (No Party Preference) 19.1% |
| California 13 | D+37 | Barbara Lee | Democratic | 1998 | Incumbent re-elected. | Sue Caro (Republican) 9.2% |
| California 14 | D+23 | Jackie Speier | Democratic | 2008 | Incumbent re-elected. | Angel Cardenas (Republican) 19.1% |
| California 15 | D+16 | Eric Swalwell | Democratic | 2012 | Incumbent re-elected. | Danny Turner (Republican) 26.2% |
| California 16 | D+7 | Jim Costa | Democratic | 2004 | Incumbent re-elected. | Johnny Tacherra (Republican) 42.0% |
| California 17 | D+20 | Mike Honda | Democratic | 2000 | Incumbent lost re-election. Democratic hold. |
Mike Honda (Democratic) 39.0% |
| California 18 | D+18 | Anna Eshoo | Democratic | 1992 | Incumbent re-elected. | Richard Fox (Republican) 28.9% |
| California 19 | D+19 | Zoe Lofgren | Democratic | 1994 | Incumbent re-elected. | G. Burt Lancaster (Republican) 26.1% |
| California 20 | D+21 | Sam Farr | Democratic | 1993 | Incumbent retired. Democratic hold. |
Casey Lucius (Republican) 29.2% |
| California 21 | D+2 | David Valadao | Republican | 2012 | Incumbent re-elected. | Emilio Huerta (Democratic) 43.3% |
| California 22 | R+10 | Devin Nunes | Republican | 2002 | Incumbent re-elected. | Louie Campos (Democratic) 32.4% |
| California 23 | R+16 | Kevin McCarthy | Republican | 2006 | Incumbent re-elected. | Wendy Reed (Democratic) 30.8% |
| California 24 | D+4 | Lois Capps | Democratic | 1998 | Incumbent retired. Democratic hold. |
Justin Fareed (Republican) 46.6% |
| California 25 | R+3 | Steve Knight | Republican | 2014 | Incumbent re-elected. | Bryan Caforio (Democratic) 46.9% |
| California 26 | D+4 | Julia Brownley | Democratic | 2012 | Incumbent re-elected. | Rafael Dagnesses (Republican) 39.6% |
| California 27 | D+11 | Judy Chu | Democratic | 2009 | Incumbent re-elected. | Jack Orswell (Republican) 32.6% |
| California 28 | D+20 | Adam Schiff | Democratic | 2000 | Incumbent re-elected. | Lenore Solis (Republican) 22.0% |
| California 29 | D+25 | Tony Cárdenas | Democratic | 2012 | Incumbent re-elected. | Richard Alarcon (Democratic) 25.3% |
| California 30 | D+14 | Brad Sherman | Democratic | 1996 | Incumbent re-elected. | Mark Reed (Republican) 27.4% |
| California 31 | D+5 | Pete Aguilar | Democratic | 2014 | Incumbent re-elected. | Paul Chabot (Republican) 43.9% |
| California 32 | D+12 | Grace Napolitano | Democratic | 1998 | Incumbent re-elected. | Roger Hernandez (Democratic) 38.4% |
| California 33 | D+11 | Ted Lieu | Democratic | 2014 | Incumbent re-elected. | Kenneth Wright (Republican) 33.6% |
| California 34 | D+30 | Xavier Becerra | Democratic | 1992 | Incumbent re-elected. | Adrienne Edwards (Democratic) 22.8% |
| California 35 | D+15 | Norma Torres | Democratic | 2014 | Incumbent re-elected. | Tyler Fischella (Republican) 27.6% |
| California 36 | R+1 | Raul Ruiz | Democratic | 2012 | Incumbent re-elected. | Jeff Stone (Republican) 37.9% |
| California 37 | D+34 | Karen Bass | Democratic | 2010 | Incumbent re-elected. | Chris Wiggins (Democratic) 18.9% |
| California 38 | D+12 | Linda Sánchez | Democratic | 2002 | Incumbent re-elected. | Ryan Downing (Republican) 29.5% |
| California 39 | R+5 | Ed Royce | Republican | 1992 | Incumbent re-elected. | Brett Murdock (Democratic) 42.8% |
| California 40 | D+29 | Lucille Roybal-Allard | Democratic | 1992 | Incumbent re-elected. | Roman Gabriel Gonzalez (No Party Preference) 28.6% |
| California 41 | D+9 | Mark Takano | Democratic | 2012 | Incumbent re-elected. | Doug Shepherd (Republican) 35.0% |
| California 42 | R+10 | Ken Calvert | Republican | 1992 | Incumbent re-elected. | Tim Sheridan (Democratic) 41.2% |
| California 43 | D+26 | Maxine Waters | Democratic | 1990 | Incumbent re-elected. | Omar Navarro (Republican) 23.9% |
| California 44 | D+32 | Janice Hahn | Democratic | 2011 | Incumbent retired to run for the Los Angeles County Board of Supervisors. Democratic hold. |
Isadore Hall, III (Democratic) 47.8% |
| California 45 | R+7 | Mimi Walters | Republican | 2014 | Incumbent re-elected. | Ron Varasteh (Democratic) 41.4% |
| California 46 | D+9 | Loretta Sanchez | Democratic | 1996 | Incumbent retired to run for U.S. Senator. Democratic hold. |
Bao Nguyen (Democratic) 30.0% |
| California 47 | D+8 | Alan Lowenthal | Democratic | 2012 | Incumbent re-elected. | Andy Whallon (Republican) 36.3% |
| California 48 | R+7 | Dana Rohrabacher | Republican | 1988 | Incumbent re-elected. | Suzanne Savary (Democratic) 41.7% |
| California 49 | R+4 | Darrell Issa | Republican | 2000 | Incumbent re-elected. | Doug Applegate (Democratic) 49.7% |
| California 50 | R+14 | Duncan D. Hunter | Republican | 2008 | Incumbent re-elected. | Patrick Malloy (Democratic) 36.5% |
| California 51 | D+16 | Juan Vargas | Democratic | 2012 | Incumbent re-elected. | Juan Hidalgo (Republican) 27.2% |
| California 52 | D+2 | Scott Peters | Democratic | 2012 | Incumbent re-elected. | Denise Gitsham (Republican) 43.5% |
| California 53 | D+10 | Susan Davis | Democratic | 2000 | Incumbent re-elected. | James Veltmeyer (Republican) 33.0% |
Colorado[]
| District | Incumbent | This race | ||||
|---|---|---|---|---|---|---|
| Location | PVI | Member | Party | First elected | Results | Candidates[15] |
| Colorado 1 | D+18 | Diana DeGette | Democratic | 1996 | Incumbent re-elected. | Casper Stockham (Republican) 27.7% Darrell Dinges (Libertarian) 4.4% |
| Colorado 2 | D+8 | Jared Polis | Democratic | 2008 | Incumbent re-elected. | Nic Morse (Republican) 37.2% Richard Longstreth (Libertarian) 5.9% |
| Colorado 3 | R+5 | Scott Tipton | Republican | 2010 | Incumbent re-elected. | Gail Schwartz (Democratic) 40.4% Gaylon Kent (Libertarian) 5.0% |
| Colorado 4 | R+11 | Ken Buck | Republican | 2014 | Incumbent re-elected. | Bob Seay (Democratic) 31.5% Bruce Griffith (Libertarian) 4.8% |
| Colorado 5 | R+13 | Doug Lamborn | Republican | 2006 | Incumbent re-elected. | Misty Plowright (Democratic) 30.8% Mike McRedmond (Libertarian) 6.9% |
| Colorado 6 | D+1 | Mike Coffman | Republican | 2008 | Incumbent re-elected. | Morgan Carroll (Democratic) 42.6% Norm Olsen (Libertarian) 5.0% Robert Lee Worthey (Green) 1.5% |
| Colorado 7 | D+5 | Ed Perlmutter | Democratic | 2006 | Incumbent re-elected. | George Athanasopoulos (Republican) 39.8% Martin Buchanan (Libertarian) 5.0% |
Connecticut[]
| District | Incumbent | This race | ||||
|---|---|---|---|---|---|---|
| Location | PVI | Member | Party | First elected | Results | Candidates[16] |
| Connecticut 1 | D+13 | John B. Larson | Democratic | 1998 | Incumbent re-elected. | Matthew Corey (Republican) 33.8% Mike DeRosa (Green) 2.11% |
| Connecticut 2 | D+5 | Joe Courtney | Democratic | 2006 | Incumbent re-elected. | Daria Novak (Republican) 33.7% Dan Reale (Libertarian) 1.5% Jonathan Pelto (Green) 1.6% |
| Connecticut 3 | D+11 | Rosa DeLauro | Democratic | 1990 | Incumbent re-elected. | Angel Cadena (Republican) 31.0% |
| Connecticut 4 | D+5 | Jim Himes | Democratic | 2008 | Incumbent re-elected. | John Shaban (Republican) 40.1% |
| Connecticut 5 | D+3 | Elizabeth Esty | Democratic | 2012 | Incumbent re-elected. | Clay Cope (Republican) 42.0% |
Delaware[]
| District | Incumbent | This race | ||||
|---|---|---|---|---|---|---|
| Location | PVI | Member | Party | First elected | Results | Candidates[17] |
| Delaware at-large | D+8 | John Carney | Democratic | 2010 | Incumbent retired to run for Governor. Democratic hold. |
Hans Reigle (Republican) 41.0% Mark Perri (Green) 2.0% Scott Gesty (Libertarian) 1.5% |
Florida[]
| District | Incumbent | This race | ||||
|---|---|---|---|---|---|---|
| Location | PVI | Member | Party | First elected | Results | Candidates[18] |
| Florida 1 | R+22 | Jeff Miller | Republican | 2001 | Incumbent retired. Republican hold. |
Steven Specht (Democratic) 30.9% |
| Florida 2 | R+18 | Gwen Graham | Democratic | 2014 | Incumbent retired. Republican gain. |
Walter Dartland (Democratic) 29.9% Rob Lapham (Libertarian) 2.7% |
| Florida 3 | R+9 | Ted Yoho | Republican | 2012 | Incumbent re-elected. | Ken McGurn (Democratic) 39.8% |
| Florida 4 | R+19 | Ander Crenshaw | Republican | 2000 | Incumbent retired. Republican hold. |
David E. Bruderly (Democratic) 27.6% |
| Florida 5 | D+12 | Corrine Brown | Democratic | 1992 | Incumbent lost renomination. Democratic hold. |
Glo Smith (Republican) 35.8% |
| Florida 6 | R+4 | Ron DeSantis | Republican | 2012 | Incumbent re-elected. | Bill McCullough (Democratic) 41.4% |
| Florida 7 | R+2 | John Mica | Republican | 1992 | Incumbent lost re-election. Democratic gain. |
John Mica (Republican) 48.5% |
| Florida 8 | R+9 | Bill Posey | Republican | 2008 | Incumbent re-elected. | Corry Westbrook (Democratic) 32.6% |
| Florida 9 | D+3 | Alan Grayson | Democratic | 2012 | Incumbent retired to run for U.S. Senator Democratic hold. |
Wayne Liebnitzky (Republican) 42.5% |
| Florida 10 | D+9 | None (New seat) | New seat. Democratic gain. |
Thuy Lowe (Republican) 35.1% | ||
| Florida 11 | R+11 | Rich Nugent | Republican | 2010 | Incumbent retired. Republican loss. |
Dave Koller (Democratic) 31.6% |
| Dan Webster Redistricted from the 10th district |
Republican | 2010 | Incumbent re-elected. | |||
| Florida 12 | R+6 | Gus Bilirakis | Republican | 2006 | Incumbent re-elected. | Robert Tager (Democratic) 31.4% |
| Florida 13 | D+3 | David Jolly | Republican | 2014 | Incumbent lost re-election. Democratic gain. |
David Jolly (Republican) 48.1% |
| Florida 14 | D+6 | Kathy Castor | Democratic | 2006 | Incumbent re-elected. | Christine Quinn (Republican) 38.2% |
| Florida 15 | R+6 | Dennis A. Ross | Republican | 2010 | Incumbent re-elected. | Jim Lange (Democratic) 42.5% |
| Florida 16 | R+6 | Vern Buchanan | Republican | 2006 | Incumbent re-elected. | Jan Schneider (Democratic) 40.2% |
| Florida 17 | R+10 | Tom Rooney | Republican | 2008 | Incumbent re-elected. | April Freeman (Democratic) 34.2% |
| Florida 18 | R+3 | Patrick Murphy | Democratic | 2012 | Incumbent retired to run for U.S. Senator. Republican gain. |
Randy Perkins (Democratic) 43.1% |
| Florida 19 | R+12 | Curt Clawson | Republican | 2014 | Incumbent retired. Republican hold. |
Robert Neeld (Democratic) 34.1% |
| Florida 20 | D+30 | Alcee Hastings | Democratic | 1992 | Incumbent re-elected. | Gary Stein (Republican) 19.7% |
| Florida 21 | D+10 | Lois Frankel Redistricted from the 22nd district |
Democratic | 2012 | Incumbent re-elected. | Paul Spain (Republican) 35.1% |
| Florida 22 | D+5 | Ted Deutch Redistricted from the 21st district |
Democratic | 2010 | Incumbent re-elected. | Andrea Leigh McGee (Republican) 41.1% |
| Florida 23 | D+9 | Debbie Wasserman Schultz | Democratic | 2004 | Incumbent re-elected. | Joe Kaufman (Republican) 40.5% |
| Florida 24 | D+33 | Frederica Wilson | Democratic | 2010 | Incumbent re-elected. | |
| Florida 25 | R+10 | Mario Díaz-Balart | Republican | 2002 | Incumbent re-elected. | Alina Valdes (Democratic) 37.6% |
| Florida 26 | Even | Carlos Curbelo | Republican | 2014 | Incumbent re-elected. | Joe Garcia (Democratic) 41.2% |
| Florida 27 | R+1 | Ileana Ros-Lehtinen | Republican | 1989 | Incumbent re-elected. | Scott Fuhrman (Democratic) 45.1% |
Georgia[]
| District | Incumbent | This race | ||||
|---|---|---|---|---|---|---|
| Location | PVI | Member | Party | First elected | Results | Candidates[19] |
| Georgia 1 | R+9 | Buddy Carter | Republican | 2014 | Incumbent re-elected. | |
| Georgia 2 | D+6 | Sanford Bishop | Democratic | 1992 | Incumbent re-elected. | Greg Duke (Republican) 38.8% |
| Georgia 3 | R+19 | Lynn Westmoreland | Republican | 2004 | Incumbent retired. Republican hold. |
Angela Pendley (Democratic) 31.6% |
| Georgia 4 | D+21 | Hank Johnson | Democratic | 2006 | Incumbent re-elected. | Victor Armendariz (Republican) 24.3% |
| Georgia 5 | D+32 | John Lewis | Democratic | 1986 | Incumbent re-elected. | Douglas Bell (Republican) 15.6% |
| Georgia 6 | R+14 | Tom Price | Republican | 2004 | Incumbent re-elected. | Rodney Stooksbury (Democratic) 38.3% |
| Georgia 7 | R+14 | Rob Woodall | Republican | 2010 | Incumbent re-elected. | Rashid Malik (Democratic) 39.6% |
| Georgia 8 | R+15 | Austin Scott | Republican | 2010 | Incumbent re-elected. | James Harris (Democratic) 32.4% |
| Georgia 9 | R+30 | Doug Collins | Republican | 2012 | Incumbent re-elected. | |
| Georgia 10 | R+14 | Jody Hice | Republican | 2014 | Incumbent re-elected. | |
| Georgia 11 | R+19 | Barry Loudermilk | Republican | 2014 | Incumbent re-elected. | Don Wilson (Democratic) 32.6% |
| Georgia 12 | R+9 | Rick W. Allen | Republican | 2014 | Incumbent re-elected. | Tricia McCracken (Democratic) 38.4% |
| Georgia 13 | D+16 | David Scott | Democratic | 2002 | Incumbent re-elected. | |
| Georgia 14 | R+26 | Tom Graves | Republican | 2010 | Incumbent re-elected. | |
Hawaii[]
| District | Incumbent | This race | ||||
|---|---|---|---|---|---|---|
| Location | PVI | Member | Party | First elected | Results | Candidates[20] |
| Hawaii 1 | D+18 | Vacant | Incumbent Mark Takai died on July 20, 2016. Democratic hold. |
Shirlene D. Ostrov (Republican) 22.7% Alan Yim (Libertarian) 3.3% | ||
| Hawaii 2 | D+21 | Tulsi Gabbard | Democratic | 2012 | Incumbent re-elected. | Angela Kaaihue (Republican) 18.8% |
Idaho[]
| District | Incumbent | This race | ||||
|---|---|---|---|---|---|---|
| Location | PVI | Member | Party | First elected | Results | Candidates[21] |
| Idaho 1 | R+18 | Raúl Labrador | Republican | 2010 | Incumbent re-elected. | James Piotrowski (Democratic) 31.8% |
| Idaho 2 | R+17 | Mike Simpson | Republican | 1998 | Incumbent re-elected. | Jennifer Martinez (Democratic) 29.4% |
Illinois[]
| District | Incumbent | This race | ||||
|---|---|---|---|---|---|---|
| Location | PVI | Member | Party | First elected | Results | Candidates[22] |
| Illinois 1 | D+28 | Bobby Rush | Democratic | 1992 | Incumbent re-elected. | August Deuser (Republican) 25.9% |
| Illinois 2 | D+29 | Robin Kelly | Democratic | 2013 | Incumbent re-elected. | John Morrow (Republican) 20.2% |
| Illinois 3 | D+5 | Dan Lipinski | Democratic | 2004 | Incumbent re-elected. | |
| Illinois 4 | D+29 | Luis Gutiérrez | Democratic | 1992 | Incumbent re-elected. | |
| Illinois 5 | D+16 | Mike Quigley | Democratic | 2008 | Incumbent re-elected. | Vince Kolber (Republican) 27.5% |
| Illinois 6 | R+4 | Peter Roskam | Republican | 2006 | Incumbent re-elected. | Amanda Howland (Democratic) 40.8% |
| Illinois 7 | D+36 | Danny K. Davis | Democratic | 1996 | Incumbent re-elected. | Jeffrey Leef (Republican) 15.8% |
| Illinois 8 | D+8 | Tammy Duckworth | Democratic | 2012 | Incumbent retired to run for U.S. Senator. Democratic hold. |
Pete DiCianni (Republican) 41.7% |
| Illinois 9 | D+15 | Jan Schakowsky | Democratic | 1998 | Incumbent re-elected. | Joan McCarthy Lasonde (Republican) 33.5% |
| Illinois 10 | D+8 | Bob Dold | Republican | 2014 | Incumbent lost re-election. Democratic gain. |
Bob Dold (Republican) 47.4% |
| Illinois 11 | D+8 | Bill Foster | Democratic | 2012 | Incumbent re-elected. | Tonia Khouri (Republican) 39.6% |
| Illinois 12 | Even | Mike Bost | Republican | 2014 | Incumbent re-elected. | C.J. Baricevic (Democratic) 39.7% Paula Bradshaw (Green) 6.0% |
| Illinois 13 | Even | Rodney Davis | Republican | 2012 | Incumbent re-elected. | Mark Wicklund (Democratic) 40.3% |
| Illinois 14 | R+5 | Randy Hultgren | Republican | 2010 | Incumbent re-elected. | Jim Walz (Democratic) 40.7% |
| Illinois 15 | R+14 | John Shimkus | Republican | 1996 | Incumbent re-elected. | |
| Illinois 16 | R+4 | Adam Kinzinger | Republican | 2010 | Incumbent re-elected. | |
| Illinois 17 | D+7 | Cheri Bustos | Democratic | 2012 | Incumbent re-elected. | Patrick Harlan (Republican) 39.7% |
| Illinois 18 | R+11 | Darin LaHood | Republican | 2015 | Incumbent re-elected. | Junius Rodriguez (Democratic) 27.9% |
Indiana[]
| District | Incumbent | This race | ||||
|---|---|---|---|---|---|---|
| Location | PVI | Member | Party | First elected | Results | Candidates[23] |
| Indiana 1 | D+10 | Pete Visclosky | Democratic | 1984 | Incumbent re-elected. | Donna Dunn (Libertarian) 18.5% |
| Indiana 2 | R+6 | Jackie Walorski | Republican | 2012 | Incumbent re-elected. | Lynn Coleman (Democratic) 36.9% |
| Indiana 3 | R+13 | Marlin Stutzman | Republican | 2010 | Incumbent retired to run for U.S. Senate. Republican hold. |
Tommy Schrader (Democratic) 23.0% Pepper Snyder (Libertarian) 6.9% |
| Indiana 4 | R+11 | Todd Rokita | Republican | 2010 | Incumbent re-elected. | John Dale (Democratic) 30.5% Steven Mayoras (Libertarian) 4.9% |
| Indiana 5 | R+9 | Susan Brooks | Republican | 2012 | Incumbent re-elected. | Angela Demaree (Democratic) 34.3% Matthew Wittlief (Libertarian) 4.2% |
| Indiana 6 | R+12 | Luke Messer | Republican | 2012 | Incumbent re-elected. | Barry Welsh (Democratic) 26.7% Rich Turvey (Libertarian) 4.2% |
| Indiana 7 | D+13 | André Carson | Democratic | 2008 | Incumbent re-elected. | Cat Ping (Republican) 35.7% Drew Thompson (Libertarian) 4.3% |
| Indiana 8 | R+8 | Larry Bucshon | Republican | 2010 | Incumbent re-elected. | Ron Drake (Democratic) 31.7% Andrew Horning (Libertarian) 4.6% |
| Indiana 9 | R+9 | Todd Young | Republican | 2010 | Incumbent retired to run for U.S. Senate. Republican hold. |
Shelli Yoder (Democratic) 40.5% Russell Brooksbank (Libertarian) 5.4% |
Iowa[]
| District | Incumbent | This race | ||||
|---|---|---|---|---|---|---|
| Location | PVI | Member | Party | First elected | Results | Candidates[24] |
| Iowa 1 | D+5 | Rod Blum | Republican | 2014 | Incumbent re-elected. | Monica Vernon (Democratic) 46.2% |
| Iowa 2 | D+4 | Dave Loebsack | Democratic | 2006 | Incumbent re-elected. | Christopher Peters (Republican) 46.3% |
| Iowa 3 | Even | David Young | Republican | 2014 | Incumbent re-elected. | Jim Mowrer (Democratic) 39.8% Bryan Jack Holder (Libertarian) |
| Iowa 4 | R+5 | Steve King | Republican | 2002 | Incumbent re-elected. | Kim Weaver (Democratic) 38.7% |
Kansas[]
| District | Incumbent | This race | ||||
|---|---|---|---|---|---|---|
| Location | PVI | Member | Party | First elected | Results | Candidates[25] |
| Kansas 1 | R+23 | Tim Huelskamp | Republican | 2010 | Incumbent lost renomination. Republican hold. |
Alan LaPolice (Independent) 26.2% Kerry Burt (Libertarian) 7.5% |
| Kansas 2 | R+8 | Lynn Jenkins | Republican | 2008 | Incumbent re-elected. | Britani Potter (Democratic) 32.5% James Houston Bales (Libertarian) 6.5% |
| Kansas 3 | R+6 | Kevin Yoder | Republican | 2010 | Incumbent re-elected. | Jay Sidie (Democratic) 40.6% Steven Hohe (Libertarian) 8.0% |
| Kansas 4 | R+14 | Mike Pompeo | Republican | 2010 | Incumbent re-elected. | Dan Giroux (Democratic) 29.6% Gordon J. Bakken (Libertarian) 2.8% |
Kentucky[]
| District | Incumbent | This race | ||||
|---|---|---|---|---|---|---|
| Location | PVI | Member | Party | First elected | Results | Candidates[26] |
| Kentucky 1 | R+18 | Vacant | Incumbent Ed Whitfield (R) resigned September 6, 2016. Republican hold. |
Sam Gaskins (Democratic) 27.4% | ||
| Kentucky 2 | R+16 | Brett Guthrie | Republican | 2008 | Incumbent re-elected. | |
| Kentucky 3 | D+4 | John Yarmuth | Democratic | 2006 | Incumbent re-elected. | Harold Bratcher (Republican) 36.5% |
| Kentucky 4 | R+16 | Thomas Massie | Republican | 2012 | Incumbent re-elected. | Calvin Sidle (Democratic) 28.7% |
| Kentucky 5 | R+25 | Hal Rogers | Republican | 1980 | Incumbent re-elected. | |
| Kentucky 6 | R+9 | Andy Barr | Republican | 2012 | Incumbent re-elected. | Nancy Jo Kemper (Democratic) 38.9% |
Louisiana[]
| District | Incumbent | This race | ||||
|---|---|---|---|---|---|---|
| Location | PVI | Member | Party | First elected | Results | Candidates[27] |
| Louisiana 1 | R+26 | Steve Scalise | Republican | 2008 | Incumbent re-elected. | Lee Ann Dugas (Democratic) 12.8% Danil Ezekiel Faust (Democratic) 3.9% Howard Kearney (Libertarian) 3% Joseph "Joe" Swider (Democratic) 2.8% |
| Louisiana 2 | D+23 | Cedric Richmond | Democratic | 2010 | Incumbent re-elected. | Kip Holden (Democratic) 20.1% Kenneth Cutno (Democratic) 10.1% |
| Louisiana 3 | R+19 | Charles Boustany | Republican | 2004 | Incumbent retired to run for U.S. Senate. Republican hold. |
Scott Angelle (Republican) 43.9% |
| Louisiana 4 | R+13 | John Fleming | Republican | 2008 | Incumbent retired to run for U.S. Senate. Republican hold. |
Marshall Jones (Democratic) 34.77% |
| Louisiana 5 | R+15 | Ralph Abraham | Republican | 2014 | Incumbent re-elected. | Billy Burkette (Republican) 18.4% |
| Louisiana 6 | R+21 | Garret Graves | Republican | 2014 | Incumbent re-elected. | Richard Lieberman (Democratic) 14.9% Robert Lamar "Bob" Bell (Republican) 10.1% Jermaine Sampson (Democratic) 9.0% Richard Fontanesi (Libertarian) 2% |
Maine[]
| District | Incumbent | This race | ||||
|---|---|---|---|---|---|---|
| Location | PVI | Member | Party | First elected | Results | Candidates[28] |
| Maine 1 | D+9 | Chellie Pingree | Democratic | 2008 | Incumbent re-elected. | Mark Holbrook (Republican) 42.0% |
| Maine 2 | D+2 | Bruce Poliquin | Republican | 2014 | Incumbent re-elected. | Emily Cain (Democratic) 45.2% |
Maryland[]
| District | Incumbent | This race | ||||
|---|---|---|---|---|---|---|
| Location | PVI | Member | Party | First elected | Results | Candidates[29] |
| Maryland 1 | R+14 | Andy Harris | Republican | 2010 | Incumbent re-elected. | Joe Werner (Democratic) 28.6% Matt Beers (Libertarian) 4.2% |
| Maryland 2 | D+10 | Dutch Ruppersberger | Democratic | 2002 | Incumbent re-elected. | Pat McDonough (Republican) 33.1% Kristin Kasprzak (Libertarian) 4.6% |
| Maryland 3 | D+9 | John Sarbanes | Democratic | 2006 | Incumbent re-elected. | Mark Plaster (Republican) 33.9% Eze Nnabu (Green) 2.8% |
| Maryland 4 | D+26 | Donna Edwards | Democratic | 2008 | Incumbent retired to run for U.S. Senator. Democratic hold. |
George McDermott (Republican) 21.4% Ben Krause (Libertarian) 1.8% Kamesha Clark (Green) 2.6% |
| Maryland 5 | D+14 | Steny Hoyer | Democratic | 1981 | Incumbent re-elected. | Mark Arness (Republican) 29.4% Jason Summers (Libertarian) 3.1% |
| Maryland 6 | D+4 | John Delaney | Democratic | 2012 | Incumbent re-elected. | Amie Hoeber (Republican) 40.1% David Howser (Libertarian) 2.1% George Gluck (Green) 1.8% |
| Maryland 7 | D+24 | Elijah Cummings | Democratic | 1996 | Incumbent re-elected. | Corrogan Vaughn (Republican) 21.8% Myles Hoenig (Green) 3.0% |
| Maryland 8 | D+11 | Chris Van Hollen | Democratic | 2002 | Incumbent retired to run for U.S. Senator. Democratic hold. |
Dan Cox (Republican) 34.2% Jasen Wunder (Libertarian) 2.0% Nancy Wallace (Green) 3.1% |
Massachusetts[]
| District | Incumbent | This race | ||||
|---|---|---|---|---|---|---|
| Location | PVI | Member | Party | First elected | Results | Candidates[30] |
| Massachusetts 1 | D+13 | Richard Neal | Democratic | 1988 | Incumbent re-elected. | Frederick Mayock (Independent) 17.9% Thomas Simmons (Libertarian) 8.6% |
| Massachusetts 2 | D+8 | Jim McGovern | Democratic | 1996 | Incumbent re-elected. | |
| Massachusetts 3 | D+6 | Niki Tsongas | Democratic | 2007 | Incumbent re-elected. | Ann Wofford (Republican) 31.2% |
| Massachusetts 4 | D+6 | Joseph Kennedy III | Democratic | 2012 | Incumbent re-elected. | David Rosa (Republican) 29.8% |
| Massachusetts 5 | D+14 | Katherine Clark | Democratic | 2013 | Incumbent re-elected. | |
| Massachusetts 6 | D+4 | Seth Moulton | Democratic | 2014 | Incumbent re-elected. | |
| Massachusetts 7 | D+31 | Mike Capuano | Democratic | 1998 | Incumbent re-elected. | |
| Massachusetts 8 | D+6 | Stephen Lynch | Democratic | 2001 | Incumbent re-elected. | William Burke (Republican) 27.5% |
| Massachusetts 9 | D+5 | William R. Keating | Democratic | 2010 | Incumbent re-elected. | Mark Alliegro (Republican) 33.6% Paul Harrington (Independent) 6.9% |
Michigan[]
| District | Incumbent | This race | ||||
|---|---|---|---|---|---|---|
| Location | PVI | Member | Party | First elected | Results | Candidates[31] |
| Michigan 1 | R+5 | Dan Benishek | Republican | 2010 | Incumbent retired. Republican hold. |
Lon Johnson (Democratic) 40.1% Diane Bostow (Libertarian) 3.7% Ellis Boal (Green) 1.3% |
| Michigan 2 | R+7 | Bill Huizenga | Republican | 2010 | Incumbent re-elected. | Dennis B. Murphy (Democratic) 32.5% Erwin Haas (Libertarian) 2.4% Matthew Brady (Green) 1.6% |
| Michigan 3 | R+4 | Justin Amash | Republican | 2010 | Incumbent re-elected. | Douglas Smith (Democratic) 37.5% |
| Michigan 4 | R+5 | John Moolenaar | Republican | 2014 | Incumbent re-elected. | Debra Wirth (Democratic) 32.1% Leonard Schwartz (Libertarian) 2.7% Jordan Salvi (Green) 1.3% |
| Michigan 5 | D+10 | Dan Kildee | Democratic | 2012 | Incumbent re-elected. | Al Hardwick (Republican) 35.1% Steve Sluka (Libertarian) 2.2% Harley Mikkelson (Green) 1.5% |
| Michigan 6 | R+1 | Fred Upton | Republican | 1986 | Incumbent re-elected. | Paul Clements (Democratic) 36.4% Lorence Wenke (Libertarian) 4.9% |
| Michigan 7 | R+3 | Tim Walberg | Republican | 2010 | Incumbent re-elected. | Gretchen Driskell (Democratic) 40.0% Ken Proctor (Libertarian) 4.9% |
| Michigan 8 | R+2 | Mike Bishop | Republican | 2014 | Incumbent re-elected. | Suzanna Shkreli (Democratic) 39.2% Jeff Wood (Libertarian) 2.6% Maria Green (Green) 1.6% |
| Michigan 9 | D+6 | Sander Levin | Democratic | 1982 | Incumbent re-elected. | Christopher Morse (Republican) 37.4% Matt Orlando (Libertarian) 2.8% John McDermott (Green) 1.9% |
| Michigan 10 | R+6 | Candice Miller | Republican | 2002 | Incumbent retired. Republican hold. |
Frank Accavitti Jr. (Democratic) 32.3% Lisa Gioia (Libertarian) 3.1% Benjamin Nofs (Green) 1.5% |
| Michigan 11 | R+4 | Dave Trott | Republican | 2014 | Incumbent re-elected. | Anil Kumar (Democratic) 40.2% Jonathan Osment (Libertarian) 2.5% Kerry Bentivolio (Independent) 4.4% |
| Michigan 12 | D+15 | Debbie Dingell | Democratic | 2014 | Incumbent re-elected. | Jeff Jones (Republican) 29.3% Tom Bagwell (Libertarian) 2.3% Dylan Calewarts (Green) 1.3% |
| Michigan 13 | D+34 | John Conyers | Democratic | 1964 | Incumbent re-elected. | Jeff Gorman (Republican) 15.7% Tiffany Hayden (Libertarian) 3.8% |
| Michigan 14 | D+29 | Brenda Lawrence | Democratic | 2014 | Incumbent re-elected. | Howard Klausner (Republican) 18.7% Greg Creswell (Libertarian) 1.6% Marcia Squier (Green) 1.2% |
Minnesota[]
| District | Incumbent | This race | ||||
|---|---|---|---|---|---|---|
| Location | PVI | Member | Party | First elected | Results | Candidates[32] |
| Minnesota 1 | R+1 | Tim Walz | Democratic | 2006 | Incumbent re-elected. | Jim Hagedorn (Republican) 49.6% |
| Minnesota 2 | R+2 | John Kline | Republican | 2002 | Incumbent retired. Republican hold. |
Angie Craig (Democratic) 45.2% |
| Minnesota 3 | R+2 | Erik Paulsen | Republican | 2008 | Incumbent re-elected. | Terri Bonoff (Democratic) 43% |
| Minnesota 4 | D+11 | Betty McCollum | Democratic | 2000 | Incumbent re-elected. | Greg Ryan (Republican) 34.4% Susan Sindt (Legal Marijuana Now) 7.7% |
| Minnesota 5 | D+22 | Keith Ellison | Democratic | 2006 | Incumbent re-elected. | Frank Nelson Drake (Republican) 22.3% Dennis Schuller (Legal Marijuana Now) 8.5% |
| Minnesota 6 | R+10 | Tom Emmer | Republican | 2014 | Incumbent re-elected. | David Snyder (Democratic) 34.3% |
| Minnesota 7 | R+6 | Collin Peterson | Democratic | 1990 | Incumbent re-elected. | Dave Hughes (Republican) 47.4% |
| Minnesota 8 | D+1 | Rick Nolan | Democratic | 2012 | Incumbent re-elected. | Stewart Mills (Republican) 49.6% |
Mississippi[]
| District | Incumbent | This race | ||||
|---|---|---|---|---|---|---|
| Location | PVI | Member | Party | First elected | Results | Candidates[33] |
| Mississippi 1 | R+16 | Trent Kelly | Republican | 2015 | Incumbent re-elected. | Jacob Owens (Democratic) 27.9 Chase Wilson (Libertarian) 2.1% |
| Mississippi 2 | D+13 | Bennie Thompson | Democratic | 1993 | Incumbent re-elected. | John Bouie II (Republican) 29.1% |
| Mississippi 3 | R+14 | Gregg Harper | Republican | 2008 | Incumbent re-elected. | Dennis Quinn (Democratic) 30.4% |
| Mississippi 4 | R+21 | Steven Palazzo | Republican | 2010 | Incumbent re-elected. | Mark Gladney (Democratic) 27.8 Ric McCluskey (Libertarian) 5.3% |
Missouri[]
| District | Incumbent | This race | ||||
|---|---|---|---|---|---|---|
| Location | PVI | Member | Party | First elected | Results | Candidates[34] |
| Missouri 1 | D+28 | Lacy Clay | Democratic | 2000 | Incumbent re-elected. | Steven G. Bailey (Republican) 20.0% Robb Cunningham (Libertarian) 4.6% |
| Missouri 2 | R+8 | Ann Wagner | Republican | 2012 | Incumbent re-elected. | Bill Otto (Democratic) 37.7% Jim Higgins (Libertarian) 2.9% |
| Missouri 3 | R+13 | Blaine Luetkemeyer | Republican | 2008 | Incumbent re-elected. | Kevin Miller (Democratic) 27.9% Dan Hogan (Libertarian) 3.3% |
| Missouri 4 | R+13 | Vicky Hartzler | Republican | 2010 | Incumbent re-elected. | Gordon Christensen (Democratic) 27.8% Mark Bliss (Libertarian) 4.3% |
| Missouri 5 | D+9 | Emanuel Cleaver | Democratic | 2004 | Incumbent re-elected. | Jacob Turk (Republican) 38.2% Roy Welborn (Libertarian) 3.0% |
| Missouri 6 | R+12 | Sam Graves | Republican | 2000 | Incumbent re-elected. | David Blackwell (Democratic) 28.4% Russ Monchil (Libertarian) 2.3% |
| Missouri 7 | R+19 | Billy Long | Republican | 2010 | Incumbent re-elected. | Genevieve Williams (Democratic) 27.4% Benjamin Brixey (Libertarian) 5.1% |
| Missouri 8 | R+17 | Jason T. Smith | Republican | 2013 | Incumbent re-elected. | Dave Cowell (Democratic) 22.7% Jonathan Shell (Libertarian) 2.9% |
Montana[]
| District | Incumbent | This race | ||||
|---|---|---|---|---|---|---|
| Location | PVI | Member | Party | First elected | Results | Candidates[35] |
| Montana at-large | R+7 | Ryan Zinke | Republican | 2014 | Incumbent re-elected. | Denise Juneau (Democratic) 40.5% Rick Breckenridge (Libertarian) 3.3% |
Nebraska[]
| District | Incumbent | This race | ||||
|---|---|---|---|---|---|---|
| Location | PVI | Member | Party | First elected | Results | Candidates[36] |
| Nebraska 1 | R+10 | Jeff Fortenberry | Republican | 2004 | Incumbent re-elected. | Daniel Wik (Democratic) 30.5% |
| Nebraska 2 | R+4 | Brad Ashford | Democratic | 2014 | Incumbent lost re-election. Republican gain. |
Brad Ashford (Democratic) 47.7% Steven Laird (Libertarian) 3.3% |
| Nebraska 3 | R+23 | Adrian Smith | Republican | 2006 | Incumbent re-elected. | |
Nevada[]
| District | Incumbent | This race | ||||
|---|---|---|---|---|---|---|
| Location | PVI | Member | Party | First elected | Results | Candidates[37] |
| Nevada 1 | D+14 | Dina Titus | Democratic | 2012 | Incumbent re-elected. | Mary Perry (Republican) 28.8% |
| Nevada 2 | R+5 | Mark Amodei | Republican | 2011 | Incumbent re-elected. | Chip Evans (Democratic) 36.9% |
| Nevada 3 | Even | Joe Heck | Republican | 2010 | Incumbent retired to run for U.S. Senator. Democratic gain. |
Danny Tarkanian (Republican) 46.0% |
| Nevada 4 | D+4 | Cresent Hardy | Republican | 2014 | Incumbent lost re-election. Democratic gain. |
Cresent Hardy (Republican) 44.5% Steve Brown (Libertarian) 3.8% |
New Hampshire[]
| District | Incumbent | This race | ||||
|---|---|---|---|---|---|---|
| Location | PVI | Member | Party | First elected | Results | Candidates[38] |
| New Hampshire 1 | R+1 | Frank Guinta | Republican | 2014 | Incumbent lost re-election. Democratic gain. |
Frank Guinta (Republican) 43.0% |
| New Hampshire 2 | D+3 | Ann McLane Kuster | Democratic | 2012 | Incumbent re-elected. | Jim Lawrence (Republican) 45.3% |
New Jersey[]
| District | Incumbent | This race | ||||
|---|---|---|---|---|---|---|
| Location | PVI | Member | Party | First elected | Results | Candidates[39] |
| New Jersey 1 | D+13 | Donald Norcross | Democratic | 2014 | Incumbent re-elected. | Bob Patterson (Republican) 36.8% |
| New Jersey 2 | D+1 | Frank LoBiondo | Republican | 1994 | Incumbent re-elected. | David Cole (Democratic) 37.2% John Ordille (Libertarian) 1.3% |
| New Jersey 3 | R+1 | Tom MacArthur | Republican | 2014 | Incumbent re-elected. | Fred LaVergne (Democratic) 38.9% |
| New Jersey 4 | R+7 | Chris Smith | Republican | 1980 | Incumbent re-elected. | Lorna Phillipson (Democratic) 33.5% Jeremy Marcus (Libertarian) 1.0% |
| New Jersey 5 | R+4 | Scott Garrett | Republican | 2002 | Incumbent lost re-election. Democratic gain. |
Scott Garrett (Republican) 46.7% Claudio Belusic (Libertarian) 2.2% |
| New Jersey 6 | D+8 | Frank Pallone | Democratic | 1988 | Incumbent re-elected. | Brent Sonnek-Schmelz (Republican) 34.9% |
| New Jersey 7 | R+6 | Leonard Lance | Republican | 2008 | Incumbent re-elected. | Peter Jacob (Democratic) 43.1% Dan O'Neill (Libertarian) 1.6% |
| New Jersey 8 | D+24 | Albio Sires | Democratic | 2006 | Incumbent re-elected. | Agha Khan (Republican) 18.5% Dan Delaney (Libertarian) 2.0% |
| New Jersey 9 | D+14 | Bill Pascrell | Democratic | 1996 | Incumbent re-elected. | Hector Castillo (Republican) 28.0% Diego Rivera (Libertarian) 1.4% |
| New Jersey 10 | D+34 | Donald Payne Jr. | Democratic | 2012 | Incumbent re-elected. | David Pinckney (Republican) 11.9% |
| New Jersey 11 | R+6 | Rodney Frelinghuysen | Republican | 1994 | Incumbent re-elected. | Joseph Wenzel (Democratic) 38.9% Jeff Hetrick (Libertarian) 1.0% |
| New Jersey 12 | D+14 | Bonnie Watson Coleman | Democratic | 2014 | Incumbent re-elected. | Steven Uccio (Republican) 32.0% |
New Mexico[]
| District | Incumbent | This race | ||||
|---|---|---|---|---|---|---|
| Location | PVI | Member | Party | First elected | Results | Candidates[40] |
| New Mexico 1 | D+7 | Michelle Luján Grisham | Democratic | 2012 | Incumbent re-elected | Richard Priem (Republican) 34.9% |
| New Mexico 2 | R+5 | Steve Pearce | Republican | 2010 | Incumbent re-elected | Merrie Lee Soules (Democratic) 37.3% |
| New Mexico 3 | D+8 | Ben Ray Luján | Democratic | 2008 | Incumbent re-elected | Michael Romero (Republican) 37.6% |
New York[]
| District | Incumbent | This race | ||||
|---|---|---|---|---|---|---|
| Location | PVI | Member | Party | First elected | Results | Candidates[41] |
| New York 1 | R+2 | Lee Zeldin | Republican | 2014 | Incumbent re-elected | Anna Throne-Holst (Democratic) 41.0% |
| New York 2 | R+1 | Peter T. King | Republican | 1992 | Incumbent re-elected | DuWayne Gregory (Democratic) 37.5% |
| New York 3 | Even | Steve Israel | Democratic | 2000 | Incumbent retired. Democratic hold. |
Jack Martins (Republican) 47.2% |
| New York 4 | D+3 | Kathleen Rice | Democratic | 2014 | Incumbent re-elected | David Gurfein (Republican) 40.4% |
| New York 5 | D+35 | Gregory Meeks | Democratic | 1998 | Incumbent re-elected | Michael O'Reilly (Republican) 13.0% Frank Francois (Green) 1.4% |
| New York 6 | D+13 | Grace Meng | Democratic | 2012 | Incumbent re-elected | Danniel S. Maio (Republican) 26.7% |
| New York 7 | D+34 | Nydia Velazquez | Democratic | 1992 | Incumbent re-elected | Allan E. Romaguera (Republican) 9.2% |
| New York 8 | D+35 | Hakeem Jeffries | Democratic | 2012 | Incumbent re-elected | Daniel Cavanagh (Conservative) 6.7% |
| New York 9 | D+32 | Yvette Clarke | Democratic | 2006 | Incumbent re-elected | |
| New York 10 | D+23 | Jerrold Nadler | Democratic | 1992 | Incumbent re-elected | Phillip Rosenthal (Republican) 21.9% |
| New York 11 | R+2 | Dan Donovan | Republican | 2015 | Incumbent re-elected | Richard Reichard (Democratic) 36.7% Henry Bardel (Green) 1.5% |
| New York 12 | D+27 | Carolyn Maloney | Democratic | 1992 | Incumbent re-elected | Robert Ardini (Republican) 16.8% |
| New York 13 | D+42 | Charles Rangel | Democratic | 1970 | Incumbent retired. Democratic hold. |
Robert A. Evans Jr. (Republican) 6.9% Daniel Rivera (Green) 3.2% |
| New York 14 | D+26 | Joseph Crowley | Democratic | 1998 | Incumbent re-elected | Frank Spotorno (Republican) 17.1% |
| New York 15 | D+42 | José E. Serrano | Democratic | 1990 | Incumbent re-elected | Alejandro Vega (Republican) 3.5% |
| New York 16 | D+21 | Eliot Engel | Democratic | 1988 | Incumbent re-elected | |
| New York 17 | D+5 | Nita Lowey | Democratic | 1988 | Incumbent re-elected | |
| New York 18 | Even | Sean Patrick Maloney | Democratic | 2012 | Incumbent re-elected | Phil Oliva (Republican) 44.4% |
| New York 19 | D+1 | Chris Gibson | Republican | 2010 | Incumbent retired. Republican hold. |
Zephyr Teachout (Democratic) 45.7% |
| New York 20 | D+7 | Paul Tonko | Democratic | 2008 | Incumbent re-elected | Francis J. Vitollo (Republican) 32.1% |
| New York 21 | Even | Elise Stefanik | Republican | 2014 | Incumbent re-elected | Mike Derrick (Democratic) 30.1% Matt Funiciello (Green) 4.6% |
| New York 22 | R+3 | Richard L. Hanna | Republican | 2010 | Incumbent retired. Republican hold. |
Kim Myers (Democratic) 41.0% Martin Babinec (Reform) 11.8% |
| New York 23 | R+3 | Tom Reed | Republican | 2010 | Incumbent re-elected | John Plumb (Democratic) 42.4% |
| New York 24 | D+5 | John Katko | Republican | 2014 | Incumbent re-elected | Colleen Deacon (Democratic) 39.4% |
| New York 25 | D+7 | Louise Slaughter | Democratic | 1986 | Incumbent re-elected | Mark Assini (Republican) 43.8% |
| New York 26 | D+13 | Brian Higgins | Democratic | 2004 | Incumbent re-elected | Shelly Shratz (Republican) 25.4% |
| New York 27 | R+8 | Chris Collins | Republican | 2012 | Incumbent re-elected | Diana Kastenbaum (Democratic) 32.8% |
North Carolina[]
| District | Incumbent | This race | ||||
|---|---|---|---|---|---|---|
| Location | PVI | Member | Party | First elected | Results | Candidates[42] |
| North Carolina 1 | D+15 | G. K. Butterfield | Democratic | 2004 | Incumbent re-elected. | H. Powell Dew (Republican) 29.0% J. J. Summerell (Libertarian) 2.4% |
| North Carolina 2 | R+8 | Renee Ellmers | Republican | 2010 | Incumbent lost renomination. Republican loss. |
John McNeil (Democratic) 43.3% |
| George Holding Redistricted from the 13th district |
Republican | 2012 | Incumbent re-elected. | |||
| North Carolina 3 | R+11 | Walter B. Jones Jr. | Republican | 1994 | Incumbent re-elected. | Ernest Reeves (Democratic) 32.8% |
| North Carolina 4 | D+13 | David Price | Democratic | 1996 | Incumbent re-elected. | Sue Googe (Republican) 31.8% |
| North Carolina 5 | R+9 | Virginia Foxx | Republican | 2004 | Incumbent re-elected. | Josh Brannon (Democratic) 41.6% |
| North Carolina 6 | R+10 | Mark Walker | Republican | 2014 | Incumbent re-elected. | Pete Glidewell (Democratic) 40.8% |
| North Carolina 7 | R+9 | David Rouzer | Republican | 2014 | Incumbent re-elected. | J. Wesley Casteen (Democratic) 39.1% |
| North Carolina 8 | R+8 | Richard Hudson | Republican | 2012 | Incumbent re-elected. | Thomas Mills (Democratic) 41.2% |
| North Carolina 9 | R+8 | Robert Pittenger | Republican | 2012 | Incumbent re-elected. | Christian Cano (Democratic) 41.8% |
| North Carolina 10 | R+11 | Patrick McHenry | Republican | 2004 | Incumbent re-elected. | Andy Millard (Democratic) 36.9% |
| North Carolina 11 | R+12 | Mark Meadows | Republican | 2012 | Incumbent re-elected. | Rick Bryson (Democratic) 35.9% |
| North Carolina 12 | D+16 | Alma Adams | Democratic | 2014 | Incumbent re-elected. | Leon Threatt (Republican) 33.0% |
| North Carolina 13 | R+5 | None (New seat) | New seat. Republican gain. |
Bruce Davis (Democratic) 43.9% | ||
North Dakota[]
| District | Incumbent | This race | ||||
|---|---|---|---|---|---|---|
| Location | PVI | Member | Party | First elected | Results | Candidates[43] |
| North Dakota at-large | R+10 | Kevin Cramer | Republican | 2012 | Incumbent re-elected | Chase Iron Eyes (Democratic) 23.8% Jack Seaman (Libertarian) 7.0% |
Ohio[]
| District | Incumbent | This race | ||||
|---|---|---|---|---|---|---|
| Location | PVI | Member | Party | First elected | Results | Candidates[44] |
| Ohio 1 | R+6 | Steve Chabot | Republican | 2010 | Incumbent re-elected. | Michele Young (Democratic) 40.8% |
| Ohio 2 | R+8 | Brad Wenstrup | Republican | 2012 | Incumbent re-elected. | William R. Smith (Democratic) 32.8% |
| Ohio 3 | D+17 | Joyce Beatty | Democratic | 2012 | Incumbent re-elected. | John Adams (Republican) 31.4% |
| Ohio 4 | R+9 | Jim Jordan | Republican | 2006 | Incumbent re-elected. | Janet Garrett (Democratic) 32.0% |
| Ohio 5 | R+7 | Bob Latta | Republican | 2006 | Incumbent re-elected. | James L. Neu Jr. (Democratic) 29.1% |
| Ohio 6 | R+8 | Bill Johnson | Republican | 2010 | Incumbent re-elected. | Michael Lorentz (Democratic) 29.3% |
| Ohio 7 | R+6 | Bob Gibbs | Republican | 2010 | Incumbent re-elected. | Roy Rich (Democratic) 29.0% Dan Phillip (Independent) 7.0% |
| Ohio 8 | R+15 | Warren Davidson | Republican | 2016 | Incumbent re-elected. | Steven Fought (Democratic) 27.0% Derrick James Hendricks (Green) 4.3% |
| Ohio 9 | D+15 | Marcy Kaptur | Democratic | 1982 | Incumbent re-elected. | Donald Larson (Republican) 31.3% |
| Ohio 10 | R+3 | Mike Turner | Republican | 2002 | Incumbent re-elected. | Robert Klepinger (Democratic) 32.7% Tom McMasters (Independent) 3.2% |
| Ohio 11 | D+30 | Marcia Fudge | Democratic | 2006 | Incumbent re-elected. | Beverly A. Goldstein (Republican) 19.8% |
| Ohio 12 | R+8 | Pat Tiberi | Republican | 2000 | Incumbent re-elected. | Ed Albertson (Democratic) 29.8% Joe Manchik (Green) 3.6% |
| Ohio 13 | D+11 | Tim Ryan | Democratic | 2002 | Incumbent re-elected. | Richard Morckel (Republican) 32.3% |
| Ohio 14 | R+4 | David Joyce | Republican | 2012 | Incumbent re-elected. | Michael Wager (Democratic) 37.4% |
| Ohio 15 | R+6 | Steve Stivers | Republican | 2010 | Incumbent re-elected. | Scott Wharton (Democratic) 33.8% |
| Ohio 16 | R+6 | Jim Renacci | Republican | 2010 | Incumbent re-elected. | Keith Mundy (Democratic) 34.7% |
Oklahoma[]
| District | Incumbent | This race | ||||
|---|---|---|---|---|---|---|
| Location | PVI | Member | Party | First elected | Results | Candidates[45] |
| Oklahoma 1 | R+18 | Jim Bridenstine | Republican | 2012 | Incumbent re-elected. | |
| Oklahoma 2 | R+20 | Markwayne Mullin | Republican | 2012 | Incumbent re-elected. | Joshua Harris-Till (Democratic) 23.2% |
| Oklahoma 3 | R+26 | Frank Lucas | Republican | 1994 | Incumbent re-elected. | Frankie Robbins (Democratic) 21.7% |
| Oklahoma 4 | R+19 | Tom Cole | Republican | 2002 | Incumbent re-elected. | Christina Owen (Democratic) 26.1% Sevier White (Libertarian) 4.3% |
| Oklahoma 5 | R+12 | Steve Russell | Republican | 2014 | Incumbent re-elected. | Al McAffrey (Democratic) 36.8% Zachary Knight (Libertarian) 6.1% |
Oregon[]
| District | Incumbent | This race | ||||
|---|---|---|---|---|---|---|
| Location | PVI | Member | Party | First elected | Results | Candidates[46] |
| Oregon 1 | D+7 | Suzanne Bonamici | Democratic | 2012 | Incumbent re-elected. | Brian Heinrich (Republican) 37.0% Kyle Sheahan (Libertarian) 3.2% |
| Oregon 2 | R+10 | Greg Walden | Republican | 1998 | Incumbent re-elected. | Jim Crary (Democratic) 28.0% |
| Oregon 3 | D+22 | Earl Blumenauer | Democratic | 1996 | Incumbent re-elected. | |
| Oregon 4 | D+2 | Peter DeFazio | Democratic | 1986 | Incumbent re-elected. | Art Robinson (Republican) 39.7% Gil Guthrie (Libertarian) 1.6% Michael Beilstein (Green) 3.0% |
| Oregon 5 | Even | Kurt Schrader | Democratic | 2008 | Incumbent re-elected. | Colm Willis (Republican) 43.0% |
Pennsylvania[]
| District | Incumbent | This race | ||||
|---|---|---|---|---|---|---|
| Location | PVI | Member | Party | First elected | Results | Candidates[47] |
| Pennsylvania 1 | D+28 | Bob Brady | Democratic | 1998 | Incumbent re-elected. | Deborah Williams (Republican) 17.8% |
| Pennsylvania 2 | D+38 | Vacant | Incumbent Chaka Fattah lost renomination. Incumbent resigned June 23, 2016. Democratic hold. |
James Jones (Republican) 9.8% | ||
| Pennsylvania 3 | R+8 | Mike Kelly | Republican | 2010 | Incumbent re-elected. | |
| Pennsylvania 4 | R+9 | Scott Perry | Republican | 2012 | Incumbent re-elected. | Joshua Burkholder (Democratic) 33.9% |
| Pennsylvania 5 | R+8 | Glenn Thompson | Republican | 2008 | Incumbent re-elected. | Kerith Strano Taylor (Democratic) 32.8% |
| Pennsylvania 6 | R+2 | Ryan Costello | Republican | 2014 | Incumbent re-elected. | Mike Parrish (Democratic) 42.7% |
| Pennsylvania 7 | R+2 | Pat Meehan | Republican | 2010 | Incumbent re-elected. | Mary Ellen Balchunis (Democratic) 40.5% |
| Pennsylvania 8 | R+1 | Mike Fitzpatrick | Republican | 2010 | Incumbent retired. Republican hold. |
Steve Santarsiero (Democratic) 45.6% |
| Pennsylvania 9 | R+14 | Bill Shuster | Republican | 2002 | Incumbent re-elected. | Art Halvorson (Democratic) 36.6% |
| Pennsylvania 10 | R+12 | Tom Marino | Republican | 2010 | Incumbent re-elected. | Mike Molesevich (Democratic) 29.8% |
| Pennsylvania 11 | R+6 | Lou Barletta | Republican | 2010 | Incumbent re-elected. | Michael Marsicano (Democratic) 36.3% |
| Pennsylvania 12 | R+6 | Keith Rothfus | Republican | 2012 | Incumbent re-elected. | Erin McClelland (Democratic) 38.2% |
| Pennsylvania 13 | D+13 | Brendan Boyle | Democratic | 2014 | Incumbent re-elected. | |
| Pennsylvania 14 | D+15 | Michael F. Doyle | Democratic | 1994 | Incumbent re-elected. | Lenny McAllister (Republican) 25.6% |
| Pennsylvania 15 | R+2 | Charlie Dent | Republican | 2004 | Incumbent re-elected. | Rick Daugherty (Democratic) 38.0% Paul Rizzo (Libertarian) 3.6% |
| Pennsylvania 16 | R+4 | Joe Pitts | Republican | 1996 | Incumbent retired. Republican hold. |
Christina Hartman (Democratic) 42.9% Shawn House (Libertarian) 3.4% |
| Pennsylvania 17 | D+4 | Matt Cartwright | Democratic | 2012 | Incumbent re-elected. | Matt Connolly (Republican) 46.2% |
| Pennsylvania 18 | R+10 | Timothy F. Murphy | Republican | 2002 | Incumbent re-elected. | |
Rhode Island[]
| District | Incumbent | This race | ||||
|---|---|---|---|---|---|---|
| Location | PVI | Member | Party | First elected | Results | Candidates[48] |
| Rhode Island 1 | D+15 | David Cicilline | Democratic | 2010 | Incumbent re-elected. | H. Russell Taub (Republican) 35.1% |
| Rhode Island 2 | D+8 | James Langevin | Democratic | 2000 | Incumbent re-elected. | Rhue Reis (Republican) 30.7% Jeffrey Johnson (Independent) 7.1% Salvatore Caiozzo (Independent) 3.9% |
South Carolina[]
| District | Incumbent | This race | ||||
|---|---|---|---|---|---|---|
| Location | PVI | Member | Party | First elected | Results | Candidates[49] |
| South Carolina 1 | R+11 | Mark Sanford | Republican | 2013 | Incumbent re-elected | Dimitri Cherny (Democratic) 36.8% Michael Crier Jr. (Libertarian) 3.6% |
| South Carolina 2 | R+16 | Joe Wilson | Republican | 2001 | Incumbent re-elected | Arik Bjorn (Democratic) 35.9% Eddie McCain (American) 3.8% |
| South Carolina 3 | R+18 | Jeff Duncan | Republican | 2010 | Incumbent re-elected | Hosea Cleveland (Democratic) 27.1% |
| South Carolina 4 | R+15 | Trey Gowdy | Republican | 2010 | Incumbent re-elected | Chris Fedalei (Democratic) 31.0% Michael Chandler (Constitution) 1.7% |
| South Carolina 5 | R+9 | Mick Mulvaney | Republican | 2010 | Incumbent re-elected | Fran Person (Democratic) 38.7% Rudy Barnes Jr. (American) 2.0% |
| South Carolina 6 | D+21 | Jim Clyburn | Democratic | 1992 | Incumbent re-elected | Laura Sterling (Republican) 27.6% Rich Piotrowski (Libertarian) 1.2% Prince Mallory (Green) 1.0% |
| South Carolina 7 | R+7 | Tom Rice | Republican | 2012 | Incumbent re-elected | Mal Hyman (Democratic) 39.0% |
South Dakota[]
| District | Incumbent | This race | ||||
|---|---|---|---|---|---|---|
| Location | PVI | Member | Party | First elected | Results | Candidates[50] |
| South Dakota at-large | R+10 | Kristi Noem | Republican | 2010 | Incumbent re-elected. | Paula Hawks (Democratic) 35.9% |
Tennessee[]
| District | Incumbent | This race | ||||
|---|---|---|---|---|---|---|
| Location | PVI | Member | Party | First elected | Results | Candidates[51] |
| Tennessee 1 | R+25 | Phil Roe | Republican | 2008 | Incumbent re-elected. | Alam Bohms (Democratic) 15.4% Robert Franklin (Independent) 6.2% |
| Tennessee 2 | R+20 | Jimmy Duncan | Republican | 1988 | Incumbent re-elected. | Stuart Starr (Democratic) 24.4% |
| Tennessee 3 | R+16 | Chuck Fleischmann | Republican | 2010 | Incumbent re-elected. | Melody Shekari (Democratic) 28.8% Cassandra Mitchell (Independent) 1.9% Rick Tyler (Independent) 1.9% |
| Tennessee 4 | R+18 | Scott DesJarlais | Republican | 2010 | Incumbent re-elected. | Steven Reynolds (Democratic) 35.0% |
| Tennessee 5 | D+5 | Jim Cooper | Democratic | 2002 | Incumbent re-elected. | Stacy Ries Snyder (Republican) 37.4% |
| Tennessee 6 | R+21 | Diane Black | Republican | 2010 | Incumbent re-elected. | David Kent (Democratic) 21.8% David Ross (Independent) 7.1% |
| Tennessee 7 | R+18 | Marsha Blackburn | Republican | 2002 | Incumbent re-elected. | Tharon Chandler (Democratic) 23.5% Leonard Ladner (Independent) 4.3% |
| Tennessee 8 | R+19 | Stephen Fincher | Republican | 2010 | Incumbent retired. Republican hold. |
Rickey Hobson (Democratic) 25.1% Shelia Godwin (Independent) 2.3% James Hart (Independent) 1.4% |
| Tennessee 9 | D+25 | Steve Cohen | Democratic | 2006 | Incumbent re-elected. | Paul Cook (Independent) 2.4% Wayne Alberson (Republican) 18.9% |
Texas[]
| District | Incumbent | This race | ||||
|---|---|---|---|---|---|---|
| Location | PVI | Member | Party | First elected | Results | Candidates[52] |
| Texas 1 | R+24 | Louie Gohmert | Republican | 2004 | Incumbent re-elected. | Shirley McKellar (Democratic) 24.1% Phil Gray (Libertarian) 1.9% |
| Texas 2 | R+16 | Ted Poe | Republican | 2004 | Incumbent re-elected. | Pat Bryan (Democratic) 36.0% James B. Veasaw (Libertarian) 2.3% Joshua Darr (Green) 1.0% |
| Texas 3 | R+17 | Sam Johnson | Republican | 1991 | Incumbent re-elected. | Adam Bell (Democratic) 34.6% Scott Jameson (Libertarian) 3.3% |
| Texas 4 | R+25 | John Ratcliffe | Republican | 2014 | Incumbent re-elected. | Cody Wommack (Libertarian) 12.0% |
| Texas 5 | R+17 | Jeb Hensarling | Republican | 2002 | Incumbent re-elected. | Ken Ashby (Libertarian) 19.4% |
| Texas 6 | R+11 | Joe Barton | Republican | 1984 | Incumbent re-elected. | Ruby Fay Woolridge (Democratic) 39.0% Darrel Smith Jr. (Green) 2.6% |
| Texas 7 | R+13 | John Culberson | Republican | 2000 | Incumbent re-elected. | James Cargas (Democratic) 43.8% |
| Texas 8 | R+29 | Kevin Brady | Republican | 1996 | Incumbent re-elected. | |
| Texas 9 | D+25 | Al Green | Democratic | 2004 | Incumbent re-elected. | Jeff Martin (Republican) 19.4% |
| Texas 10 | R+11 | Michael McCaul | Republican | 2004 | Incumbent re-elected. | Tawana Cadien (Democratic) 38.4% Bill Kelsey (Libertarian) 4.2% |
| Texas 11 | R+31 | Mike Conaway | Republican | 2004 | Incumbent re-elected. | Nicholas Landholt (Libertarian) 10.5% |
| Texas 12 | R+19 | Kay Granger | Republican | 1996 | Incumbent re-elected. | Bill Bradshaw (Democratic) 26.9% Ed Colliver (Libertarian) 3.8% |
| Texas 13 | R+32 | Mac Thornberry | Republican | 1994 | Incumbent re-elected. | Calvin DeWeese (Libertarian) 6.7% H.F. "Rusty" Tomlinson (Green) 3.4% |
| Texas 14 | R+12 | Randy Weber | Republican | 2012 | Incumbent re-elected. | Michael Cole (Democratic) 38.1% |
| Texas 15 | D+5 | Rubén Hinojosa | Democratic | 1996 | Incumbent retired. Democratic hold. |
Tom Westley (Republican) 37.7% Ross Lynn Leone (Libertarian) 1.9% Vanessa Tijerina (Green) 3.1% |
| Texas 16 | D+12 | Beto O'Rourke | Democratic | 2012 | Incumbent re-elected. | Jaime O. Perez (Libertarian) 10.0% Mary Gourdoux (Green) 4.3% |
| Texas 17 | R+13 | Bill Flores | Republican | 2010 | Incumbent re-elected. | William Matta (Democratic) 35.2% Clark Patterson (Libertarian) 4.0% |
| Texas 18 | D+24 | Sheila Jackson Lee | Democratic | 1994 | Incumbent re-elected. | Lori Bartley (Republican) 23.6% Thomas Kleven (Green) 2.9% |
| Texas 19 | R+26 | Randy Neugebauer | Republican | 2003 | Incumbent retired. Republican hold. |
Troy Bonar (Libertarian) 8.5% Mark Lawson (Green) 4.8% |
| Texas 20 | D+6 | Joaquín Castro | Democratic | 2012 | Incumbent re-elected. | Jeffrey C. Blunt (Libertarian) 15.5% Paul Pipkin (Green) 4.8% |
| Texas 21 | R+12 | Lamar S. Smith | Republican | 1986 | Incumbent re-elected. | Tom Wakely (Democratic) 36.5% Mark Loewe (Libertarian) 4.1% Antonio Diaz (Green) 2.4% |
| Texas 22 | R+15 | Pete Olson | Republican | 2008 | Incumbent re-elected. | Mark Gibson (Democratic) 40.5% |
| Texas 23 | R+3 | Will Hurd | Republican | 2014 | Incumbent re-elected. | Pete Gallego (Democratic) 47.0% Ruben S. Corvalan (Libertarian) 4.7% |
| Texas 24 | R+13 | Kenny Marchant | Republican | 2004 | Incumbent re-elected. | Jan McDowell (Democratic) 39.3% Mike Kolls (Libertarian) 3.1% Kevin McCormick (Green) 1.4% |
| Texas 25 | R+12 | Roger Williams | Republican | 2012 | Incumbent re-elected. | Kathi Thomas (Democratic) 37.7% Loren Marc Schneiderman (Libertarian) 3.9% |
| Texas 26 | R+20 | Michael C. Burgess | Republican | 2002 | Incumbent re-elected. | Eric Mauck (Democratic) 29.6% Mark Boler (Libertarian) 4.0% |
| Texas 27 | R+13 | Blake Farenthold | Republican | 2010 | Incumbent re-elected. | Roy Barrera (Democratic) 38.3% |
| Texas 28 | D+7 | Henry Cuellar | Democratic | 2004 | Incumbent re-elected. | Zeffen Hardin (Republican) 31.3% Michael Cary (Green) 2.5% |
| Texas 29 | D+12 | Gene Green | Democratic | 1992 | Incumbent re-elected. | Julio Garza (Republican) 24.0% N. Ruben Perez (Libertarian) 2.5% James Partsch-Galvan (Green) 1.1% |
| Texas 30 | D+27 | Eddie Bernice Johnson | Democratic | 1992 | Incumbent re-elected. | Charles Lingerfelt (Republican) 19.0% Jarrett R. Woods (Libertarian) 2.2% |
| Texas 31 | R+12 | John Carter | Republican | 2002 | Incumbent re-elected. | Mike Clark (Democratic) 36.5% Scott Ballard (Libertarian) 5.2% |
| Texas 32 | R+10 | Pete Sessions | Republican | 1996 | Incumbent re-elected. | Ed Rankin (Libertarian) 19.0% Gary Stuard (Green) 10.0% |
| Texas 33 | D+18 | Marc Veasey | Democratic | 2012 | Incumbent re-elected. | Mark Mitchell (Republican) 26.3% |
| Texas 34 | D+8 | Filemon Vela Jr. | Democratic | 2012 | Incumbent re-elected. | Rey Gonzalez (Republican) 37.3%< |
| Texas 35 | D+11 | Lloyd Doggett | Democratic | 1994 | Incumbent re-elected. | Susan Narvaiz (Republican) 31.6% Rhett Rosenquest Smith (Libertarian) 3.3% Scott Trimble (Green) 2.1% |
| Texas 36 | R+25 | Brian Babin | Republican | 2014 | Incumbent re-elected. | Hal Ridley Jr. (Green) 11.4% |
Utah[]
| District | Incumbent | This race | ||||
|---|---|---|---|---|---|---|
| Location | PVI | Member | Party | First elected | Results | Candidates[53] |
| Utah 1 | R+27 | Rob Bishop | Republican | 2002 | Incumbent re-elected. | Peter Clemens (Democratic) 26.4% Craig Bowden (Libertarian) 5.9% Chadwick Fairbanks III (Unaffiliated) 1.7% |
| Utah 2 | R+18 | Chris Stewart | Republican | 2012 | Incumbent re-elected. | Charlene Albarran (Democratic) 33.9% Paul J. McCollaum Jr. (Constitution) 4.5% |
| Utah 3 | R+28 | Jason Chaffetz | Republican | 2008 | Incumbent re-elected. | Stephen Tryon (Democratic) 26.5% |
| Utah 4 | R+16 | Mia Love | Republican | 2014 | Incumbent re-elected. | Doug Owens (Democratic) 41.3% Collin R. Simonsen (Constitution) 4.9% |
Vermont[]
| District | Incumbent | This race | ||||
|---|---|---|---|---|---|---|
| Location | PVI | Member | Party | First elected | Results | Candidates[54] |
| Vermont at-large | D+16 | Peter Welch | Democratic | 2006 | Incumbent re-elected. | Erica Clawson (Liberty Union) 9.2% |
Virginia[]
| District | Incumbent | This race | ||||
|---|---|---|---|---|---|---|
| Location | PVI | Member | Party | First elected | Results | Candidates[55] |
| Virginia 1 | R+8 | Rob Wittman | Republican | 2007 | Incumbent re-elected. | Matt Rowe (Democratic) 36.6% Glenda Parker (Independent) 3.4% |
| Virginia 2 | R+4 | Scott Rigell | Republican | 2010 | Incumbent retired. Republican hold. |
Shaun D. Brown (Democratic) 38.5% |
| Randy Forbes Redistricted from the 4th district |
Republican | 2001 | Incumbent lost renomination. Republican loss. | |||
| Virginia 3 | D+15 | Bobby Scott | Democratic | 1992 | Incumbent re-elected. | Marty Williams (Republican) 33.1% |
| Virginia 4 | D+8 | None (New seat) | New seat. Democratic gain. |
Mike Wade (Republican) 42.0% | ||
| Virginia 5 | R+5 | Robert Hurt | Republican | 2010 | Incumbent retired. Republican hold. |
Jane Dittmar (Democratic) 41.6% |
| Virginia 6 | R+12 | Bob Goodlatte | Republican | 1992 | Incumbent re-elected. | Kai Degner (Democratic) 33.2% |
| Virginia 7 | R+8 | Dave Brat | Republican | 2014 | Incumbent re-elected. | Eileen Bedell (Democratic) 42.2% |
| Virginia 8 | D+16 | Don Beyer | Democratic | 2014 | Incumbent re-elected. | Charles Hernick (Republican) 27.3% Julio Gracia (Independent) 4.1% |
| Virginia 9 | R+15 | Morgan Griffith | Republican | 2010 | Incumbent re-elected. | Derek Kitts (Democratic) 28.3% Janice Boyd (Independent) 2.9% |
| Virginia 10 | R+2 | Barbara Comstock | Republican | 2014 | Incumbent re-elected. | LuAnn Bennett (Democratic) 46.9% |
| Virginia 11 | D+10 | Gerry Connolly | Democratic | 2008 | Incumbent re-elected. | |
Washington[]
| District | Incumbent | This race | ||||
|---|---|---|---|---|---|---|
| Location | PVI | Member | Party | First elected | Results | Candidates[56] |
| Washington 1 | D+4 | Suzan DelBene | Democratic | 2012 | Incumbent re-elected. | Robert Sutherland (Republican) 44.6% |
| Washington 2 | D+8 | Rick Larsen | Democratic | 2000 | Incumbent re-elected. | Marc Hennemann (Republican) 36.0% |
| Washington 3 | R+2 | Jaime Herrera Beutler | Republican | 2010 | Incumbent re-elected. | Jim Moeller (Democratic) 38.2% |
| Washington 4 | R+13 | Dan Newhouse | Republican | 2014 | Incumbent re-elected. | Clint Didier (Republican) 42.4% |
| Washington 5 | R+7 | Cathy McMorris Rodgers | Republican | 2004 | Incumbent re-elected. | Joe Pakootas (Democratic) 40.4% |
| Washington 6 | D+5 | Derek Kilmer | Democratic | 2012 | Incumbent re-elected. | Todd Bloom (Republican) 38.5% |
| Washington 7 | D+29 | Jim McDermott | Democratic | 1988 | Incumbent retired. Democratic hold. |
Brady Walkinshaw (Democratic) 44.0% |
| Washington 8 | R+1 | Dave Reichert | Republican | 2004 | Incumbent re-elected. | Tony Ventrella (Democratic) 39.8% |
| Washington 9 | D+17 | Adam Smith | Democratic | 1996 | Incumbent re-elected. | Doug Basler (Republican) 27.1% |
| Washington 10 | D+5 | Dennis Heck | Democratic | 2012 | Incumbent re-elected. | Jim Postma (Republican) 41.3% |
West Virginia[]
| District | Incumbent | This race | ||||
|---|---|---|---|---|---|---|
| Location | PVI | Member | Party | First elected | Results | Candidates[57] |
| West Virginia 1 | R+14 | David McKinley | Republican | 2010 | Incumbent re-elected. | Mike Manypenny (Democratic) 31.0% |
| West Virginia 2 | R+11 | Alex Mooney | Republican | 2014 | Incumbent re-elected. | Mark Hunt (Democratic) 41.8% |
| West Virginia 3 | R+14 | Evan Jenkins | Republican | 2014 | Incumbent re-elected. | Matt Detch (Democratic) 24.0% Zane Lawhorn (Libertarian) 8.1% |
Wisconsin[]
| District | Incumbent | This race | ||||
|---|---|---|---|---|---|---|
| Location | PVI | Member | Party | First elected | Results | Candidates[58] |
| Wisconsin 1 | R+3 | Paul Ryan | Republican | 1998 | Incumbent re-elected. | Ryan Solen (Democratic) 30.2% Jason LeBeck (Libertarian) 2.1% |
| Wisconsin 2 | D+17 | Mark Pocan | Democratic | 2012 | Incumbent re-elected. | Peter Theron (Republican) 31.2% |
| Wisconsin 3 | D+5 | Ron Kind | Democratic | 1996 | Incumbent re-elected. | |
| Wisconsin 4 | D+23 | Gwen Moore | Democratic | 2004 | Incumbent re-elected. | Andy Craig (Libertarian) 11.2% Robert Raymond (Independent) 11.7% |
| Wisconsin 5 | R+13 | Jim Sensenbrenner | Republican | 1978 | Incumbent re-elected. | Khary Penebaker (Democratic) 29.3% John Arndt (Libertarian) 3.9% |
| Wisconsin 6 | R+5 | Glenn Grothman | Republican | 2014 | Incumbent re-elected. | Sarah Lloyd (Democratic) 37.3% Jeff Dahlke (Independent) 5.5% |
| Wisconsin 7 | R+2 | Sean Duffy | Republican | 2010 | Incumbent re-elected. | Mary Hoeft (Democratic) 38.3% |
| Wisconsin 8 | R+2 | Reid Ribble | Republican | 2010 | Incumbent retired. Republican hold. |
Tom Nelson (Democratic) 37.3% |
Wyoming[]
| District | Incumbent | This race | ||||
|---|---|---|---|---|---|---|
| Location | PVI | Member | Party | First elected | Results | Candidates[59] |
| Wyoming at-large | R+22 | Cynthia Lummis | Republican | 2008 | Incumbent retired. Republican hold. |
Ryan Greene (Democratic) 29.2% Daniel Clyde Cummings (Constitution) 4.0% Lawrence Struempf (Libertarian) 3.5% |
Non-voting delegates[]
| District | Incumbent | This race | |||
|---|---|---|---|---|---|
| Delegate | Party | First elected | Results | Candidates[60][61][62][63] | |
| American Samoa at-large | Aumua Amata Radewagen | Republican | 2014 | Incumbent re-elected. | Salu Hunkin-Finau (Democratic) 13.4% Mapu Jamias (Democratic) 8.3% Meleagi Suitonu-Chapman (Democratic) 1.5% |
| District of Columbia at-large | Eleanor Holmes Norton | Democratic | 1990 | Incumbent re-elected. | Martin Moulton (Libertarian) 6.2% Natale Stracuzzi (Green) 4.8% |
| Guam at-large | Madeleine Bordallo | Democratic | Incumbent re-elected. | Felix Camacho (Republican) 45.7% | |
| Northern Mariana Islands at-large | Gregorio Sablan | Independent | 2008 | Incumbent re-elected. | |
| Puerto Rico at-large | Pedro Pierluisi | NPP | 2008 | Incumbent retired to run for Governor. New resident commissioner elected. New Progressive Party of Puerto Rico hold. |
Héctor Ferrer (PDP) 47.2% Hugo Rodríguez (PIP) 2.7% Mariana Nogales Molinelli (PPT) 1.3% |
| United States Virgin Islands at-large | Stacey Plaskett | Democratic | 2014 | Incumbent re-elected. | |
See also[]
- 2016 United States elections
- 2016 United States gubernatorial elections
- 2016 United States presidential election
- 2016 United States Senate elections
- 114th United States Congress
- 115th United States Congress
Notes[]
- ^ As well as the 6 non-voting delegates.
References[]
- ^ a b "Election Statistics, 1920 to Present US House of Representatives: History, Art & Archives". history.house.gov. Retrieved April 26, 2019.
- ^ a b "List of U.S. Congress incumbents who did not run for re-election in 2016". Ballotpedia.
- ^ Dixon, Matt (December 2, 2015). "Siding with redistricting plaintiffs, top court upends political landscape". Politico Florida. Archived from the original on December 3, 2015. Retrieved May 18, 2016.
- ^ "June 7, 2016 Special Congressional General Election Official Canvass". Ohio Secretary of State. Retrieved July 28, 2019.
- ^ Call, The Morning. "Election set to fill seat vacated by convicted congressman Chaka Fattah". Mccall.com.
- ^ "General Election 2016 – State of Hawaii – Statewide November 8, 2016 – Final Summary Report" (PDF). State of Hawaii Office of Elections. November 10, 2016. Retrieved November 12, 2016.
- ^ "KY - Election Results". Secretary of State of Kentucky. Retrieved November 12, 2016.
- ^ a b "State Primary Election Types". National Conference of State Legislatures. June 24, 2014. Retrieved May 19, 2016.
- ^ "2016 Presidential Primary Dates and Candidate Filing Deadlines for Ballot Access" (PDF). FEC. Retrieved April 26, 2016.
- ^ "2016 Alabama House Election Results". Politico.
- ^ "2016 Alaska House Election Results". Politico.
- ^ "2016 Arizona House Election Results". Politico.
- ^ "2016 Arkansas House Election Results". Politico.
- ^ "2016 California House Election Results". Politico.
- ^ "2016 Colorado House Election Results". Politico.
- ^ "2016 Connecticut House Election Results". Politico.
- ^ "2016 Delaware House Election Results". Politico.
- ^ "2016 Florida House Election Results". Politico.
- ^ "2016 Georgia House Election Results". Politico.
- ^ "2016 Hawaii House Election Results". Politico.
- ^ "2016 Idaho House Election Results". Politico.
- ^ "2016 Illinois House Election Results". Politico.
- ^ "2016 Indiana House Election Results". Politico.
- ^ "2016 Iowa House Election Results". Politico.
- ^ "2016 Kansas House Election Results". Politico.
- ^ "2016 Kentucky House Election Results". Politico.
- ^ "2016 Louisiana House Election Results". Politico.
- ^ "2016 Maine House Election Results". Politico.
- ^ "2016 Maryland House Election Results". Politico.
- ^ "2016 Massachusetts House Election Results". Politico.
- ^ "2016 Michigan House Election Results". Politico.
- ^ "2016 Minnesota House Election Results". Politico.
- ^ "2016 Mississippi House Election Results". Politico.
- ^ "2016 Missouri House Election Results". Politico.
- ^ "2016 Montana House Election Results". Politico.
- ^ "2016 Nebraska House Election Results". Politico.
- ^ "2016 Nevada House Election Results". Politico.
- ^ "2016 New Hampshire House Election Results". Politico.
- ^ "2016 New Jersey House Election Results". Politico.
- ^ "2016 New Mexico House Election Results". Politico.
- ^ "2016 New York House Election Results". Politico.
- ^ "2016 North Carolina House Election Results". Politico.
- ^ "2016 North Dakota House Election Results". Politico.
- ^ "2016 Ohio House Election Results". Politico.
- ^ "2016 Oklahoma House Election Results". Politico.
- ^ "2016 Oregon House Election Results". Politico.
- ^ "2016 Pennsylvania House Election Results". Politico.
- ^ "2016 Rhode Island House Election Results". Politico.
- ^ "2016 South Carolina House Election Results". Politico.
- ^ "2016 South Dakota House Election Results". Politico.
- ^ "2016 Tennessee House Election Results". Politico.
- ^ "2016 Texas House Election Results". Politico.
- ^ "2016 Utah House Election Results". Politico.
- ^ "2016 Vermont House Election Results". Politico.
- ^ "2016 Virginia House Election Results". Politico.
- ^ "2016 Washington House Election Results". Politico.
- ^ "2016 West Virginia House Election Results". Politico.
- ^ "2016 Wisconsin House Election Results". Politico.
- ^ "2016 Wyoming House Election Results". Politico.
- ^ "Election Statistics, 1920 to Present". US House of Representatives: History, Art & Archives. September 11, 2001. Retrieved March 30, 2021.
- ^ "General Election 2016 - Certified Results". District of Columbia Board of Elections. Retrieved June 21, 2018.
- ^ https://gec.guam.gov/wp-content/uploads/2016/11/2016-ge-unofficial-summary-group1.htm
- ^ "Election Statistics: 1920 to Present | US House of Representatives: History, Art & Archives".
- 2016 United States House of Representatives elections
- November 2016 events in the United States