California's 27th congressional district
| California's 27th congressional district | |||
|---|---|---|---|
 California's 27th congressional district since January 3, 2013 | |||
| Representative |
| ||
| Population (2019) | 712,783 | ||
| Median household income | $90,792[1] | ||
| Ethnicity |
| ||
| Cook PVI | D+18[2] | ||
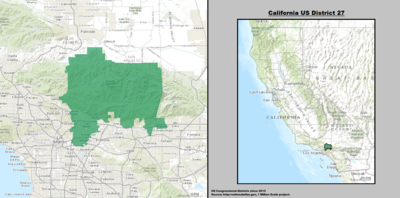
California's 27th congressional district is a congressional district in the U.S. state of California.
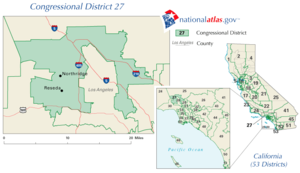
The district is currently represented by Democrat Judy Chu. It comprises parts of Los Angeles and San Bernardino counties and covers much of the San Gabriel Foothills. Communities in the district include Alhambra, Altadena, Arcadia, Bradbury, Claremont, East Pasadena, Monterey Park, Rosemead, San Antonio Heights, San Gabriel, San Marino, Sierra Madre, South Pasadena, and Temple City; most of Glendora and Pasadena; and parts of Monrovia and Upland.
Prior to redistricting in 2011, the district was located entirely within Los Angeles County, encompassing a substantial portion of the San Fernando Valley.
Competitiveness[]
In statewide races[]
| Election results from statewide races | ||
|---|---|---|
| Year | Office | Results |
| 1990 | Governor[3] | Feinstein 52.0% - 42.9% |
| 1992 | President[4] | Clinton 44.3% - 36.6% |
| Senator[5] | Herschensohn 47.5% - 44.9% | |
| Senator (Special)[6] | Feinstein 50.7% - 42.1% | |
| 1994 | Governor[7] | Wilson 59.5% - 37.5% |
| Senator[8] | Huffington 47.7% - 44.6% | |
| 1996 | President[9] | Clinton 49.1% - 40.5% |
| 1998 | Governor[10] | Davis 56.6% - 40.3% |
| Senator[11] | Boxer 51.1% - 45.6% | |
| 2000 | President[12] | Gore 53.4% - 41.4% |
| Senator[13] | Feinstein 56.6% - 36.4% | |
| 2002 | Governor[14] | Davis 50.1% - 40.4% |
| 2003 | Recall[15][16] | |
| Schwarzenegger 52.0% - 29.9% | ||
| 2004 | President[17] | Kerry 59.3% - 39.3% |
| Senator[18] | Boxer 63.7% - 31.2% | |
| 2006 | Governor[19] | Schwarzenegger 52.7% - 42.3% |
| Senator[20] | Feinstein 63.2% - 31.3% | |
| 2008 | President[21] | Obama 66.1% - 31.7% |
| 2010 | Governor[22] | Brown 57.9% - 36.8% |
| Senator[23] | Boxer 57.6% - 36.7% | |
| 2012 | President[24] | Obama 62.6% - 35.0% |
| Senator[25] | Feinstein 65.2% - 34.8% | |
| 2014 | Governor[26] | Brown 62.3% – 37.7% |
| 2016 | President[27] | Clinton 66.0% - 28.4% |
| Senator[28] | Harris 62.1% - 37.9% | |
| 2018 | Governor[29] | Newsom 65.1% – 34.9% |
| Senator[30] | Feinstein 60.1% – 39.9% | |
| 2020 | President[31] | Biden 67.2% - 30.8% |
List of members representing the district[]


Election results[]
|
1952 • 1954 • 1956 • 1958 • 1960 • 1962 • 1964 • 1966 • 1968 • 1969 (Special) • 1970 • 1972 • 1974 • 1976 • 1978 • 1980 • 1982 • 1984 • 1986 • 1988 • 1990 • 1992 • 1994 • 1996 • 1998 • 2000 • 2002 • 2004 • 2006 • 2008 • 2010 • 2012 • 2014 • 2016 • 2018 • 2020 |
1952[]
| Party | Candidate | Votes | % | |
|---|---|---|---|---|
| Democratic | Harry R. Sheppard (Incumbent) | 68,773 | 55.0 | |
| Republican | Carl B. Hilliard | 56,202 | 45.0 | |
| Total votes | 124,975 | 100.0 | ||
| Democratic hold | ||||
1954[]
| Party | Candidate | Votes | % | |
|---|---|---|---|---|
| Democratic | Harry R. Sheppard (Incumbent) | 65,389 | 64.8 | |
| Republican | Martin K. Barrett | 35,594 | 35.2 | |
| Total votes | 100,983 | 100.0 | ||
| Democratic hold | ||||
1956[]
| Party | Candidate | Votes | % | |
|---|---|---|---|---|
| Democratic | Harry R. Sheppard (Incumbent) | 124,662 | 100.0 | |
| Democratic hold | ||||
1958[]
| Party | Candidate | Votes | % | |
|---|---|---|---|---|
| Democratic | Harry R. Sheppard (Incumbent) | 105,062 | 72.3 | |
| Republican | Robert M. Castle | 40,317 | 27.7 | |
| Total votes | 145,379 | 100.0 | ||
| Democratic hold | ||||
1960[]
| Party | Candidate | Votes | % | |
|---|---|---|---|---|
| Democratic | Harry R. Sheppard (Incumbent) | 123,645 | 66.8 | |
| Republican | Robert M. Castle | 61,484 | 33.2 | |
| Total votes | 185,129 | 100.0 | ||
| Democratic hold | ||||
1962[]
| Party | Candidate | Votes | % | |||
|---|---|---|---|---|---|---|
| Democratic | Everett G. Burkhalter | 66,979 | 52.1 | |||
| Republican | Edgar W. Hiestand (Incumbent) | 61,538 | 47.9 | |||
| Total votes | 128,517 | 100.0 | ||||
| Democratic gain from Republican | ||||||
1964[]
| Party | Candidate | Votes | % | |||
|---|---|---|---|---|---|---|
| Republican | Edwin Reinecke | 83,141 | 51.7 | |||
| Democratic | Tom Bane | 77,587 | 48.3 | |||
| Total votes | 160,734 | 100.0 | ||||
| Republican gain from Democratic | ||||||
1966[]
| Party | Candidate | Votes | % | |
|---|---|---|---|---|
| Republican | Edwin Reinecke (Incumbent) | 93,890 | 65.3 | |
| Democratic | John A. "Jack" Howard | 49,785 | 34.7 | |
| Total votes | 143,675 | 100.0 | ||
| Republican hold | ||||
1968[]
| Party | Candidate | Votes | % | |
|---|---|---|---|---|
| Republican | Edwin Reinecke (Incumbent) | 158,309 | 72.2 | |
| Democratic | John T. Butchko | 60,808 | 27.8 | |
| Total votes | 219,117 | 100.0 | ||
| Republican hold | ||||
1969 (Special)[]
| Party | Candidate | Votes | % | |
|---|---|---|---|---|
| Republican | Barry Goldwater Jr. | 64,734 | 56.9 | |
| Democratic | John K. Van de Kamp | 48,983 | 43.1 | |
| Total votes | 113,717 | 100.0 | ||
| Republican hold | ||||
1970[]
| Party | Candidate | Votes | % | |
|---|---|---|---|---|
| Republican | Barry Goldwater Jr. (Incumbent) | 139,326 | 66.6 | |
| Democratic | N. "Toni" Kimmel | 63,652 | 30.5 | |
| Peace and Freedom | Edward Richer | 3,306 | 1.6 | |
| American Independent | John H. Hind | 2,642 | 1.3 | |
| Total votes | 208,926 | 100.0 | ||
| Republican hold | ||||
1972[]
| Party | Candidate | Votes | % | |
|---|---|---|---|---|
| Republican | Barry Goldwater Jr. (Incumbent) | 117,622 | 57.4 | |
| Democratic | Mark S. Novak | 87,295 | 42.6 | |
| Total votes | 204,917 | 100.0 | ||
| Republican hold | ||||
1974[]
| Party | Candidate | Votes | % | |
|---|---|---|---|---|
| Republican | Alphonzo E. Bell Jr. (Incumbent) | 99,645 | 63.9 | |
| Democratic | John Dalessio | 50,919 | 32.5 | |
| Peace and Freedom | Jerry Rubin | 5,547 | 3.6 | |
| Total votes | 156,111 | 100.0 | ||
| Republican hold | ||||
1976[]
| Party | Candidate | Votes | % | |
|---|---|---|---|---|
| Republican | Bob Dornan | 114,623 | 54.7 | |
| Democratic | Gary Familian | 94,988 | 45.3 | |
| Total votes | 209,611 | 100.0 | ||
| Republican hold | ||||
1978[]
| Party | Candidate | Votes | % | |
|---|---|---|---|---|
| Republican | Bob Dornan (Incumbent) | 89,392 | 51.0 | |
| Democratic | Carey Peck | 85,880 | 49.0 | |
| Total votes | 175,272 | 100.0 | ||
| Republican hold | ||||
1980[]
| Party | Candidate | Votes | % | |
|---|---|---|---|---|
| Republican | Bob Dornan (Incumbent) | 109,807 | 51.0 | |
| Democratic | Carey Peck | 100,061 | 46.5 | |
| Libertarian | Jerome L. "Jerry" Sievers | 5,448 | 2.5 | |
| Total votes | 215,316 | 100.0 | ||
| Republican hold | ||||
1982[]
| Party | Candidate | Votes | % | |||
|---|---|---|---|---|---|---|
| Democratic | Mel Levine | 108,347 | 59.5 | |||
| Republican | Bart W. Christensen | 67,479 | 37.0 | |||
| Libertarian | ZacK Richardson | 6,391 | 3.5 | |||
| Total votes | 182,217 | 100.0 | ||||
| Democratic gain from Republican | ||||||
1984[]
| Party | Candidate | Votes | % | |
|---|---|---|---|---|
| Democratic | Mel Levine (Incumbent) | 116,933 | 55.0 | |
| Republican | Robert B. Scribner | 88,896 | 41.8 | |
| Peace and Freedom | Thomas L. O'Connor Jr. | 3,815 | 1.8 | |
| Libertarian | Jeff Avrech | 3,137 | 1.5 | |
| Total votes | 212,781 | 100.0 | ||
| Democratic hold | ||||
1986[]
| Party | Candidate | Votes | % | |
|---|---|---|---|---|
| Democratic | Mel Levine (Incumbent) | 110,403 | 63.7 | |
| Republican | Rob Scribner | 59,410 | 34.3 | |
| Peace and Freedom | Thomas L. O'Connor Jr. | 2,078 | 1.2 | |
| Libertarian | Larry Leathers | 1,429 | 0.8 | |
| Total votes | 173,320 | 100.0 | ||
| Democratic hold | ||||
1988[]
| Party | Candidate | Votes | % | |
|---|---|---|---|---|
| Democratic | Mel Levine (Incumbent) | 148,814 | 67.5 | |
| Republican | Dennis Galbraith | 65,307 | 29.6 | |
| Libertarian | William J. Fulco | 6,214 | 2.8 | |
| Total votes | 220,335 | 100.0 | ||
| Democratic hold | ||||
1990[]
| Party | Candidate | Votes | % | |
|---|---|---|---|---|
| Democratic | Mel Levine (Incumbent) | 90,857 | 58.2 | |
| Republican | David Barrett Cohen | 58,140 | 37.2 | |
| Peace and Freedom | Edward E. Ferrer | 7,101 | 4.5 | |
| Total votes | 156,098 | 100.0 | ||
| Democratic hold | ||||
1992[]
| Party | Candidate | Votes | % | |
|---|---|---|---|---|
| Republican | Carlos Moorhead (Incumbent) | 105,521 | 49.7 | |
| Democratic | Doug Kahn | 83,805 | 39.4 | |
| Green | Jesse A. Moorman | 11,003 | 5.2 | |
| Peace and Freedom | Margaret L. Edwards | 7,329 | 3.5 | |
| Libertarian | Dennis Decherd | 4,790 | 2.3 | |
| Independent | Ballantyne (write-in) | 2 | 0.0 | |
| Total votes | 212,450 | 100.0 | ||
| Republican hold | ||||
1994[]
| Party | Candidate | Votes | % | |
|---|---|---|---|---|
| Republican | Carlos Moorhead (Incumbent) | 88,341 | 53.0 | |
| Democratic | Doug Kahn | 70,267 | 42.1 | |
| American Independent | Bill Gibbs | 4,328 | 2.6 | |
| Libertarian | Dennis Decherd | 3,838 | 2.3 | |
| Total votes | 166,774 | 100.0 | ||
| Republican hold | ||||
1996[]
| Party | Candidate | Votes | % | |
|---|---|---|---|---|
| Republican | Jim Rogan | 95,310 | 50.2 | |
| Democratic | Doug Kahn | 82,014 | 43.2 | |
| Libertarian | Elizabeth Michael | 6,645 | 3.5 | |
| Green | Walt Sheasby | 4,195 | 3.3 | |
| Natural Law | Martin Zucker | 1,766 | 0.8 | |
| Total votes | 189,930 | 100.0 | ||
| Republican hold | ||||
1998[]
| Party | Candidate | Votes | % | |
|---|---|---|---|---|
| Republican | Jim Rogan (Incumbent) | 80,702 | 50.7 | |
| Democratic | Barry A. Gordon | 73,875 | 46.5 | |
| Libertarian | Bob New | 4,489 | 2.8 | |
| Total votes | 159,066 | 100.0 | ||
| Republican hold | ||||
2000[]
| Party | Candidate | Votes | % | |||
|---|---|---|---|---|---|---|
| Democratic | Adam Schiff | 113,708 | 52.7 | |||
| Republican | Jim Rogan (Incumbent) | 94,518 | 43.9 | |||
| Natural Law | Miriam R. Hospodar | 3,873 | 1.7 | |||
| Libertarian | Ted Brown | 3,675 | 1.7 | |||
| Total votes | 215,774 | 100.0 | ||||
| Democratic gain from Republican | ||||||
2002[]
| Party | Candidate | Votes | % | |
|---|---|---|---|---|
| Democratic | Brad Sherman (Incumbent) | 79,815 | 62.0 | |
| Republican | Robert M. Levy | 48,996 | 38.0 | |
| Total votes | 128,811 | 100.0 | ||
| Democratic hold | ||||
2004[]
| Party | Candidate | Votes | % | |
|---|---|---|---|---|
| Democratic | Brad Sherman (Incumbent) | 125,296 | 62.3 | |
| Republican | Robert M. Levy | 66,946 | 33.3 | |
| Green | Eric J. Carter | 8,956 | 4.4 | |
| Total votes | 201,198 | 100.0 | ||
| Democratic hold | ||||
2006[]
| Party | Candidate | Votes | % | |
|---|---|---|---|---|
| Democratic | Brad Sherman (Incumbent) | 92,650 | 68.8 | |
| Republican | Peter Hankwitz | 42,074 | 31.2 | |
| Total votes | 134,724 | 100.0 | ||
| Democratic hold | ||||
2008[]
| Party | Candidate | Votes | % | |
|---|---|---|---|---|
| Democratic | Brad Sherman (Incumbent) | 135,665 | 68.6 | |
| Republican | Navraj Singh | 49,510 | 24.8 | |
| Libertarian | Tim Denton | 14,171 | 6.6 | |
| Total votes | 185,175 | 100.0 | ||
| Democratic hold | ||||
2010[]
| Party | Candidate | Votes | % | |
|---|---|---|---|---|
| Democratic | Brad Sherman (Incumbent) | 102,927 | 65.1 | |
| Republican | Mark Reed | 55,056 | 34.9 | |
| Total votes | 157,983 | 100.0 | ||
| Democratic hold | ||||
2012[]
| Party | Candidate | Votes | % | |
|---|---|---|---|---|
| Democratic | Judy Chu (Incumbent) | 154,191 | 64.0 | |
| Republican | Jack Orswell | 86,817 | 36.0 | |
| Total votes | 241,008 | 100.0 | ||
| Democratic hold | ||||
2014[]
| Party | Candidate | Votes | % | |
|---|---|---|---|---|
| Democratic | Judy Chu (Incumbent) | 75,728 | 59.4 | |
| Republican | Jack Orswell | 51,852 | 40.6 | |
| Total votes | 127,580 | 100.0 | ||
| Democratic hold | ||||
2016[]
| Party | Candidate | Votes | % | |
|---|---|---|---|---|
| Democratic | Judy Chu (Incumbent) | 168,977 | 67.4 | |
| Republican | Jack Orswell | 81,655 | 32.6 | |
| Total votes | 250,632 | 100.0 | ||
| Democratic hold | ||||
2018[]
| Party | Candidate | Votes | % | |
|---|---|---|---|---|
| Democratic | Judy Chu (Incumbent) | 160,504 | 79.2 | |
| Democratic | Bryan Witt | 42,132 | 20.8 | |
| Total votes | 202,636 | 100.0 | ||
| Democratic hold | ||||
2020[]
| Party | Candidate | Votes | % | |
|---|---|---|---|---|
| Democratic | Judy Chu (incumbent) | 221,411 | 69.8 | |
| Republican | Johnny J. Nalbandian | 95,907 | 30.2 | |
| Total votes | 317,318 | 100.0 | ||
| Democratic hold | ||||
See also[]
References[]
- ^ US Census
- ^ "Introducing the 2021 Cook Political Report Partisan Voter Index". The Cook Political Report. April 15, 2021. Retrieved April 15, 2021.
- ^ Statement of Vote (1990 Governor)
- ^ Statement of Vote (1992 President)
- ^ Statement of Vote (1992 Senate)
- ^ Statement of Vote (1992 Senate)
- ^ Statement of Vote (1994 Governor)
- ^ Statement of Vote (1994 Senate)
- ^ Statement of Vote (1996 President)
- ^ Statement of Vote (1998 Governor) Archived September 29, 2011, at the Wayback Machine
- ^ Statement of Vote (1998 Senate) Archived September 29, 2011, at the Wayback Machine
- ^ Statement of Vote (2000 President)
- ^ Statement of Vote (2000 Senator)
- ^ Statement of Vote (2002 Governor)
- ^ Statement of Vote (2003 Recall Question)
- ^ Statement of Vote (2003 Governor)
- ^ Statement of Vote (2004 President)
- ^ Statement of Vote (2004 Senator)
- ^ Statement of Vote (2006 Governor)
- ^ Statement of Vote (2006 Senator)
- ^ Statement of Vote (2008 President)
- ^ Statement of Vote (2010 Governor)
- ^ Statement of Vote (2010 Senator)
- ^ Statement of Vote (2012 President)
- ^ Statement of Vote (2012 Senator)
- ^ Statement of Vote (2014 Governor)
- ^ Statement of Vote (2016 President)
- ^ Statement of Vote (2016 Senator)
- ^ Statement of Vote (2018 Governor)
- ^ Statement of Vote (2018 Senator)
- ^ https://www.dailykos.com/stories/2012/11/19/1163009/-Daily-Kos-Elections-presidential-results-by-congressional-district-for-the-2012-2008-elections
- ^ 1952 election results
- ^ 1954 election results
- ^ 1956 election results
- ^ 1958 election results
- ^ 1960 election results
- ^ 1962 election results
- ^ 1964 election results
- ^ 1966 election results
- ^ 1968 election results
- ^ 1969 special election results
- ^ 1970 election results
- ^ 1972 election results
- ^ 1974 election results
- ^ 1976 election results
- ^ 1978 election results
- ^ 1980 election results
- ^ 1982 election results
- ^ 1984 election results
- ^ 1986 election results
- ^ 1988 election results
- ^ 1990 election results
- ^ 1992 election results
- ^ 1994 election results
- ^ 1996 election results
- ^ 1998 election results
- ^ 2000 election results
- ^ 2002 election results
- ^ 2004 election results
- ^ 2006 election results
- ^ 2008 election results
- ^ 2010 election results
- ^ 2012 election results
- ^ 2014 election results
- ^ 2016 election results
- ^ 2018 election results
External links[]
- GovTrack.us: California's 27th congressional district
- RAND California Election Returns: District Definitions
- California Voter Foundation map - CD27
Coordinates: 34°15′54″N 117°56′06″W / 34.26500°N 117.93500°W

- Congressional districts of California
- Government of Los Angeles County, California
- Alhambra, California
- Altadena, California
- Arcadia, California
- Claremont, California
- Glendora, California
- Monrovia, California
- Pasadena, California
- San Gabriel, California
- San Marino, California
- Sierra Madre, California
- South Pasadena, California
- Temple City, California
- Upland, California
- Constituencies established in 1953
- 1953 establishments in California