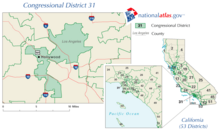
California's 31st congressional district
| California's 31st congressional district | |||
|---|---|---|---|
 California's 31st congressional district since January 3, 2013. | |||
| Representative |
| ||
| Population (2019) | 753,576 | ||
| Median household income | $70,554[1] | ||
| Ethnicity |
| ||
| Cook PVI | D+9[2] | ||
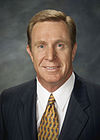
California's 31st congressional district is a congressional district in San Bernardino County, in the U.S. state of California. The district is located in the Inland Empire region, including the city of San Bernardino and portions of Rancho Cucamonga. The district is currently represented by Democrat Pete Aguilar, who was first elected in 2014.
Competitiveness[]
In statewide races[]
| Election results from statewide races | ||
|---|---|---|
| Year | Office | Results |
| 1990 | Governor[3] | Feinstein 60.6% - 34.8% |
| 1992 | President[4] | Clinton 51.7% - 32.3% |
| Senator[5] | Boxer 48.9% - 41.1% | |
| Senator (Special)[6] | Feinstein 57.7% - 33.7% | |
| 1994 | Governor[7] | Brown 52.7% - 43.1% |
| Senator[8] | Feinstein 50.5% - 38.3% | |
| 1996 | President[9] | Clinton 65.4% - 25.8% |
| 1998 | Governor[10] | Davis 71.6% - 25.3% |
| Senator[11] | Boxer 62.1% - 34.1% | |
| 2000 | President[12] | Gore 69.3% - 27.4% |
| Senator[13] | Feinstein 70.4% - 22.3% | |
| 2002 | Governor[14] | Davis 68.6% - 19.5% |
| 2003 | Recall[15][16] | |
| Bustamante 58.5% - 26.5% | ||
| 2004 | President[17] | Kerry 76.9% - 21.6% |
| Senator[18] | Boxer 80.1% - 14.6% | |
| 2006 | Governor[19] | Angelides 66.8% - 26.8% |
| Senator[20] | Feinstein 79.1% - 14.0% | |
| 2008 | President[21] | Obama 79.9% - 17.8% |
| 2010 | Governor[22] | Brown 77.9% - 16.6% |
| Senator[23] | Boxer 78.1% - 16.2% | |
| 2012 | President[24] | Obama 57.2% - 40.6% |
| Senator[25] | Feinstein 58.7% - 41.3% | |
| 2014 | Governor[26] | Brown 52.1% – 47.9% |
| 2016 | President[27] | Clinton 57.7% - 36.6% |
| Senator[28] | Harris 57.2% - 42.8% | |
| 2018 | Governor[29] | Newsom 56.6% – 43.4% |
| Senator[30] | Feinstein 51.2% – 48.8% | |
| 2020 | President[31] | Biden 58.8% - 38.9% |
List of members representing the district[]


Election results[]
|
1962 • 1964 • 1966 • 1968 • 1970 • 1972 • 1974 • 1976 • 1978 • 1980 • 1982 • 1984 • 1986 • 1988 • 1990 • 1992 • 1994 • 1996 • 1998 • 2000 • 2002 • 2004 • 2006 • 2008 • 2010 • 2012 • 2014 • 2016 • 2018 • 2020 |
1962[]
| Party | Candidate | Votes | % | ||
|---|---|---|---|---|---|
| Democratic | Charles H. Wilson (Incumbent) | 76,631 | 52.2 | ||
| Republican | Gordon Hahn | 70,154 | 47.8 | ||
| Total votes | 146,785 | 100.0 | |||
| Democratic win (new seat) | |||||
1964[]
| Party | Candidate | Votes | % | |
|---|---|---|---|---|
| Democratic | Charles H. Wilson (Incumbent) | 114,246 | 64.0 | |
| Republican | Norman G. Shanahan | 64,256 | 36.0 | |
| Total votes | 178,502 | 100.0 | ||
| Democratic hold | ||||
1966[]
| Party | Candidate | Votes | % | |
|---|---|---|---|---|
| Democratic | Charles H. Wilson (Incumbent) | 92,875 | 63.4 | |
| Republican | Norman G. Shanahan | 53,708 | 36.6 | |
| Total votes | 146,583 | 100.0 | ||
| Democratic hold | ||||
1968[]
| Party | Candidate | Votes | % | |
|---|---|---|---|---|
| Democratic | Charles H. Wilson (Incumbent) | 94,387 | 58.9 | |
| Republican | James R. Dunn | 62,711 | 39.1 | |
| American Independent | Stanley L. Schulte | 3,134 | 2.0 | |
| Total votes | 160,232 | 100.0 | ||
| Democratic hold | ||||
1970[]
| Party | Candidate | Votes | % | |
|---|---|---|---|---|
| Democratic | Charles H. Wilson (Incumbent) | 102,071 | 73.2 | |
| Republican | Fred L. Casmir | 37,416 | 26.8 | |
| Total votes | 139,487 | 100.0 | ||
| Democratic hold | ||||
1972[]
| Party | Candidate | Votes | % | |
|---|---|---|---|---|
| Democratic | Charles H. Wilson (Incumbent) | 85,954 | 52.3 | |
| Republican | Ben Valentine | 69,876 | 42.5 | |
| Peace and Freedom | Roberta Lynn Wood | 8,582 | 5.2 | |
| Total votes | 164,412 | 100.0 | ||
| Democratic hold | ||||
1974[]
| Party | Candidate | Votes | % | |
|---|---|---|---|---|
| Democratic | Charles H. Wilson (Incumbent) | 60,560 | 70.5 | |
| Republican | Norman A. Hodges | 23,039 | 26.8 | |
| Peace and Freedom | William C. Taylor | 2,349 | 2.7 | |
| Total votes | 85,948 | 100.0 | ||
| Democratic hold | ||||
1976[]
| Party | Candidate | Votes | % | |
|---|---|---|---|---|
| Democratic | Charles H. Wilson (Incumbent) | 83,155 | 100.0 | |
| Democratic hold | ||||
1978[]
| Party | Candidate | Votes | % | |
|---|---|---|---|---|
| Democratic | Charles H. Wilson (Incumbent) | 55,667 | 67.8 | |
| Republican | Don Grimshaw | 26,490 | 32.2 | |
| Total votes | 82,157 | 100.0 | ||
| Democratic hold | ||||
1980[]
| Party | Candidate | Votes | % | |
|---|---|---|---|---|
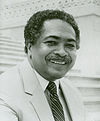
| Democratic | Mervyn M. Dymally | 69,146 | 64.4 | |
| Republican | Don Grimshaw | 38,203 | 35.6 | |
| Total votes | 107,349 | 100.0 | ||
| Democratic hold | ||||
1982[]
| Party | Candidate | Votes | % | |
|---|---|---|---|---|
| Democratic | Mervyn M. Dymally (Incumbent) | 86,718 | 72.4 | |
| Republican | Henry C. Minturn | 33,043 | 27.6 | |
| Total votes | 119,761 | 100.0 | ||
| Democratic hold | ||||
1984[]
| Party | Candidate | Votes | % | |
|---|---|---|---|---|
| Democratic | Mervyn M. Dymally (Incumbent) | 100,658 | 70.7 | |
| Republican | Henry C. Minturn | 41,691 | 29.3 | |
| Total votes | 142,349 | 100.0 | ||
| Democratic hold | ||||
1986[]
| Party | Candidate | Votes | % | |
|---|---|---|---|---|
| Democratic | Mervyn M. Dymally (Incumbent) | 77,126 | 70.3 | |
| Republican | Jack McMurray | 30,322 | 27.6 | |
| Peace and Freedom | B. Kwaku Duren | 2,333 | 2.1 | |
| Total votes | 109,781 | 100.0 | ||
| Democratic hold | ||||
1988[]
| Party | Candidate | Votes | % | |
|---|---|---|---|---|
| Democratic | Mervyn M. Dymally (Incumbent) | 100,919 | 71.6 | |
| Republican | Arnold C. May | 36,017 | 25.5 | |
| Peace and Freedom | B. Kwaku Duren | 4,091 | 2.9 | |
| Total votes | 151,027 | 100.0 | ||
| Democratic hold | ||||
1990[]
| Party | Candidate | Votes | % | |
|---|---|---|---|---|
| Democratic | Mervyn M. Dymally (Incumbent) | 56,394 | 67.1 | |
| Republican | Eunice N. Sato | 27,593 | 32.9 | |
| Total votes | 83,987 | 100.0 | ||
| Democratic hold | ||||
1992[]
| Party | Candidate | Votes | % | |
|---|---|---|---|---|
| Democratic | Matthew G. Martinez (Incumbent) | 68,324 | 62.6 | |
| Republican | Reuben D. Franco | 40,873 | 37.4 | |
| Total votes | 109,197 | 100.0 | ||
| Democratic hold | ||||
1994[]
| Party | Candidate | Votes | % | |
|---|---|---|---|---|
| Democratic | Matthew G. Martinez (Incumbent) | 50,541 | 59.1 | |
| Republican | John V. Flores | 34,926 | 40.9 | |
| Total votes | 85,467 | 100.0 | ||
| Democratic hold | ||||
1996[]
| Party | Candidate | Votes | % | |
|---|---|---|---|---|
| Democratic | Matthew G. Martinez (Incumbent) | 69,285 | 67.5 | |
| Republican | John Flores | 28,705 | 28.0 | |
| Libertarian | Michael Everling | 4,700 | 4.5 | |
| Total votes | 102,690 | 100.0 | ||
| Democratic hold | ||||
1998[]
| Party | Candidate | Votes | % | |
|---|---|---|---|---|
| Democratic | Matthew G. Martinez (Incumbent) | 61,173 | 70.0 | |
| Republican | Frank C. Moreno | 19,786 | 22.7 | |
| Green | Krista Lieberg-Wong | 4,377 | 5.0 | |
| Libertarian | Michael B. Everling | 1,121 | 1.3 | |
| Natural Law | Gary Hearne | 903 | 1.03 | |
| Total votes | 87,360 | 100.0 | ||
| Democratic hold | ||||
2000[]
| Party | Candidate | Votes | % | |
|---|---|---|---|---|
| Democratic | Hilda Solis | 89,600 | 79.4 | |
| Green | Krista Lieberg-Wong | 10,294 | 9.1 | |
| Libertarian | Michael McGuire | 7,138 | 6.3 | |
| Natural Law | Richard D. Griffin | 5,882 | 5.2 | |
| Total votes | 112,914 | 100.0 | ||
| Democratic gain from Republican | ||||
2002[]
| Party | Candidate | Votes | % | |
|---|---|---|---|---|
| Democratic | Xavier Becerra (Incumbent) | 54,569 | 81.2 | |
| Republican | Luis Vega | 12,674 | 18.8 | |
| Total votes | 67,243 | 100.0 | ||
| Democratic hold | ||||
2004[]
| Party | Candidate | Votes | % | |
|---|---|---|---|---|
| Democratic | Xavier Becerra (Incumbent) | 89,363 | 80.3 | |
| Republican | Luis Vega | 22,048 | 19.7 | |
| Total votes | 111,411 | 100.0 | ||
| Democratic hold | ||||
2006[]
| Party | Candidate | Votes | % | |
|---|---|---|---|---|
| Democratic | Xavier Becerra (Incumbent) | 64,952 | 100.0 | |
| Democratic hold | ||||
2008[]
| Party | Candidate | Votes | % | |
|---|---|---|---|---|
| Democratic | Xavier Becerra (Incumbent) | 110,955 | 100.0 | |
| Democratic hold | ||||
2010[]
| Party | Candidate | Votes | % | |
|---|---|---|---|---|
| Democratic | Xavier Becerra (Incumbent) | 76,363 | 83.8 | |
| Republican | Stephen C. Smith | 14,740 | 16.2 | |
| Total votes | 91,103 | 100.0 | ||
| Democratic hold | ||||
2012[]
| Party | Candidate | Votes | % | |
|---|---|---|---|---|
| Republican | Gary Miller (Incumbent) | 88,964 | 55.2 | |
| Republican | Robert Dutton | 72,255 | 44.8 | |
| Total votes | 161,219 | 100.0 | ||
| Republican hold | ||||
2014[]
| Party | Candidate | Votes | % | |
|---|---|---|---|---|
| Democratic | Pete Aguilar | 51,622 | 51.7 | |
| Republican | Paul Chabot | 48,162 | 48.3 | |
| Total votes | 99,784 | 100.0 | ||
| Democratic gain from Republican | ||||
2016[]
| Party | Candidate | Votes | % | |
|---|---|---|---|---|
| Democratic | Pete Aguilar (Incumbent) | 121,070 | 56.1 | |
| Republican | Paul Chabot | 94,866 | 43.9 | |
| Total votes | 215,936 | 100.0 | ||
| Democratic hold | ||||
2018[]
| Party | Candidate | Votes | % | |
|---|---|---|---|---|
| Democratic | Pete Aguilar (Incumbent) | 110,343 | 58.7 | |
| Republican | Sean Flynn | 77,352 | 41.3 | |
| Total votes | 187,695 | 100.0 | ||
| Democratic hold | ||||
2020[]
| Party | Candidate | Votes | % | |
|---|---|---|---|---|
| Democratic | Pete Aguilar (Incumbent) | 175,315 | 61.3 | |
| Republican | Agnes Gibboney | 110,735 | 38.7 | |
| Total votes | 286,045 | 100 | ||
| Democratic hold | ||||
Historical district boundaries[]
Formerly, from 2003 to 2013, the district was located in Los Angeles County. It was the only congressional district entirely based within the City of Los Angeles, and included Hollywood and some predominantly Hispanic/Latino sections of central and northeast Los Angeles.
See also[]
References[]
- ^ US Census
- ^ "Introducing the 2021 Cook Political Report Partisan Voter Index". The Cook Political Report. April 15, 2021. Retrieved April 15, 2021.
- ^ Statement of Vote (1990 Governor)
- ^ Statement of Vote (1992 President)
- ^ Statement of Vote (1992 Senate)
- ^ Statement of Vote (1992 Senate)
- ^ Statement of Vote (1994 Governor)
- ^ Statement of Vote (1994 Senate)
- ^ Statement of Vote (1996 President)
- ^ Statement of Vote (1998 Governor) Archived September 29, 2011, at the Wayback Machine
- ^ Statement of Vote (1998 Senate) Archived September 29, 2011, at the Wayback Machine
- ^ Statement of Vote (2000 President)
- ^ Statement of Vote (2000 Senator)
- ^ Statement of Vote (2002 Governor)
- ^ Statement of Vote (2003 Recall Question)
- ^ Statement of Vote (2003 Governor)
- ^ Statement of Vote (2004 President)
- ^ Statement of Vote (2004 Senator)
- ^ Statement of Vote (2006 Governor)
- ^ Statement of Vote (2006 Senator)
- ^ Statement of Vote (2008 President)
- ^ Statement of Vote (2010 Governor)
- ^ Statement of Vote (2010 Senator)
- ^ Statement of Vote (2012 President)
- ^ Statement of Vote (2012 Senator)
- ^ Statement of Vote (2014 Governor)
- ^ Statement of Vote (2016 President)
- ^ Statement of Vote (2016 Senator)
- ^ Statement of Vote (2018 Governor)
- ^ Statement of Vote (2018 Senator)
- ^ https://www.dailykos.com/stories/2012/11/19/1163009/-Daily-Kos-Elections-presidential-results-by-congressional-district-for-the-2012-2008-elections
- ^ 1962 election results
- ^ 1964 election results
- ^ 1966 election results
- ^ 1968 election results
- ^ 1970 election results
- ^ 1972 election results
- ^ 1974 election results
- ^ 1976 election results
- ^ 1978 election results
- ^ 1980 election results
- ^ 1982 election results
- ^ 1984 election results
- ^ 1986 election results
- ^ 1988 election results
- ^ 1990 election results
- ^ 1992 election results
- ^ 1994 election results
- ^ 1996 election results
- ^ 1998 election results
- ^ 2000 election results
- ^ 2002 election results
- ^ 2004 election results
- ^ 2006 election results
- ^ 2008 election results
- ^ 2010 election results
- ^ 2012 election results
- ^ 2014 election results
- ^ 2016 election results
- ^ 2018 election results
External links[]
- GovTrack.us: California's 31st congressional district
- RAND California Election Returns: District Definitions
- California Voter Foundation map - CD31
Coordinates: 34°06′36″N 117°21′12″W / 34.11000°N 117.35333°W
- Congressional districts of California
- Government of San Bernardino County, California
- Inland Empire
- Rancho Cucamonga, California
- San Bernardino, California
- Colton, California
- Constituencies established in 1963
- 1963 establishments in California