California's 34th congressional district
| California's 34th congressional district | |||
|---|---|---|---|
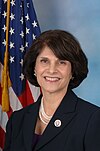
 California's 34th congressional district since January 3, 2013 | |||
| Representative |
| ||
| Population (2019) | 730,042 | ||
| Median household income | $52,043[1] | ||
| Ethnicity |
| ||
| Cook PVI | D+34[2] | ||
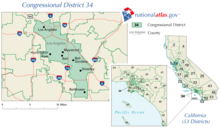
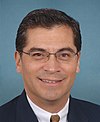
California's 34th congressional district is a U.S. congressional district in California. Located in Los Angeles County, the district is represented by Democrat Jimmy Gomez. Its previous U.S. representative, Democrat Xavier Becerra of Los Angeles, resigned January 24, 2017, to become attorney general of California. Representative Gomez won a special election on June 6, 2017, beating fellow Democrat Robert Lee Ahn to replace Becerra.[3] He was later sworn in as the district's U.S. representative on July 11, 2017.[4]
The district is almost entirely within the City of Los Angeles and includes the following neighborhoods in Central, East and Northeast Los Angeles: Boyle Heights, Chinatown, City Terrace, Cypress Park, Downtown Los Angeles, Eagle Rock, El Sereno, Garvanza, Glassell Park, Highland Park, Koreatown, Little Bangladesh, Little Tokyo, Lincoln Heights, Montecito Heights, Monterey Hills, Mount Washington and Westlake.
Competitiveness[]
In statewide races[]
| Year | Office | Results |
|---|---|---|
| 1990 | Governor[5] | Wilson 47.0% - 46.9% |
| 1992 | President[6] | Clinton 50.9% - 31.1% |
| Senator[7] | Boxer 47.0% - 42.1% | |
| Senator (Special)[8] | Feinstein 56.1% - 34.2% | |
| 1994 | Governor[9] | Brown 52.0% - 43.8% |
| Senator[10] | Feinstein 48.8% - 40.0% | |
| 1996 | President[11] | Clinton 63.5% - 27.2% |
| 1998 | Governor[12] | Davis 69.6% - 27.7% |
| Senator[13] | Boxer 63.5% – 32.7% | |
| 2000 | President[14] | Gore 67.3% - 29.5% |
| Senator[15] | Feinstein 68.9% - 24.2% | |
| 2002 | Governor[16] | Davis 63.4% - 27.3% |
| 2003 | Recall[17][18] | |
| Bustamante 52.6% - 33.4% | ||
| 2004 | President[19] | Kerry 68.8% - 29.8% |
| Senator[20] | Boxer 73.7% - 21.1% | |
| 2006 | Governor[21] | Angelides 62.6% - 32.4% |
| Senator[22] | Feinstein 73.7% - 20.7% | |
| 2008 | President[23] | Obama 74.7% - 23.1% |
| 2010 | Governor[24] | Brown 71.5% - 23.0% |
| Senator[25] | Boxer 71.2% - 22.7% | |
| 2012 | President[26] | Obama 83.0% - 14.1% |
| Senator[27] | Feinstein 84.6% - 15.4% | |
| 2014 | Governor[28] | Brown 83.7% – 16.3% |
| 2016 | President[29] | Clinton 83.6% - 10.7% |
| Senator[30] | Harris 55.4% - 44.6% | |
| 2018 | Governor[31] | Newsom 84.5% – 14.5% |
| Senator[32] | Feinstein 52.0% – 48.0% | |
| 2020 | President[33] | Biden 80.8% - 16.9% |
List of members representing the district[]


Election results[]
|
1962 • 1964 • 1966 • 1968 • 1970 • 1972 • 1974 • 1976 • 1978 • 1980 • 1982 • 1984 • 1986 • 1988 • 1990 • 1992 • 1994 • 1996 • 1998 • 2000 • 2002 • 2004 • 2006 • 2008 • 2010 • 2012 • 2014 • 2016 • 2017 (special) •2018 •2020 |
1962[]
| Party | Candidate | Votes | % | ||
|---|---|---|---|---|---|
| Democratic | Richard T. Hanna | 90,758 | 55.9 | ||
| Republican | Robert A. Geier | 71,478 | 44.1 | ||
| Total votes | 162,236 | 100.0 | |||
| Democratic win (new seat) | |||||
1964[]
| Party | Candidate | Votes | % | |
|---|---|---|---|---|
| Democratic | Richard T. Hanna (Incumbent) | 137,588 | 58.3 | |
| Republican | Robert A. Geier | 98,606 | 41.7 | |
| Total votes | 236,194 | 100.0 | ||
| Democratic hold | ||||
1966[]
| Party | Candidate | Votes | % | |
|---|---|---|---|---|
| Democratic | Richard T. Hanna (Incumbent) | 127,976 | 55.8 | |
| Republican | Frank LaMagna | 101,410 | 44.2 | |
| Total votes | 129,386 | 100.0 | ||
| Democratic hold | ||||
1968[]
| Party | Candidate | Votes | % | |
|---|---|---|---|---|
| Democratic | Richard T. Hanna (Incumbent) | 105,880 | 50.9 | |
| Republican | Bill J. Teague | 102,333 | 49.1 | |
| Total votes | 208,213 | 100.0 | ||
| Democratic hold | ||||
1970[]
| Party | Candidate | Votes | % | |
|---|---|---|---|---|
| Democratic | Richard T. Hanna (Incumbent) | 101,664 | 54.5 | |
| Republican | Bill J. Teague | 82,167 | 44.0 | |
| American Independent | Lee R. Rayburn | 2,843 | 1.5 | |
| Total votes | 186,674 | 100.0 | ||
| Democratic hold | ||||
1972[]
| Party | Candidate | Votes | % | |
|---|---|---|---|---|
| Democratic | Richard T. Hanna (Incumbent) | 113,841 | 67.2 | |
| Republican | John D. Ratterree | 48,916 | 28.9 | |
| American Independent | Lee R. Rayburn | 6,604 | 3.9 | |
| Total votes | 169,361 | 100.0 | ||
| Democratic hold | ||||
1974[]
| Party | Candidate | Votes | % | |
|---|---|---|---|---|
| Democratic | Mark W. Hannaford (Incumbent) | 78,345 | 49.8 | |
| Republican | Bill Bond | 72,967 | 46.3 | |
| American Independent | James Manis | 3,169 | 2.0 | |
| Peace and Freedom | John S. Donohue | 3,043 | 1.9 | |
| Total votes | 157,524 | 100.0 | ||
| Democratic hold | ||||
1976[]
| Party | Candidate | Votes | % | |
|---|---|---|---|---|
| Democratic | Mark W. Hannaford (Incumbent) | 100,988 | 50.7 | |
| Republican | Dan Lungren | 98,147 | 49.3 | |
| Total votes | 199,135 | 100.0 | ||
| Democratic hold | ||||
1978[]
| Party | Candidate | Votes | % | |||
|---|---|---|---|---|---|---|
| Republican | Dan Lungren | 90,554 | 53.7 | |||
| Democratic | Mark W. Hannaford (Incumbent) | 73,608 | 43.7 | |||
| American Independent | Lawrence John Stafford | 4,410 | 2.6 | |||
| Total votes | 168,572 | 100.0 | ||||
| Republican gain from Democratic | ||||||
1980[]
| Party | Candidate | Votes | % | |
|---|---|---|---|---|
| Republican | Dan Lungren (Incumbent) | 138,024 | 71.8 | |
| Democratic | Simone | 46,351 | 24.1 | |
| Peace and Freedom | John S. Donohue | 7,794 | 4.1 | |
| Total votes | 192,169 | 100.0 | ||
| Republican hold | ||||
1982[]
| Party | Candidate | Votes | % | |
|---|---|---|---|---|
| Democratic | Esteban Torres | 68,316 | 57.2 | |
| Republican | Paul R. Jackson | 51,026 | 42.8 | |
| Total votes | 119,342 | 100.0 | ||
| Democratic hold | ||||
1984[]
| Party | Candidate | Votes | % | |
|---|---|---|---|---|
| Democratic | Esteban Torres (Incumbent) | 87,060 | 59.8 | |
| Republican | Paul R. Jackson | 58,467 | 40.2 | |
| Total votes | 145,527 | 100.0 | ||
| Democratic hold | ||||
1986[]
| Party | Candidate | Votes | % | |
|---|---|---|---|---|
| Democratic | Esteban Torres (Incumbent) | 66,404 | 60.3 | |
| Republican | Charles M. House | 43,659 | 39.7 | |
| Total votes | 110,063 | 100.0 | ||
| Democratic hold | ||||
1988[]
| Party | Candidate | Votes | % | |
|---|---|---|---|---|
| Democratic | Esteban Torres (Incumbent) | 92,087 | 63.2 | |
| Republican | Charles M. House | 50,954 | 35.0 | |
| Libertarian | Carl M. "Marty" Swinney | 2,686 | 1.8 | |
| Total votes | 145,727 | 100.0 | ||
| Democratic hold | ||||
1990[]
| Party | Candidate | Votes | % | |
|---|---|---|---|---|
| Democratic | Esteban Torres (Incumbent) | 55,646 | 60.7 | |
| Republican | John C. Eastman | 36,024 | 39.3 | |
| Total votes | 91,670 | 100.0 | ||
| Democratic hold | ||||
1992[]
| Party | Candidate | Votes | % | |
|---|---|---|---|---|
| Democratic | Esteban Torres (Incumbent) | 91,738 | 61.3 | |
| Republican | J. Jay Hernandez | 50,907 | 34.0 | |
| Libertarian | Carl M. "Marty" Swinney | 7,072 | 4.7 | |
| Independent | M V Paul Worland (write-in) | 1 | 0.0 | |
| Total votes | 149,718 | 100.0 | ||
| Democratic hold | ||||
1994[]
| Party | Candidate | Votes | % | |
|---|---|---|---|---|
| Democratic | Esteban Torres (Incumbent) | 72,439 | 61.7 | |
| Republican | Albert J. Nunez | 40,068 | 34.1 | |
| Libertarian | Carl M. "Marty" Swinney | 4,921 | 4.2 | |
| American Independent | J. Scott (write-in) | 27 | 0.0 | |
| Total votes | 117,455 | 100.0 | ||
| Democratic hold | ||||
1996[]
| Party | Candidate | Votes | % | |
|---|---|---|---|---|
| Democratic | Esteban Torres (Incumbent) | 94,730 | 68.5 | |
| Republican | David Nunez | 36,852 | 26.7 | |
| American Independent | J. Scott | 4,122 | 2.9 | |
| Libertarian | David Argall | 2,736 | 1.9 | |
| Total votes | 138,440 | 100.0 | ||
| Democratic hold | ||||
1998[]
| Party | Candidate | Votes | % | |
|---|---|---|---|---|
| Democratic | Grace Napolitano | 76,471 | 67.6 | |
| Republican | Ed Perez | 32,321 | 28.6 | |
| Libertarian | Jason Heath | 2,195 | 2.0 | |
| American Independent | Walter Scott | 2,088 | 1.8 | |
| Total votes | 113,075 | 100.0 | ||
| Democratic hold | ||||
2000[]
| Party | Candidate | Votes | % | |
|---|---|---|---|---|
| Democratic | Grace Napolitano (Incumbent) | 105,980 | 71.3 | |
| Republican | Robert Arthur Canales | 33,445 | 22.5 | |
| Natural Law | Julia F. Simon | 9,262 | 6.2 | |
| Republican | John W. Brantuk (write-in) | 36 | 0.0 | |
| Total votes | 148,723 | 100.0 | ||
| Democratic hold | ||||
2002[]
| Party | Candidate | Votes | % | |
|---|---|---|---|---|
| Democratic | Lucille Roybal-Allard (Incumbent) | 46,734 | 74.1 | |
| Republican | Wayne Miller | 17,090 | 25.9 | |
| Total votes | 63,824 | 100.0 | ||
| Democratic hold | ||||
2004[]
| Party | Candidate | Votes | % | |
|---|---|---|---|---|
| Democratic | Lucille Roybal-Allard (Incumbent) | 82,282 | 74.5 | |
| Republican | Wayne Miller | 28,175 | 25.5 | |
| Total votes | 110,457 | 100.0 | ||
| Democratic hold | ||||
2006[]
| Party | Candidate | Votes | % | |
|---|---|---|---|---|
| Democratic | Lucille Roybal-Allard (Incumbent) | 57,459 | 76.8 | |
| Republican | Wayne Miller | 17,359 | 23.2 | |
| Independent | Naomi Crane (write-in) | 1 | 0.0 | |
| Total votes | 74,819 | 100.0 | ||
| Democratic hold | ||||
2008[]
| Party | Candidate | Votes | % | |
|---|---|---|---|---|
| Democratic | Lucille Roybal-Allard (Incumbent) | 98,503 | 77.1 | |
| Republican | Christopher Balding | 29,266 | 22.9 | |
| Total votes | 127,769 | 100.0 | ||
| Turnout | 63.68 | |||
| Democratic hold | ||||
2010[]
| Party | Candidate | Votes | % | |
|---|---|---|---|---|
| Democratic | Lucille Roybal-Allard (Incumbent) | 69,382 | 77.2 | |
| Republican | Wayne Miller | 20,457 | 22.8 | |
| Total votes | 89,839 | 100.0 | ||
| Democratic hold | ||||
2012[]
| Party | Candidate | Votes | % | |
|---|---|---|---|---|
| Democratic | Xavier Becerra (Incumbent) | 120,367 | 85.6 | |
| Republican | Stephen C. Smith | 20,223 | 14.4 | |
| Total votes | 140,590 | 100.0 | ||
| Democratic hold | ||||
2014[]
| Party | Candidate | Votes | % | |
|---|---|---|---|---|
| Democratic | Xavier Becerra (Incumbent) | 44,697 | 72.5 | |
| Democratic | Adrienne Nicole Edwards | 16,924 | 27.5 | |
| Total votes | 61,621 | 100.0 | ||
| Democratic hold | ||||
2016[]
| Party | Candidate | Votes | % | |
|---|---|---|---|---|
| Democratic | Xavier Becerra (Incumbent) | 122,842 | 77.2 | |
| Democratic | Adrienne Nicole Edwards | 36,314 | 22.8 | |
| Total votes | 159,156 | 100.0 | ||
| Democratic hold | ||||
2017 (Special)[]
| Party | Candidate | Votes | % | ||
|---|---|---|---|---|---|
| Democratic | Jimmy Gomez | 25,569 | 59.2 | ||
| Democratic | Robert Lee Ahn | 17,610 | 40.8 | ||
| Total votes | 43,179 | 100.0 | |||
| Turnout | 14.3 | ||||
| Democratic hold | |||||
2018[]
| Party | Candidate | Votes | % | ||
|---|---|---|---|---|---|
| Democratic | Jimmy Gomez (Incumbent) | 110,195 | 72.5 | ||
| Green | Kenneth Mejia | 41,711 | 27.5 | ||
| Total votes | 151,906 | 100.0 | |||
| Turnout | |||||
| Democratic hold | |||||
2020[]
| Party | Candidate | Votes | % | |
|---|---|---|---|---|
| Democratic | Jimmy Gomez (incumbent) | 108,792 | 53.0 | |
| Democratic | David Kim | 96,554 | 47.0 | |
| Total votes | 205,346 | 100.0 | ||
| Democratic hold | ||||
Historical district boundaries[]
From 2003 through 2013, the district consisted of parts of downtown Los Angeles, including Downey, Bellflower and Maywood. Due to redistricting after the 2010 United States Census, the district pivoted north east within Los Angeles County and still includes downtown Los Angeles and areas north east.
See also[]
References[]
- ^ US Census
- ^ "Introducing the 2021 Cook Political Report Partisan Voter Index". The Cook Political Report. April 15, 2021. Retrieved April 15, 2021.
- ^ My News LA
- ^ LA Times
- ^ Statement of Vote (1990 Governor)
- ^ Statement of Vote (1992 President)
- ^ Statement of Vote (1992 Senate)
- ^ Statement of Vote (1992 Senate)
- ^ Statement of Vote (1994 Governor)
- ^ Statement of Vote (1994 Senate)
- ^ Statement of Vote (1996 President)
- ^ Statement of Vote (1998 Governor) Archived September 29, 2011, at the Wayback Machine
- ^ Statement of Vote (1998 Senate) Archived September 29, 2011, at the Wayback Machine
- ^ Statement of Vote (2000 President)
- ^ Statement of Vote (2000 Senator)
- ^ Statement of Vote (2002 Governor)
- ^ Statement of Vote (2003 Recall Question)
- ^ Statement of Vote (2003 Governor)
- ^ Statement of Vote (2004 President)
- ^ Statement of Vote (2004 Senator)
- ^ Statement of Vote (2006 Governor)
- ^ Statement of Vote (2006 Senator)
- ^ Statement of Vote (2008 President)
- ^ Statement of Vote (2010 Governor)
- ^ Statement of Vote (2010 Senator)
- ^ Statement of Vote (2012 President)
- ^ Statement of Vote (2012 Senator)
- ^ Statement of Vote (2014 Governor)
- ^ Statement of Vote (2016 President)
- ^ Statement of Vote (2016 Senator)
- ^ Statement of Vote (2018 Governor)
- ^ Statement of Vote (2018 Senator)
- ^ "Daily Kos Elections' presidential results by congressional district for 2020, 2016, and 2012".
- ^ 1962 election results
- ^ 1964 election results
- ^ 1966 election results
- ^ 1968 election results
- ^ 1970 election results
- ^ 1972 election results
- ^ 1974 election results
- ^ 1976 election results
- ^ 1978 election results
- ^ 1980 election results
- ^ 1982 election results
- ^ 1984 election results
- ^ 1986 election results
- ^ 1988 election results
- ^ 1990 election results
- ^ 1992 election results
- ^ 1994 election results
- ^ 1996 election results
- ^ 1998 election results
- ^ 2000 election results
- ^ 2002 election results
- ^ 2004 election results
- ^ 2006 election results
- ^ 2008 election results
- ^ 2010 election results
- ^ 2012 election results
- ^ 2014 election results
- ^ 2016 election results
- ^ 2017 special election results
- ^ 2018 election results
External links[]
- California's 34th congressional district, GovTrack.US
- RAND California Election Returns: District Definitions
- California Voter Foundation map - CD34
Coordinates: 34°04′29″N 118°13′42″W / 34.07472°N 118.22833°W

- Congressional districts of California
- Government of Los Angeles County, California
- Government of Los Angeles
- Central Los Angeles
- Eastside Los Angeles
- Northeast Los Angeles
- Boyle Heights, Los Angeles
- Chinatown, Los Angeles
- Downtown Los Angeles
- Cypress Park, Los Angeles
- Eagle Rock, Los Angeles
- El Sereno, Los Angeles
- Glassell Park, Los Angeles
- Highland Park, Los Angeles
- Koreatown, Los Angeles
- Lincoln Heights, Los Angeles
- Little Tokyo, Los Angeles
- Los Angeles River
- Montecito Heights, Los Angeles
- Mount Washington, Los Angeles
- Westlake, Los Angeles
- Constituencies established in 1963
- 1963 establishments in California