U.S. House district for California
Coordinates : 38°00′N 121°18′W / 38.0°N 121.3°W / 38.0; -121.3
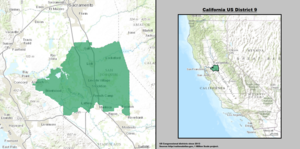
California's 9th congressional district California's 9th congressional district - since January 3, 2013.
Representative Population (2019) 784,956 Median household $72,237[1] Ethnicity Cook PVI D+8[2]
California's 9th congressional district is a congressional district in the U.S. state of California .
Jerry McNerney , a Democrat , has represented the district since January 2013. Currently, the 9th district is centered on Stockton . It consists of most of San Joaquin County and portions of Contra Costa and Sacramento counties. Cities in the district include Antioch , Galt , Oakley , Lathrop , Lodi , Mountain House , and Stockton.[3]
Prior to redistricting by the California Citizens Redistricting Commission of 2011, the 9th district encompassed part of the East Bay region of the San Francisco Bay Area . Cities in the district included Oakland , Berkeley and Castro Valley . Most of that area is now in the 13th district , while the current 9th is primarily made up of portions of the former 18th and 11th districts.
Competitiveness [ ] John Kerry won the district in 2004 with 85.9% of the vote. Barack Obama swept the district in 2008 with 88.13% of the vote while John McCain received 9.87% of the vote, making it Obama's best and McCain's worst performance in California. The current 9th district is substantially more competitive, though it also favors the Democratic Party .
Election results from statewide races [ ]
Year
Office
Results
1992
President
Clinton 78.7 - 12.4%
U.S. Senator
Boxer 80.5 - 14.5%
U.S. Senator
Feinstein 82.9 - 13.0%
1994
Governor
U.S. Senator
1996
President
1998
Governor
U.S. Senator
2000
President [4] Gore 78.6 - 12.0%
Senator [5] Feinstein 73.1 - 12.2%
2002
Governor [6] Davis 67.5 - 12.8%
2003
Recall [7] [8] No 82.1 - 17.9%
Bustamante 66.2 - 14.7%
2004
President [9] Kerry 85.9 - 12.6%
Senator [10] Boxer 84.4 - 11.1%
2006
Governor [11] Angelides 67.3 - 24.0%
Senator [12] Feinstein 81.4 - 8.3%
2008
President [13] Obama 88.1 - 9.9%
2010
Governor
Brown 85.1 - 11.4%
Senator
Boxer 84.8 - 11.7%
2012
President
Obama 57.8 - 40.1%
Senator
Feinstein 59.6 - 40.4%
2014
Governor [14] Brown 55.1 - 44.9%
2016
President
Clinton 56.6 - 38.0%
Senator
Harris 59.0 - 41.0%
2018
Governor
Newsom 53.9 - 46.1%
Senator
de Leon 51.2 - 48.8%
2020
President
Biden 57.9 - 39.9%
List of members representing the district [ ]
Representative
Party
Dates
Cong
Electoral history
Counties
District created on March 4, 1913
Charles W. Bell Progressive
March 4, 1913 –
63rd
Elected in 1912 .Los Angeles outside Los Angeles city
Charles Hiram Randall Prohibition
March 4, 1915 –
64th 65th 66th
Elected in 1914 .Re-elected in 1916 .Re-elected in 1918 .
Vacant
March 4, 1921 –
67th
Representative-elect Charles F. Van de Water died November 20, 1920.
Walter F. Lineberger Republican
April 11, 1921 –
67th 68th 69th
Elected to finish Van de Water's term .Re-elected in 1922 .Re-elected in 1924 .run for U.S. Senator .
William E. Evans Republican
March 4, 1927 –
70th 71st 72nd
Elected in 1926 .Re-elected in 1928 .Re-elected in 1930 .Redistricted to the 11th district
Denver S. Church Democratic
March 4, 1933 –
73rd
Elected in 1932 .1933–1943 Fresno , Kings , Madera , Merced , Stanislaus
Bertrand W. Gearhart Republican
January 3, 1935 –
74th 75th 76th 77th
Elected in 1934 .Re-elected in 1936 .Re-elected in 1938 .Re-elected in 1940 .Re-elected in 1942 .Re-elected in 1944 .Re-elected in 1946 .
1943–1953 Fresno , Madera , Merced , Stanislaus
Cecil F. White Democratic
January 3, 1949 –
81st
Elected in 1948 .
Allan O. Hunter Republican
January 3, 1951 –
82nd
Elected in 1950 .Redistricted to the 12th district
J. Arthur Younger Republican
January 3, 1953 –
83rd 84th 85th 86th 87th
Elected in 1952 .Re-elected in 1954 .Re-elected in 1956 .Re-elected in 1958 .Re-elected in 1960 .Redistricted to the 11th district San Mateo
Don Edwards Democratic
January 3, 1963 –
88th 89th 90th 91st 92nd 93rd
Elected in 1962 .Re-elected in 1964 .Re-elected in 1966 .Re-elected in 1968 .Re-elected in 1970 .Re-elected in 1972 .Redistricted to the 10th district 1963–1967 Santa Clara
1967–1973 Alameda , most of Santa Clara
1973–1975 Alameda , northeast Santa Clara
Pete Stark Democratic
January 3, 1975 –
94th 95th 96th 97th 98th 99th 100th 101st 102nd
Redistricted from the 8th district re-elected in 1974 .Re-elected in 1976 .Re-elected in 1978 .Re-elected in 1980 .Re-elected in 1982 .Re-elected in 1984 .Re-elected in 1986 .Re-elected in 1988 .Re-elected in 1990 .Redistricted to the 13th district 1975–1983 Alameda outside Oakland
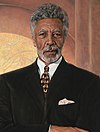
Ron Dellums Democratic
January 3, 1993 –
103rd 104th 105th
Redistricted from the 8th district re-elected in 1992 .Re-elected in 1994 .Re-elected in 1996 .1993–2003 Alameda (Berkeley , Oakland )
Vacant
February 6, 1998 –
105th
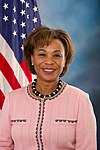
Barbara Lee Democratic
April 7, 1998 –
105th 106th 107th 108th 109th 110th 111th 112th
Elected to finish Dellums's term .Re-elected in 1998 .Re-elected in 2000 .Re-elected in 2002 .Re-elected in 2004 .Re-elected in 2006 .Re-elected in 2008 .Re-elected in 2010 .Redistricted to the 13th district
2003–2013 Alameda (Berkeley , Oakland )
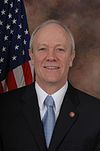
Jerry McNerney Democratic
January 3, 2013 –
113th 114th 115th 116th 117th
Redistricted from the 11th district re-elected in 2012 .Re-elected in 2014 .Re-elected in 2016 .Re-elected in 2018 .Re-elected in 2020 .2013–present Central Valley including San Joaquin Delta and Stockton
Election results [ ] 1912 [ ]
United States House of Representatives elections, 1912
Party
Candidate
Votes
%
Republican Charles W. Bell 28,845
47.2
Democratic
Thomas H. Kirk
14,571
23.9
Socialist
Ralph L. Criswell
11,123
18.2
Prohibition
George S. Yarnall
6,510
10.7
Total votes
61,049
100.0
Turnout
Republican win (new seat)
1914 [ ] 1916 [ ]
United States House of Representatives elections, 1916
Party
Candidate
Votes
%
Prohibition Charles Hiram Randall (Incumbent) 58,826
57.8
Independent
Charles W. Bell
33,270
32.7
Socialist
Ralph L. Criswell
9,661
9.5
Total votes
101,757
100.0
Turnout
Prohibition hold
1918 [ ]
United States House of Representatives elections, 1918
Party
Candidate
Votes
%
Prohibition Charles Hiram Randall (Incumbent) 38,782
53.0
Republican
Montaville Flowers
31,689
43.3
Socialist
Grace Silver Henry
2,718
3.7
Total votes
73,189
100.0
Turnout
Prohibition hold
1920 [ ] 1921 (Special) [ ] Republican Walter F. Lineberger won the special election to replace fellow Republican Charles F. Van de Water , who won the election but died before the 67th Congress convened. Data for this special election is not available.[16]
1922 [ ] 1924 [ ] 1926 [ ] 1928 [ ]
United States House of Representatives elections, 1928 [20]
Party
Candidate
Votes
%
Republican William E. Evans (incumbent ) 222,261
77.0
Democratic
James B. Ogg
58,263
20.2
Socialist
Christian Sorenson
8,090
2.8
Total votes
288,614
100.0
Turnout
Republican hold
1930 [ ] 1932 [ ]
United States House of Representatives elections, 1932 [22]
Party
Candidate
Votes
%
Democratic Denver S. Church 50,125
61.6
Republican
Henry E. Barbour (Incumbent)
31,209
38.4
Total votes
81,334
100.0
Turnout
Democratic gain from Republican
1934 [ ]
United States House of Representatives elections, 1934 [23]
Party
Candidate
Votes
%
Republican
Bertrand W. Gearhart
77,650
100.0
Turnout
Republican gain from Democratic
1936 [ ]
United States House of Representatives elections, 1936 [24]
Party
Candidate
Votes
%
Republican Bertrand W. Gearhart (Incumbent) 82,360
97
Communist
Carl B. Patterson
2,571
3
Total votes
84,931
100
Turnout
Republican hold
1938 [ ]
United States House of Representatives elections, 1938 [25]
Party
Candidate
Votes
%
Republican Bertrand W. Gearhart (Incumbent) 91,128
96.3
No party
George H. Sciaroni (write-in )
3,536
3.7
Total votes
94,664
100.0
Turnout
Republican hold
1940 [ ]
United States House of Representatives elections, 1940 [26]
Party
Candidate
Votes
%
Republican Bertrand W. Gearhart (Incumbent) 99,708
100.0
Turnout
Republican hold
1942 [ ]
United States House of Representatives elections, 1942 [27]
Party
Candidate
Votes
%
Republican Bertrand W. Gearhart (Incumbent) 65,791
100.0
Turnout
Republican hold
1944 [ ]
United States House of Representatives elections, 1944 [28]
Party
Candidate
Votes
%
Republican Bertrand W. Gearhart (Incumbent) 66,845
100.0
Turnout
Republican hold
1946 [ ]
United States House of Representatives elections, 1946 [29]
Party
Candidate
Votes
%
Republican Bertrand W. Gearhart (Incumbent) 50,171
53.7
Democratic
Hubert Phillips
43,244
46.3
Total votes
93,415
100.0
Turnout
Republican hold
1948 [ ]
United States House of Representatives elections, 1948 [30]
Party
Candidate
Votes
%
Democratic Cecil F. White 72,826
51.3
Republican
Bertrand W. Gearhart (Incumbent)
66,563
46.9
Progressive
Josephine F. Daniels
2,573
1.8
Total votes
141,962
100.0
Turnout
Democratic gain from Republican
1950 [ ] 1952 [ ]
United States House of Representatives elections, 1952 [32]
Party
Candidate
Votes
%
Republican J. Arthur Younger (incumbent ) 71,426
53.1
Democratic
Harold F. Taggart
61,028
45.3
Progressive
Charles S. Brown
2,140
1.6
Total votes
134,594
100.0
Turnout
Republican win (new seat)
1954 [ ]
United States House of Representatives elections, 1954 [33]
Party
Candidate
Votes
%
Republican J. Arthur Younger (incumbent ) 60,648
54.5
Democratic
Harold F. Taggart
50,619
45.5
Total votes
111,267
100.0
Turnout
Republican hold
1956 [ ]
United States House of Representatives elections, 1956 [34]
Party
Candidate
Votes
%
Republican J. Arthur Younger (incumbent ) 96,388
60.3
Democratic
James T. McKay
63,504
39.7
Total votes
159,892
100.0
Turnout
Republican hold
1958 [ ]
United States House of Representatives elections, 1958 [35]
Party
Candidate
Votes
%
Republican J. Arthur Younger (incumbent ) 90,735
58.8
Democratic
Elma D. Oddstad
63,597
41.2
Total votes
154,332
100.0
Turnout
Republican hold
1960 [ ]
United States House of Representatives elections, 1960 [36]
Party
Candidate
Votes
%
Republican J. Arthur Younger (incumbent ) 116,589
59.2
Democratic
John D. Kaster
80,227
40.8
Total votes
196,816
100.0
Turnout
Republican hold
1962 [ ]
United States House of Representatives elections, 1962 [37]
Party
Candidate
Votes
%
Democratic Don Edwards 79,616
66
Republican
Joseph F. Donovan
41,104
34
Total votes
120,720
100
Turnout
Democratic win (new seat)
1964 [ ]
United States House of Representatives elections, 1964 [38]
Party
Candidate
Votes
%
Democratic Don Edwards (incumbent ) 115,954
69.8
Republican
Joseph F. Donovan
50,261
30.2
Total votes
166,215
100.0
Turnout
Democratic hold
1966 [ ]
United States House of Representatives elections, 1966 [39]
Party
Candidate
Votes
%
Democratic Don Edwards (incumbent ) 97,311
63.2
Republican
Wilbur G. Durkee
56,784
36.8
Total votes
154,095
100.0
Turnout
Democratic hold
1968 [ ]
United States House of Representatives elections, 1968 [40]
Party
Candidate
Votes
%
Democratic Don Edwards (incumbent ) 100,891
56.5
Republican
Larry Fargher
77,521
43.5
Total votes
178,412
100.0
Turnout
Democratic hold
1970 [ ]
United States House of Representatives elections, 1970 [41]
Party
Candidate
Votes
%
Democratic Don Edwards (incumbent ) 120,041
69.1
Republican
Mark Guerra
49,556
28.5
American Independent Edmon V. Kaiser
4,009
2.3
Total votes
173,606
100.0
Turnout
Democratic hold
1972 [ ]
United States House of Representatives elections, 1972 [42]
Party
Candidate
Votes
%
Democratic Don Edwards (incumbent ) 123,837
72.3
Republican
Herb Smith
43,134
25.2
American Independent Edmon V. Kaiser
4,403
2.5
Total votes
171,374
100
Turnout
Democratic hold
1974 [ ]
United States House of Representatives elections, 1974 [43]
Party
Candidate
Votes
%
Democratic Pete Stark (incumbent ) 87,854
70.6
Republican
Edson Adams
36,522
29.4
Total votes
124,376
100.0
Turnout
Democratic hold
1976 [ ]
United States House of Representatives elections, 1976 [44]
Party
Candidate
Votes
%
Democratic Pete Stark (incumbent ) 116,398
70.8
Republican
James K. Mills
44,607
27.1
Peace and Freedom
Albert L. Sargis
3,386
2.1
Total votes
164,391
100.0
Turnout
Democratic hold
1978 [ ]
United States House of Representatives elections, 1978 [45]
Party
Candidate
Votes
%
Democratic Pete Stark (incumbent ) 88,179
65.4
Republican
Robert S. Allen
41,138
30.5
Peace and Freedom
Lawrance J. Phillips
5,562
4.1
Total votes
134,879
100.0
Turnout
Democratic hold
1980 [ ]
United States House of Representatives elections, 1980 [46]
Party
Candidate
Votes
%
Democratic Pete Stark (incumbent ) 90,504
55.3
Republican
William J. "Bill" Kennedy
67,265
41.1
Libertarian
Steven W. Clanin
5,823
3.6
Total votes
163,592
100.0
Turnout
Democratic hold
1982 [ ]
United States House of Representatives elections, 1982 [47]
Party
Candidate
Votes
%
Democratic Pete Stark (incumbent ) 104,393
60.7
Republican
William J. "Bill" Kennedy
67,702
39.3
Total votes
172,095
100.0
Turnout
Democratic hold
1984 [ ]
United States House of Representatives elections, 1984 [48]
Party
Candidate
Votes
%
Democratic Pete Stark (incumbent ) 136,511
69.9
Republican
J. T. "Eager" Beaver
51,399
26.3
Libertarian
Martha Fuhrig
7,398
3.8
Total votes
195,308
100.0
Turnout
Democratic hold
1986 [ ]
United States House of Representatives elections, 1986 [49]
Party
Candidate
Votes
%
Democratic Pete Stark (incumbent ) 113,490
69.7
Republican
David M. "Dave" Williams
49,300
30.3
Total votes
162,790
100.0
Turnout
Democratic hold
1988 [ ]
United States House of Representatives elections, 1988 [50]
Party
Candidate
Votes
%
Democratic Pete Stark (incumbent ) 152,866
73
Republican
Howard Hertz
56,656
27
Total votes
214,522
100
Turnout
Democratic hold
1990 [ ]
United States House of Representatives elections, 1990 [51]
Party
Candidate
Votes
%
Democratic Pete Stark (incumbent ) 94,739
58.4
Republican
Victor Romero
67,412
41.6
Total votes
162,151
100.0
Turnout
Democratic hold
1992 [ ]
United States House of Representatives elections, 1992 [52]
Party
Candidate
Votes
%
Democratic Ron Dellums (incumbent ) 164,265
71.9
Republican
G. William "Billy" Hunter
53,707
23.5
Peace and Freedom
Dave Linn
10,472
4.6
No party
Muss (write-in )
23
0.0
Total votes
228,467
100.0
Turnout
Democratic hold
1994 [ ]
United States House of Representatives elections, 1994 [53]
Party
Candidate
Votes
%
Democratic Ron Dellums (incumbent ) 129,233
72.25
Republican
Deborah Wright
40,448
22.61
Peace and Freedom
Emma Wong Mar
9,194
5.14
Total votes
178,875
100.0
Turnout
Democratic hold
1996 [ ]
United States House of Representatives elections, 1996 [54]
Party
Candidate
Votes
%
Democratic Ron Dellums (incumbent ) 154,806
77.1
Republican
Deborah Wright
37,126
18.5
Peace and Freedom
Tom Condit
5,561
2.7
Natural Law
Jack Forem
3,475
1.7
Republican
Omari Musa (write-in )
8
0.0
Total votes
200,976
100.0
Turnout
Democratic hold
1998 (Special) [ ]
List of special elections to the United States House of Representatives in California [55]
Party
Candidate
Votes
%
Democratic Barbara Lee 33,497
66.81
Democratic
Greg Harper
8,048
16.05
Republican
Claiborne Sanders
6,114
12.19
Democratic
Randal Stewart
2,481
4.95
Total votes
50,140
100.00
Turnout
Democratic hold
1998 [ ]
United States House of Representatives elections, 1998 [56]
Party
Candidate
Votes
%
Democratic Barbara Lee (incumbent ) 140,722
82.83
Republican
Claiborne "Clay" Sanders
22,431
13.20
Peace and Freedom
Gerald Sanders
4,767
2.81
Natural Law
Walter Ruehlig
1,975
1.16
Total votes
169,895
100.0
Turnout
Democratic hold
2000 [ ]
United States House of Representatives elections, 2000 [57]
Party
Candidate
Votes
%
Democratic Barbara Lee (incumbent ) 182,352
85.0
Republican
Arneze Washington
21,033
9.8
Libertarian
Fred E. Foldvary
7,051
3.3
Natural Law
Ellen Jefferds
4,214
1.9
Total votes
214,650
100.0
Turnout
Democratic hold
2002 [ ]
United States House of Representatives elections, 2002 [58]
Party
Candidate
Votes
%
Democratic Barbara Lee (incumbent ) 135,893
85.0
Republican
Jerald Udinsky
25,333
9.8
Libertarian
James M. Eyer
5,685
3.4
Republican
Hector Reyna (write-in )
6
0.0
Total votes
166,917
100.0
Turnout
Democratic hold
2004 [ ]
United States House of Representatives elections, 2004 [59]
Party
Candidate
Votes
%
Democratic Barbara Lee (incumbent ) 215,630
84.6
Republican
Claudia Bermudez
31,278
12.3
Libertarian
James M. Eyer
8,131
3.1
Total votes
255,039
100.0
Turnout
Democratic hold
2006 [ ]
United States House of Representatives elections, 2006 [60]
Party
Candidate
Votes
%
Democratic Barbara Lee (incumbent ) 167,245
86.4
Republican
John "J.D." Den Dulk
20,786
10.7
Libertarian
James M. Eyer
5,655
2.9
Total votes
193,686
100.0
Turnout
Democratic hold
2008 [ ]
United States House of Representatives elections, 2008 [61]
Party
Candidate
Votes
%
Democratic Barbara Lee (incumbent ) 238,915
86.06
Republican
Charles Hargrave
26,917
9.70
Libertarian
James M. Eyer
11,704
4.22
Total votes
277,536
100.0
Turnout
Democratic hold
2010 [ ]
United States House of Representatives elections, 2010 [62]
Party
Candidate
Votes
%
Democratic Barbara Lee (incumbent ) 180,400
84.27
Republican
Gerald Hashimito
23,054
10.77
Green
Dave Heller
4,848
2.27
Libertarian
James M. Eyer
4,113
1.92
Peace and Freedom
Larry Allen
1,670
0.78
Total votes
214,085
100.0
Turnout
Democratic hold
2012 [ ]
United States House of Representatives elections, 2012 [63]
Party
Candidate
Votes
%
Democratic Jerry McNerney (incumbent ) 118,373
55.6
Republican
Ricky Gill
94,704
44.4
Total votes
213,077
100.0
Democratic hold
2014 [ ]
United States House of Representatives elections, 2014 [64]
Party
Candidate
Votes
%
Democratic Jerry McNerney (incumbent ) 63,475
52.4
Republican
Antonio C. Amador
57,729
47.6
Total votes
121,204
100.0
Democratic hold
2016 [ ]
United States House of Representatives elections, 2016 [65]
Party
Candidate
Votes
%
Democratic Jerry McNerney (incumbent ) 133,163
57.4
Republican
Antonio C. Amador
98,992
42.6
Total votes
232,155
100.0
Democratic hold
2018 [ ]
United States House of Representatives elections, 2018 [66]
Party
Candidate
Votes
%
Democratic Jerry McNerney (incumbent ) 113,414
56.5
Republican
Marla Livengood
87,349
43.5
Total votes
200,763
100.0
Democratic hold
2020 [ ] See also [ ] References [ ]
^ https://www.census.gov/mycd/?st=06&cd=09 ^ "Introducing the 2021 Cook Political Report Partisan Voter Index" . The Cook Political Report. April 15, 2021. Retrieved April 15, 2021 .^ "Maps: Final Congressional Districts" . Citizens Redistricting Commission. Archived from the original on March 10, 2013. Retrieved February 24, 2013 .^ Statement of Vote (2000 President) Archived 2007-06-11 at the Wayback Machine ^ Statement of Vote (2000 Senator) Archived 2007-06-11 at the Wayback Machine ^ Statement of Vote (2002 Governor) Archived 2010-11-11 at the Wayback Machine ^ Statement of Vote (2003 Recall Question) Archived 2011-05-20 at the Wayback Machine ^ Statement of Vote (2003 Governor) Archived 2011-05-20 at the Wayback Machine ^ Statement of Vote (2004 President) Archived 2010-08-01 at the Wayback Machine ^ Statement of Vote (2004 Senator) Archived 2011-08-10 at the Wayback Machine ^ Statement of Vote (2006 Governor) Archived 2011-08-10 at the Wayback Machine ^ Statement of Vote (2006 Senator) Archived 2011-08-10 at the Wayback Machine ^ (2008 President) Archived 2010-07-24 at the Wayback Machine ^ Supplement to the Statement of Vote - Counties by Congressional Districts for Governor ^ 1920 election results ^ 1921 special election results ^ 1922 election results ^ 1924 election results ^ 1926 election results ^ 1928 election results ^ 1930 election results ^ 1932 election results ^ 1934 election results ^ 1936 election results ^ 1938 election results ^ 1940 election results ^ 1942 election results ^ 1944 election results ^ 1946 election results ^ 1948 election results ^ 1950 election results ^ 1952 election results ^ 1954 election results ^ 1956 election results ^ 1958 election results ^ 1960 election results ^ 1962 election results ^ 1964 election results ^ 1966 election results ^ 1968 election results ^ 1970 election results ^ 1972 election results ^ 1974 election results ^ 1976 election results ^ 1978 election results ^ 1980 election results ^ 1982 election results ^ 1984 election results ^ 1986 election results ^ 1988 election results ^ 1990 election results ^ 1992 election results ^ 1994 election results ^ 1996 election results ^ 1998 special election results ^ 1998 election results ^ 2000 election results ^ 2002 general election results Archived February 3, 2009, at the Wayback Machine ^ 2004 general election results [permanent dead link ^ 2006 general election results Archived November 27, 2008, at the Wayback Machine ^ 2008 general election results [permanent dead link ^ 2010 general election results [permanent dead link ^ 2012 general election results Archived October 19, 2013, at the Wayback Machine ^ 2014 general election results ^ 2014 general election results ^ 2018 general election results
External links [ ]
United States portal California portal
hide
The at-large seats only existed from 1850 to 1865 and from 1883 to 1885. See also
California's past and present representatives , senators , and delegations