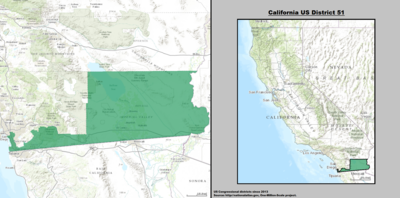
California's 51st congressional district
| California's 51st congressional district | |||
|---|---|---|---|
 California's 51st congressional district since January 3, 2013. | |||
| Representative |
| ||
| Area | 4,896 sq mi (12,680 km2) | ||
| Population (2019) | 740,797[1] | ||
| Median household income | $52,471[2] | ||
| Ethnicity |
| ||
| Cook PVI | D+20[3] | ||
California's 51st congressional district is a congressional district in the U.S. state of California. The district is currently represented by Democrat Juan Vargas.
The district currently includes all of Imperial County and the extreme southern portions of San Diego County, and covers the entirety of California's border with Mexico. Cities in the district include National City, Chula Vista, Imperial Beach and El Centro.
Competitiveness[]
In statewide races[]
| Election results from statewide races | ||
|---|---|---|
| Year | Office | Results |
| 1992 | President[4] | Bush 40.3% – 32.3% |
| Senator[5] | Herschensohn 52.1 – 38.2% | |
| Senator (Special)[6] | Seymour 48.0% – 43.3% | |
| 1994 | Governor[7] | Wilson 69.1% - 27.0% |
| Senator[8] | Huffington 56.4% – 35.7% | |
| 1996 | President[9] | Dole 51.7% – 38.5% |
| 1998 | Governor[10] | Lungren 52.7% – 43.9% |
| Senator[11] | Fong 55.3% – 41.0% | |
| 2000 | President[12] | Bush 55.2% – 40.5% |
| Senator[13] | Campbell 46.7% – 46.2% | |
| 2002 | Governor[14] | Davis 53.5% – 39.7% |
| 2003 | Recall[15][16] | |
| Schwarzenegger 48.8% – 36.4% | ||
| 2004 | President[17] | Kerry 53.4% – 45.7% |
| Senator[18] | Boxer 61.0% - 33.7% | |
| 2006 | Governor[19] | Schwarzenegger 51.6% – 43.1% |
| Senator[20] | Feinstein 62.6% – 32.2% | |
| 2008 | President[21] | Obama 63.1% – 35.5% |
| 2010 | Governor[22] | Brown 56.3% – 36.3% |
| Senator[23] | Boxer 55.5% – 37.4% | |
| 2012 | President[24] | Obama 69.4% – 28.9% |
| Senator[25] | Feinstein 70.1% - 29.9% | |
| 2014 | Governor[26] | Brown 66.2% – 33.8% |
| 2016 | President[27] | Clinton 71.8% – 22.8% |
| Senator[28] | Sanchez 56.6% – 43.4% | |
| 2018 | Governor[29] | Newsom 67.9% – 32.1% |
| Senator[30] | de León 51.6% – 48.4% | |
| 2020 | President[31] | Biden 66.9% – 30.9% |
List of members representing the district[]
| Member | Party | Dates | Cong ress(es) |
Electoral history | Counties |
|---|---|---|---|---|---|
| District created January 3, 1993 | |||||
 Duke Cunningham |
Republican | January 3, 1993 – January 3, 2003 |
103rd 104th 105th 106th 107th |
Redistricted from the 44th district and re-elected in 1992. Re-elected in 1994. Re-elected in 1996. Re-elected in 1998. Re-elected in 2000. Redistricted to the 50th district. |
1993–2003 Northern San Diego |
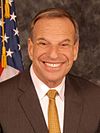 Bob Filner |
Democratic | January 3, 2003 – December 3, 2012 |
108th 109th 110th 111th 112th |
Redistricted from the 50th district and re-elected in 2002. Re-elected in 2004. Re-elected in 2006. Re-elected in 2008. Re-elected in 2010. Resigned to become Mayor of San Diego. |
2003–2013 Imperial Eastern San Diego 
|
| Vacant | December 3, 2012 – January 3, 2013 |
112th | |||
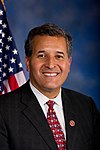 Juan Vargas |
Democratic | January 3, 2013 – present |
113th 114th 115th 116th 117th |
Elected in 2012. Re-elected in 2014. Re-elected in 2016. Re-elected in 2018. Re-elected in 2020. |
2013–Present Imperial Southern San Diego 
|
Election results[]
|
1992 • 1994 • 1996 • 1998 • 2000 • 2002 • 2004 • 2006 • 2008 • 2010 • 2012 • 2014 • 2016 • 2018 • 2020 |
1992[]
| Party | Candidate | Votes | % | |
|---|---|---|---|---|
| Republican | Duke Cunningham (Incumbent) | 141,890 | 56.1 | |
| Democratic | Bea Herbert | 85,148 | 33.7 | |
| Libertarian | Bill Holmes | 10,309 | 4.1 | |
| Peace and Freedom | Miriam Clark | 10,307 | 4.1 | |
| Green | Richard Roe | 5,328 | 2.1 | |
| Independent | Johnson (write-in) | 13 | 0.0 | |
| Total votes | 262,995 | 100.0 | ||
| Republican hold | ||||
1994[]
| Party | Candidate | Votes | % | |
|---|---|---|---|---|
| Republican | Duke Cunningham (Incumbent) | 138,547 | 66.9 | |
| Democratic | Rita K. Tamerius | 57,374 | 27.7 | |
| Libertarian | Bill Holmes | 6,968 | 3.4 | |
| Peace and Freedom | Miriam Clark | 4,099 | 2.0 | |
| Total votes | 206,968 | 100.0 | ||
| Republican hold | ||||
1996[]
| Party | Candidate | Votes | % | |
|---|---|---|---|---|
| Republican | Duke Cunningham (Incumbent) | 149,032 | 65.1 | |
| Democratic | Rita Tamerius | 66,250 | 29.0 | |
| Peace and Freedom | Miriam Clark | 5,407 | 2.3 | |
| Libertarian | J.C. Anderson | 5,298 | 2.3 | |
| Natural Law | Eric Bourdette | 3,037 | 1.3 | |
| Total votes | 215,282 | 100.0 | ||
| Republican hold | ||||
1998[]
| Party | Candidate | Votes | % | |
|---|---|---|---|---|
| Republican | Duke Cunningham (Incumbent) | 126,229 | 61.02 | |
| Democratic | Dan Kripke | 71,706 | 34.66 | |
| Libertarian | Jack Anderson | 5,411 | 2.62 | |
| Natural Law | Eric Bourdette | 3,532 | 1.71 | |
| Independent | Don J. Pando (write-in) | 0 | 0.00 | |
| Total votes | 206,878 | 100.0 | ||
| Republican hold | ||||
2000[]
| Party | Candidate | Votes | % | |
|---|---|---|---|---|
| Republican | Duke Cunningham (Incumbent) | 172,291 | 64.4 | |
| Democratic | George "Jorge" Barraza | 81,408 | 30.4 | |
| Libertarian | Daniel L. Muhe | 7,159 | 2.7 | |
| Natural Law | Eric Hunter Bourdette | 6,941 | 2.5 | |
| Total votes | 267,799 | 100.0 | ||
| Republican hold | ||||
2002[]
| Party | Candidate | Votes | % | |
|---|---|---|---|---|
| Democratic | Bob Filner (Incumbent) | 59,541 | 58.0 | |
| Republican | Maria Guadalupe Garcia | 40,430 | 39.3 | |
| Libertarian | Jeffrey S. Keup | 2,816 | 2.7 | |
| Total votes | 102,787 | 100.0 | ||
| Democratic hold | ||||
2004[]
| Party | Candidate | Votes | % | |
|---|---|---|---|---|
| Democratic | Bob Filner (Incumbent) | 111,441 | 61.7 | |
| Republican | Michael Giorgino | 63,526 | 35.1 | |
| Libertarian | Michael S. Metti | 5,912 | 3.2 | |
| Total votes | 180,879 | 100.0 | ||
| Democratic hold | ||||
2006[]
| Party | Candidate | Votes | % | |
|---|---|---|---|---|
| Democratic | Bob Filner (Incumbent) | 78,114 | 67.5 | |
| Republican | Blake L. Miles | 34,931 | 30.1 | |
| Libertarian | Dan Litwin | 2,790 | 2.4 | |
| Independent | David Arguello (write-in) | 4 | 0.0 | |
| Total votes | 115,839 | 100.0 | ||
| Democratic hold | ||||
2008[]
| Party | Candidate | Votes | % | |
|---|---|---|---|---|
| Democratic | Bob Filner (Incumbent) | 148,281 | 72.8 | |
| Republican | David Lee Joy | 49,345 | 24.2 | |
| Libertarian | Dan Litwin | 6,199 | 3.0 | |
| Total votes | 203,825 | 100.0 | ||
| Democratic hold | ||||
2010[]
| Party | Candidate | Votes | % | |
|---|---|---|---|---|
| Democratic | Bob Filner (Incumbent) | 86,411 | 60.1 | |
| Republican | Nick Popaditch | 57,480 | 39.9 | |
| Green | Marcus Jay Shapiro | 5 | 0 | |
| Total votes | 143,891 | 100.0 | ||
| Democratic hold | ||||
2012[]
| Party | Candidate | Votes | % | |
|---|---|---|---|---|
| Democratic | Juan Vargas | 85,672 | 71.5 | |
| Republican | Michael Crimmins | 36,649 | 28.5 | |
| Total votes | 122,321 | 100.0 | ||
| Democratic hold | ||||
2014[]
| Party | Candidate | Votes | % | |
|---|---|---|---|---|
| Democratic | Juan Vargas (Incumbent) | 56,373 | 68.8 | |
| Republican | Stephen Meade | 25,577 | 31.2 | |
| Total votes | 81,950 | 100.0 | ||
| Democratic hold | ||||
2016[]
| Party | Candidate | Votes | % | |
|---|---|---|---|---|
| Democratic | Juan Vargas (Incumbent) | 145,162 | 72.8 | |
| Republican | Juan M Hidalgo Jr | 54,362 | 27.2 | |
| Total votes | 199,524 | 100.0 | ||
| Democratic hold | ||||
2018[]
| Party | Candidate | Votes | % | |
|---|---|---|---|---|
| Democratic | Juan Vargas (Incumbent) | 109,527 | 71.2 | |
| Republican | Juan M Hidalgo Jr | 44,301 | 28.8 | |
| Total votes | 153,828 | 100.0 | ||
| Democratic hold | ||||
2020[]
| Party | Candidate | Votes | % | |
|---|---|---|---|---|
| Democratic | Juan Vargas (Incumbent) | 165,596 | 68.3 | |
| Republican | Juan M Hidalgo Jr | 76,841 | 31.7 | |
| Total votes | 242,437 | 100.0 | ||
| Democratic hold | ||||
Historical district boundaries[]
In the 1980s, California's 44th congressional district was one of four that divided San Diego. The district had been held for eight years by Democrat Jim Bates, and was considered the most Democratic district in the San Diego area. Randy "Duke" Cunningham won the Republican nomination and won the general election by just a point, meaning that the San Diego area was represented entirely by Republicans for only the second time since the city was split into three districts after the 1960 United States census.
After the 1990 United States census, the district was renumbered the 51st congressional district and much of its share of San Diego was moved to the new 50th congressional district.
See also[]
References[]
- ^ "American Fact Finder - Results". United States Census Bureau. Archived from the original on February 13, 2020. Retrieved May 20, 2015.
- ^ US Census
- ^ "Partisan Voting Index – Districts of the 115th Congress" (PDF). The Cook Political Report. April 7, 2017. Retrieved April 7, 2017.
- ^ Statement of Vote (1992 President)
- ^ Statement of Vote (1992 Senate)
- ^ Statement of Vote (1992 Senate)
- ^ Statement of Vote (1994 Governor)
- ^ Statement of Vote (1994 Senate)
- ^ Statement of Vote (1996 President)
- ^ Statement of Vote (1998 Governor) Archived September 29, 2011, at the Wayback Machine
- ^ Statement of Vote (1998 Senate) Archived September 29, 2011, at the Wayback Machine
- ^ Statement of Vote (2000 President)
- ^ Statement of Vote (2000 Senator)
- ^ Statement of Vote (2002 Governor)
- ^ Statement of Vote (2003 Recall Question)
- ^ Statement of Vote (2003 Governor)
- ^ Statement of Vote (2004 President)
- ^ Statement of Vote (2004 Senator)
- ^ Statement of Vote (2006 Governor)
- ^ Statement of Vote (2006 Senator)
- ^ Statement of Vote (2008 President)
- ^ Statement of Vote (2010 Governor)
- ^ Statement of Vote (2010 Senator)}}
- ^ Statement of Vote (2012 President)
- ^ Statement of Vote (2012 Senate)
- ^ Statement of Vote (2014 Governor)
- ^ Statement of Vote (2016 President)
- ^ Statement of Vote (2016 Senator)
- ^ Statement of Vote (2018 Governor)
- ^ Statement of Vote (2018 Senator)
- ^ "Daily Kos Elections' presidential results by congressional district for 2020, 2016, and 2012".
- ^ 1992 election results
- ^ 1994 election results
- ^ 1996 election results
- ^ 1998 election results
- ^ 2000 election results
- ^ 2002 election results
- ^ 2004 election results
- ^ 2006 election results
- ^ 2008 election results
- ^ 2010 election results
- ^ 2012 election results
- ^ 2014 election results
- ^ 2016 election results
- ^ 2018 election results
External links[]

- Congressional districts of California
- Government of Imperial County, California
- Government of San Diego County, California
- Government of San Diego
- Imperial Valley
- Mountain Empire (San Diego County)
- South Bay (San Diego County)
- Brawley, California
- Calexico, California
- Chula Vista, California
- El Centro, California
- National City, California
- Constituencies established in 1993
- 1993 establishments in California