U.S. House district for California
California's 45th congressional district California's 45th congressional district since January 3, 2013
Representative Population (2019) 791,311 Median household $115,427[1] Ethnicity Cook PVI D+3[2]
California's 45th congressional district is a congressional district in the U.S. state of California .
The district is based in Orange County and includes all of Irvine , Tustin , North Tustin , Villa Park , Laguna Hills , Lake Forest , and Rancho Santa Margarita , as well as parts of Anaheim , Orange , Laguna Woods , Mission Viejo , and Trabuco Canyon .
Katie Porter , a Democrat, has represented the district since January 2019. She is the first Democrat to do so.
Competitiveness [ ] 2018 midterm elections [ ] Main article: United States House of Representatives elections in California, 2018 § District 45
Incumbent Walters competed against a field of four Democrats and an independent candidate in the primary election for the 2018 midterm elections . On February 25, 2018, UC Irvine (UCI) assistant law professor Dave Min received the endorsement of the California Democratic Party .[3]
Min, former White House senior technology advisor Brian Forde ,[4] Sherrod Brown (D-OH) Kia Hamadanchy,[5] Katie Porter ,[6]
On November 14, 2018, 8 days after polls closed, David Wasserman, then the House Editor for The Cook Political Report , projected that Porter had won the general election.[7]
In statewide races [ ] List of members representing the district [ ]
Member
Party
Dates
Cong
Electoral history
Counties
District created January 3, 1983
Duncan Hunter Republican
January 3, 1983 –
98th 99th 100th 101st 102nd
Redistricted from the 42nd district re-elected in 1982 .Re-elected in 1984 .Re-elected in 1986 .Re-elected in 1988 .Re-elected in 1990 .52nd district
1983–1993 Imperial , San Diego
Dana Rohrabacher Republican
January 3, 1993 –
103rd 104th 105th 106th 107th
Redistricted from the 42nd district re-elected in 1992 .Re-elected in 1994 .Re-elected in 1996 .Re-elected in 1998 .Re-elected in 2000 .46th district
1993–2003 Orange
Mary Bono Republican
January 3, 2003 –
108th 109th 110th 111th 112th
Redistricted from the 44th district re-elected in 2002 .Re-elected in 2004 .Re-elected in 2006 .Re-elected in 2008 .Re-elected in 2010 .36th district
2003–2013 Riverside
John Campbell Republican
January 3, 2013 –
113th
Redistricted from the 48th district re-elected in 2012 .
2013–Present Orange
Mimi Walters Republican
January 3, 2015 –
114th 115th
Elected in 2014 .Re-elected in 2016 .Lost re-election .
Katie Porter Democratic
January 3, 2019 –
116th 117th
Elected in 2018 .Re-elected in 2020 .
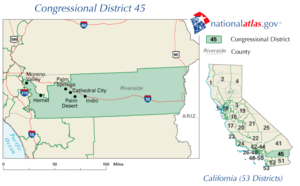
Election results [ ] 1982 [ ] 1984 [ ] 1986 [ ] 1988 [ ] 1990 [ ] 1992 [ ] 1994 [ ] 1996 [ ] 1998 [ ] 2000 [ ] 2002 [ ] 2004 [ ] 2006 [ ] 2008 [ ] 2010 [ ] 2012 [ ] 2014 [ ] 2016 [ ] 2018 [ ] 2020 [ ] Historical district boundaries [ ] From 2003 to 2013, this district was based in Riverside County . The district included the communities of Palm Springs , Moreno Valley , Palm Desert , Hemet , Cathedral City , Temecula , Blythe , Rancho Mirage , Murrieta , Indio , Indian Wells , La Quinta , Cabazon , Anza , Thermal , Idyllwild , Coachella , and other unincorporated areas of Riverside County .
See also [ ]
United States portal California portal
References [ ]
^ US Census ^ "Partisan Voting Index – Districts of the 115th Congress" (PDF) . The Cook Political Report. April 7, 2017. Retrieved April 7, 2017 .^ Hagen, Lisa (February 25, 2018). "California Dems endorse three candidates in pivotal House races" . The Hill . Retrieved February 25, 2018 . ^ Mai-Duc, Christine (July 19, 2017). "Former Obama advisor jumps in to challenge Rep. Mimi Walters in Orange County" . Los Angeles Times . Retrieved July 25, 2017 . ^ Wire, Sarah D. "A third challenger announces bid for Rep. Mimi Walters' Orange County seat" . LA Times . Retrieved June 18, 2017 . ^ Lagos, Marisa. "Democratic Hopefuls Look to Unseat Republicans in 2018" . KQED News . Retrieved June 18, 2017 . ^ Wasserman, Dave [@Redistrict] (November 14, 2018). "Projection: Katie Porter (D) has defeated Rep. Mimi Walters (R) in #CA45" (Tweet) – via Twitter . ^ Statement of Vote (1990 Governor) ^ Statement of Vote (1992 President) ^ Statement of Vote (1992 Senate) ^ Statement of Vote (1992 Senate) ^ Statement of Vote (1994 Governor) ^ Statement of Vote (1994 Senate) ^ Statement of Vote (1996 President) ^ Statement of Vote (1998 Governor) Archived September 29, 2011, at the Wayback Machine ^ Statement of Vote (1998 Senate) Archived September 29, 2011, at the Wayback Machine ^ Statement of Vote (2000 President) ^ Statement of Vote (2000 Senator) ^ Statement of Vote (2002 Governor) ^ Statement of Vote (2003 Recall Question) ^ Statement of Vote (2003 Governor) ^ Statement of Vote (2004 President) ^ Statement of Vote (2004 Senator) ^ Statement of Vote (2006 Governor) ^ Statement of Vote (2006 Senator) ^ Statement of Vote (2008 President) ^ Statement of Vote (2010 Governor) ^ Statement of Vote (2010 Senator) ^ Statement of Vote (2012 President) ^ Statement of Vote (2012 Senator) ^ Statement of Vote (2014 Governor) ^ Statement of Vote (2016 President) ^ Statement of Vote (2016 Senator) ^ Statement of Vote (2018 Governor) ^ Statement of Vote (2018 Senator) ^ Jump up to: a b c d e f [1] ^ "Statement of Votes" (PDF) . OCVote . Orange County Registrar of Voters. Retrieved November 27, 2020 .^ 1982 election results ^ 1984 election results ^ 1986 election results ^ 1988 election results ^ 1990 election results ^ 1992 election results ^ 1994 election results ^ 1996 election results ^ 1998 election results ^ 2000 election results ^ 2002 election results ^ 2004 election results ^ 2006 election results ^ 2008 election results ^ 2010 election results ^ 2012 election results ^ 2014 election results ^ 2016 election results ^ 2018 election results
External links [ ] hide
The at-large seats only existed from 1850 to 1865 and from 1883 to 1885. See also
California's past and present representatives , senators , and delegations
Coordinates : 33°42′51″N 117°40′06″W / 33.71417°N 117.66833°W / 33.71417; -117.66833