California's 36th congressional district
| California's 36th congressional district | |||
|---|---|---|---|
 California's 36th congressional district since January 3, 2013 | |||
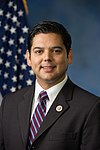
| Representative |
| ||
| Population (2019) | 755,764[1] | ||
| Median household income | $58,728[2] | ||
| Ethnicity |
| ||
| Cook PVI | D+4[3] | ||
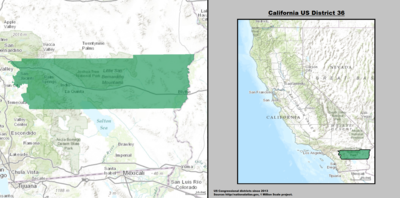
California's 36th congressional district is a U.S. congressional district in California. Based in the eastern part of Riverside County, it covers most of the desert communities of Palm Springs, Palm Desert, Indio, Coachella, Rancho Mirage, Desert Hot Springs, Indian Wells and Cathedral City in the Inland Empire.
The district is represented by Democrat Raul Ruiz, who unseated 45th district Republican incumbent Mary Bono Mack in 2012. Ruiz has represented the district since January 3, 2013.
Competitiveness[]
In statewide races[]
| Year | Office | Results |
|---|---|---|
| 1990 | Governor[4] | Wilson 48.3% - 46.1% |
| 1992 | President[5] | Clinton 41.3% - 35.5% |
| Senator[6] | Herschensohn 47.9% - 44.4% | |
| Senator (Special)[7] | Feinstein 50.3% - 42.3% | |
| 1994 | Governor[8] | Wilson 62.0% - 34.8% |
| Senator[9] | Huffington 48.7% – 44.2% | |
| 1996 | President[10] | Clinton 46.7% - 41.4% |
| 1998 | Governor[11] | Davis 54.4% - 42.4% |
| Senator[12] | Boxer 48.8 - 48% | |
| 2000 | President[13] | Gore 50.7% - 44.3% |
| Senator[14] | Feinstein 53.4% - 39.4% | |
| 2002 | Governor[15] | Davis 49.5% - 39.8% |
| 2003 | Recall[16][17] | |
| Schwarzenegger 48.4% - 32.2% | ||
| 2004 | President[18] | Kerry 59.0% - 39.6% |
| Senator[19] | Boxer 61.9% - 32.8% | |
| 2006 | Governor[20] | Schwarzenegger 52.5% - 42.6% |
| Senator[21] | Feinstein 63.4% - 31.1% | |
| 2008 | President[22] | Obama 64.4% - 33.5% |
| 2010 | Governor[23] | Brown 56.3% - 38.8% |
| Senator[24] | Boxer 56.1% - 38.9% | |
| 2012 | President[25] | Obama 50.7% - 47.5% |
| Senator[26] | Feinstein 53.7% – 46.3% | |
| 2014 | Governor[27] | Brown 52.6% – 47.4% |
| 2016 | President[28] | Clinton 52.2% - 43.3% |
| Senator[29] | Harris 60.0% – 40.0% | |
| 2018 | Governor[30] | Newsom 53.2% – 46.8% |
| Senator[31] | de León 51.7% – 48.3% | |
| 2020 | President[32] | Biden 55.9% - 42.3% |
List of members representing the district[]


Election results[]
|
1962 • 1964 • 1966 • 1968 • 1970 • 1972 • 1974 • 1976 • 1978 • 1980 • 1982 • 1984 • 1986 • 1988 • 1990 • 1992 • 1994 • 1996 • 1998 • 2000 • 2002 • 2004 • 2006 • 2008 • 2010 • 2011 (Special) • 2012 • 2014 • 2016 • 2018 • 2020 |
1962[]
| Party | Candidate | Votes | % | |
|---|---|---|---|---|
| Republican | Bob Wilson (Incumbent) | 91,626 | 61.8 | |
| Democratic | William C. Godfrey | 56,637 | 38.2 | |
| Total votes | 148,263 | 100.0 | ||
| Republican hold | ||||
1964[]
| Party | Candidate | Votes | % | |
|---|---|---|---|---|
| Republican | Bob Wilson (Incumbent) | 105,346 | 59.1 | |
| Democratic | Quintin Whelan | 73,034 | 40.9 | |
| Total votes | 178,380 | 100.0 | ||
| Republican hold | ||||
1966[]
| Party | Candidate | Votes | % | |
|---|---|---|---|---|
| Republican | Bob Wilson (Incumbent) | 119,274 | 72.9 | |
| Democratic | Don Lindgren | 44,365 | 27.1 | |
| Total votes | 163,639 | 100.0 | ||
| Republican hold | ||||
1968[]
| Party | Candidate | Votes | % | |
|---|---|---|---|---|
| Republican | Bob Wilson (Incumbent) | 147,772 | 71.6 | |
| Democratic | Don Lindgren | 58,578 | 28.4 | |
| Total votes | 206,350 | 100.0 | ||
| Republican hold | ||||
1970[]
| Party | Candidate | Votes | % | |
|---|---|---|---|---|
| Republican | Bob Wilson (Incumbent) | 132,446 | 71.5 | |
| Democratic | Daniel K. Hostetter | 44,841 | 24.2 | |
| Peace and Freedom | Walter H. Koppelman | 5,139 | 2.8 | |
| American Independent | Orville J. Davis | 2,723 | 1.5 | |
| Total votes | 185,149 | 100.0 | ||
| Republican hold | ||||
1972[]
| Party | Candidate | Votes | % | |
|---|---|---|---|---|
| Republican | William M. Ketchum | 87,984 | 52.7 | |
| Democratic | Timothy Lemucchi | 72,516 | 43.5 | |
| American Independent | William M. "Bill" Armour | 6,307 | 3.8 | |
| Total votes | 166,807 | 100.0 | ||
| Republican hold | ||||
1974[]
| Party | Candidate | Votes | % | |
|---|---|---|---|---|
| Democratic | George Brown Jr. (Incumbent) | 69,615 | 62.6 | |
| Republican | Jim Osgood | 35,858 | 32.3 | |
| American Independent | William E. Pasley | 5,701 | 5.1 | |
| Total votes | 111,174 | 100.0 | ||
| Democratic hold | ||||
1976[]
| Party | Candidate | Votes | % | |
|---|---|---|---|---|
| Democratic | George Brown Jr. (Incumbent) | 90,830 | 61.5 | |
| Republican | Grant Carner | 49,368 | 33.5 | |
| American Independent | William E. Pasley | 7,358 | 5.0 | |
| Total votes | 147,556 | 100.0 | ||
| Democratic hold | ||||
1978[]
| Party | Candidate | Votes | % | |
|---|---|---|---|---|
| Democratic | George Brown Jr. (Incumbent) | 80,448 | 62.9 | |
| Republican | Dana Warren Carmody | 47,417 | 37.1 | |
| Total votes | 127,865 | 100.0 | ||
| Democratic hold | ||||
1980[]
| Party | Candidate | Votes | % | |
|---|---|---|---|---|
| Democratic | George Brown Jr. (Incumbent) | 88,628 | 52.6 | |
| Republican | John Paul Stark | 73,247 | 43.4 | |
| Libertarian | Harry J. Histen | 6,815 | 4.0 | |
| Total votes | 168,690 | 100.0 | ||
| Democratic hold | ||||
1982[]
| Party | Candidate | Votes | % | |
|---|---|---|---|---|
| Democratic | George Brown Jr. (Incumbent) | 76,546 | 54.3 | |
| Republican | John Paul Stark | 64,361 | 45.7 | |
| Total votes | 140,907 | 100.0 | ||
| Democratic hold | ||||
1984[]
| Party | Candidate | Votes | % | |
|---|---|---|---|---|
| Democratic | George Brown Jr. (Incumbent) | 104,438 | 56.6 | |
| Republican | John Paul Stark | 80,212 | 43.4 | |
| Total votes | 184,650 | 100.0 | ||
| Democratic hold | ||||
1986[]
| Party | Candidate | Votes | % | |
|---|---|---|---|---|
| Democratic | George Brown Jr. (Incumbent) | 78,118 | 57.1 | |
| Republican | Robert L. "Bob" Henley | 58,660 | 42.9 | |
| Total votes | 136,778 | 100.0 | ||
| Democratic hold | ||||
1988[]
| Party | Candidate | Votes | % | |
|---|---|---|---|---|
| Democratic | George Brown Jr. (Incumbent) | 103,493 | 54.0 | |
| Republican | John Paul Stark | 81,413 | 42.4 | |
| Libertarian | Kenneth E. Valentine | 3,382 | 1.8 | |
| American Independent | Fred L. Anderson | 3,360 | 1.8 | |
| Total votes | 191,648 | 100.0 | ||
| Democratic hold | ||||
1990[]
| Party | Candidate | Votes | % | |
|---|---|---|---|---|
| Democratic | George Brown Jr. (Incumbent) | 72,409 | 52.7 | |
| Republican | Bob Hammock | 64,961 | 47.3 | |
| Total votes | 137,370 | 100.0 | ||
| Democratic hold | ||||
1992[]
| Party | Candidate | Votes | % | |
|---|---|---|---|---|
| Democratic | Jane Harman | 125,751 | 48.4 | |
| Republican | Joan Milke Flores | 109,684 | 42.3 | |
| Green | Richard Greene | 13,297 | 5.1 | |
| Peace and Freedom | Owen Stanley | 5,519 | 2.1 | |
| Libertarian | Marc F. Denny | 5,504 | 2.1 | |
| Independent | Larry Martz (write-in) | 2 | 0.0 | |
| Total votes | 259,757 | 100.0 | ||
| Democratic hold | ||||
1994[]
| Party | Candidate | Votes | % | |
|---|---|---|---|---|
| Democratic | Jane Harman (Incumbent) | 93,939 | 48.0 | |
| Republican | Susan Brooks | 93,127 | 47.6 | |
| Libertarian | Jack Tyler | 4,932 | 2.5 | |
| American Independent | Joseph J. "Joe" Fields | 3,810 | 1.9 | |
| Total votes | 195,808 | 100.0 | ||
| Democratic hold | ||||
1996[]
| Party | Candidate | Votes | % | |
|---|---|---|---|---|
| Democratic | Jane Harman (Incumbent) | 117,752 | 52.5 | |
| Republican | Susan Brooks | 98,538 | 44.0 | |
| Libertarian | Bruce Dovner | 4,933 | 2.1 | |
| Natural Law | Bradley McManus | 3,236 | 1.4 | |
| Total votes | 224,459 | 100.0 | ||
| Democratic hold | ||||
1998[]
| Party | Candidate | Votes | % | |||
|---|---|---|---|---|---|---|
| Republican | Steven T. Kuykendall | 88,843 | 48.9 | |||
| Democratic | Janice Hahn | 84,624 | 46.6 | |||
| Green | Robin Barrett | 3,612 | 2.0 | |||
| Libertarian | Kerry Welsh | 3,066 | 1.7 | |||
| Reform | John R. Konopka | 1,561 | 0.8 | |||
| Total votes | 181,706 | 100.0 | ||||
| Republican gain from Democratic | ||||||
2000[]
| Party | Candidate | Votes | % | |||
|---|---|---|---|---|---|---|
| Democratic | Jane Harman | 115,651 | 48.4 | |||
| Republican | Steven T. Kuykendall (Incumbent) | 111,199 | 46.6 | |||
| Libertarian | Daniel R. Sherman | 6,073 | 2.6 | |||
| Reform | John R. Konopka | 3,549 | 1.4 | |||
| Natural Law | Matt Ornati | 2,264 | 0.9 | |||
| Republican | William D. Davies (write-in) | 395 | 0.1 | |||
| Total votes | 239,131 | 100% | ||||
| Democratic gain from Republican | ||||||
2002[]
| Party | Candidate | Votes | % | |
|---|---|---|---|---|
| Democratic | Jane Harman (Incumbent) | 88,198 | 61.4 | |
| Republican | Stuart Johnson | 50,328 | 35.0 | |
| Libertarian | Mark McSpadden | 5,225 | 3.6 | |
| Total votes | 143,751 | 100.0 | ||
| Democratic hold | ||||
2004[]
| Party | Candidate | Votes | % | |
|---|---|---|---|---|
| Democratic | Jane Harman (Incumbent) | 151,208 | 62.0 | |
| Republican | Paul Whitehead | 81,666 | 33.5 | |
| Peace and Freedom | Alice Stek | 6,105 | 2.5 | |
| Libertarian | Mike Binkley | 5,065 | 2.0 | |
| Total votes | 244,144 | 100.0 | ||
| Democratic hold | ||||
2006[]
| Party | Candidate | Votes | % | |
|---|---|---|---|---|
| Democratic | Jane Harman (Incumbent) | 105,323 | 63.4 | |
| Republican | Brian Gibson | 53,068 | 32.0 | |
| Peace and Freedom | James R. Smith | 4,592 | 2.7 | |
| Libertarian | Mike Binkley | 3,170 | 1.9 | |
| Total votes | 166,153 | 100.0 | ||
| Democratic hold | ||||
2008[]
| Party | Candidate | Votes | % | |
|---|---|---|---|---|
| Democratic | Jane Harman (Incumbent) | 171,948 | 68.7 | |
| Republican | Brian Gibson | 78,543 | 31.3 | |
| Total votes | 250,491 | 100.0 | ||
| Democratic hold | ||||
2010[]
| Party | Candidate | Votes | % | |
|---|---|---|---|---|
| Democratic | Jane Harman (Incumbent) | 114,489 | 59.7 | |
| Republican | Mattie Fein | 66,706 | 34.7 | |
| Libertarian | Herb Peters | 10,840 | 5.6 | |
| Total votes | 192,035 | 100.0 | ||
| Democratic hold | ||||
2011 (Special)[]
| Party | Candidate | Votes | % | |
|---|---|---|---|---|
| Democratic | Janice Hahn | 47,000 | 54.9 | |
| Republican | Craig Huey | 38,624 | 45.1 | |
| Total votes | 85,624 | 100.0 | ||
| Turnout | 25.0 | |||
| Democratic hold | ||||
2012[]
| Party | Candidate | Votes | % | |
|---|---|---|---|---|
| Democratic | Raul Ruiz | 110,189 | 52.9 | |
| Republican | Mary Bono Mack (Incumbent) | 97,953 | 47.1 | |
| Total votes | 208,142 | 100.0 | ||
| Democratic gain from Republican | ||||
2014[]
| Party | Candidate | Votes | % | |
|---|---|---|---|---|
| Democratic | Raul Ruiz (Incumbent) | 72,682 | 54.2 | |
| Republican | Brian Nestande | 61,457 | 45.8 | |
| Total votes | 134,139 | 100.0 | ||
| Democratic hold | ||||
2016[]
| Party | Candidate | Votes | % | |
|---|---|---|---|---|
| Democratic | Raul Ruiz (Incumbent) | 144,348 | 62.1 | |
| Republican | Jeff Stone | 88,269 | 37.9 | |
| Total votes | 232,617 | 100.0 | ||
| Democratic hold | ||||
2018[]
| Party | Candidate | Votes | % | |
|---|---|---|---|---|
| Democratic | Raul Ruiz (Incumbent) | 122,169 | 59.0 | |
| Republican | Kimberlin Brown Pelzer | 84,839 | 41.0 | |
| Total votes | 207,008 | 100.0 | ||
| Democratic hold | ||||
2020[]
| Party | Candidate | Votes | % | |
|---|---|---|---|---|
| Democratic | Raul Ruiz (Incumbent) | 185,151 | 60.3 | |
| Republican | Erin Cruz | 121,698 | 39.7 | |
| Total votes | 306,849 | 100.0 | ||
| Democratic hold | ||||
Historical district boundaries[]
From 1993 to 2013, the 36th was located in southwestern Los Angeles County and included Manhattan Beach, Hermosa Beach, Torrance, Redondo Beach, and portions of Los Angeles itself. This district was largely dismantled after the 2010 census, and moved east to Riverside County and includes Palm Springs and La Quinta. The current 36th is largely the successor of the old 45th district.
See also[]
References[]
- ^ US Census
- ^ US Census
- ^ "Introducing the 2021 Cook Political Report Partisan Voter Index". The Cook Political Report. April 15, 2021. Retrieved April 15, 2021.
- ^ Statement of Vote (1990 Governor)
- ^ Statement of Vote (1992 President)
- ^ Statement of Vote (1992 Senate)
- ^ Statement of Vote (1992 Senate)
- ^ Statement of Vote (1994 Governor)
- ^ Statement of Vote (1994 Senate)
- ^ Statement of Vote (1996 President)
- ^ Statement of Vote (1998 Governor) Archived September 29, 2011, at the Wayback Machine
- ^ Statement of Vote (1998 Senate) Archived September 29, 2011, at the Wayback Machine
- ^ Statement of Vote (2000 President)
- ^ Statement of Vote (2000 Senator)
- ^ Statement of Vote (2002 Governor)
- ^ Statement of Vote (2003 Recall Question)
- ^ Statement of Vote (2003 Governor)
- ^ Statement of Vote (2004 President)
- ^ Statement of Vote (2004 Senator)
- ^ Statement of Vote (2006 Governor)
- ^ Statement of Vote (2006 Senator)
- ^ Statement of Vote (2008 President)
- ^ Statement of Vote (2010 Governor)
- ^ Statement of Vote (2010 Senator)
- ^ Statement of Vote (2012 President)
- ^ Statement of Vote (2012 Senator)
- ^ Statement of Vote (2014 Governor)
- ^ Statement of Vote (2016 President)
- ^ Statement of Vote (2016 Senator)
- ^ Statement of Vote (2018 Governor)
- ^ Statement of Vote (2018 Senator)
- ^ https://www.dailykos.com/stories/2012/11/19/1163009/-Daily-Kos-Elections-presidential-results-by-congressional-district-for-the-2012-2008-elections
- ^ 1962 election results
- ^ 1964 election results
- ^ 1966 election results
- ^ 1968 election results
- ^ 1970 election results
- ^ 1972 election results
- ^ 1974 election results
- ^ 1976 election results
- ^ 1978 election results
- ^ 1980 election results
- ^ 1982 election results
- ^ 1984 election results
- ^ 1986 election results
- ^ 1988 election results
- ^ 1990 election results
- ^ 1992 election results
- ^ 1994 election results
- ^ 1996 election results
- ^ 1998 election results
- ^ 2000 election results
- ^ 2002 election results
- ^ 2004 election results
- ^ 2006 election results
- ^ 2008 election results
- ^ 2010 election results
- ^ 2011 special election results
- ^ 2012 election results
- ^ 2014 election results
- ^ 2016 election results
- ^ 2018 election results
- ^ []
External links[]
- GovTrack.us: California's 36th congressional district
- RAND California Election Returns: District Definitions
- California Voter Foundation map - CD36
| Authority control |
|
|---|
Coordinates: 33°43′36″N 115°44′34″W / 33.72667°N 115.74278°W

- Congressional districts of California
- Political districts in Riverside County, California
- Coachella Valley
- Blythe, California
- Cabazon, California
- Calimesa, California
- Cathedral City, California
- Coachella, California
- Desert Hot Springs, California
- Indian Wells, California
- Indio, California
- Joshua Tree National Park
- Murrieta, California
- Palm Desert, California
- Palm Springs, California
- Rancho Mirage, California
- San Bernardino National Forest
- San Jacinto Mountains
- Temecula, California
- Yucaipa, California
- Constituencies established in 1963
- 1963 establishments in California