California's 43rd congressional district
| California's 43rd congressional district | |||
|---|---|---|---|
 California's 43rd congressional district since January 3, 2013 | |||
| Representative |
| ||
| Population (2019) | 748,092 | ||
| Median household income | $66,670[1] | ||
| Ethnicity |
| ||
| Cook PVI | D+29[2] | ||
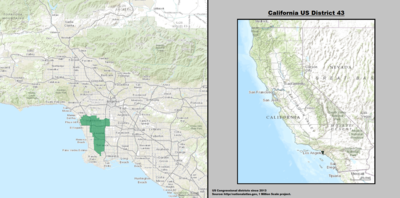
California's 43rd congressional district is a congressional district in the U.S. state of California that is currently represented by Democrat Maxine Waters. The district is centered in the southern part of Los Angeles County, and includes portions of the cities of Los Angeles (including LAX) and Torrance. It includes the entirety of the cities of Hawthorne, Lawndale, Gardena, Inglewood, and Lomita.
From 2003 until 2013, the 43rd district was based in San Bernardino County. The Hispanic-majority district encompassed the southwestern part of the county, and included San Bernardino and Rialto.
The district is being held by Maxine Waters in the House of Representatives.
Competitiveness[]
In statewide races[]
| Election results from statewide races | ||
|---|---|---|
| Year | Office | Results |
| 1990 | Governor[3] | Wilson 64.0% - 30.0% |
| 1992 | President[4] | Bush 38.2% - 37.8% |
| Senator[5] | Herschensohn 52.6% - 37.1% | |
| Senator (Special)[5] | Seymour 46.2% - 43.2% | |
| 1994 | Governor[6] | Wilson 63.4% - 31.4% |
| Senator[7] | Huffington 56.2% – 32.8% | |
| 1996 | President[8] | Dole 45.5% - 43.0% |
| 1998 | Governor[9] | Davis 51.2% - 45.6% |
| Senator[10] | Fong 49.2% – 45.9% | |
| 2000 | President[11] | Bush 52.1% - 44.2% |
| Senator[12] | Feinstein 46.8% - 45.6% | |
| 2002 | Governor[13] | Davis 57.4% - 34.6% |
| 2003 | Recall[14][15] | |
| Schwarzenegger 47.3% - 35.2% | ||
| 2004 | President[16] | Kerry 58.1% - 40.7% |
| Senator[17] | Boxer 64.5% - 30.3% | |
| 2006 | Governor[18] | Angelides 48.7% - 45.4% |
| Senator[19] | Feinstein 64.6% - 29.8% | |
| 2008 | President[20] | Obama 68.0% - 30.1% |
| 2010 | Governor[21] | Brown 61.7% - 30.3% |
| Senator[22] | Boxer 60.1% - 32.2% | |
| 2012 | President[23] | Obama 78.0% - 20.0% |
| U.S. Senator[24] | Feinstein 78.3% - 21.7% | |
| 2014 | Governor[25] | Brown 72.6% – 27.4% |
| 2016 | President[26] | Clinton 78.4% - 16.7% |
| Senator[27] | Harris 66.7% - 33.3% | |
| 2018 | Governor[28] | Newsom 78.0% – 22.0% |
| Senator[29] | Feinstein 62.4% – 37.6% | |
| 2020 | President[30] | Biden 76.9% - 20.9% |
| 2021 | Recall[31] | |
List of members representing the district[]


Election results[]
|
1972 • 1974 • 1976 • 1978 • 1980 • 1982 • 1984 • 1986 • 1988 • 1990 • 1992 • 1994 • 1996 • 1998 • 2000 • 2002 • 2004 • 2006 • 2008 • 2010 • 2012 • 2014• 2016 • 2018 • 2020 |
1972[]
| Party | Candidate | Votes | % | ||
|---|---|---|---|---|---|
| Republican | Victor Veysey (Incumbent) | 117,781 | 62.7 | ||
| Democratic | Ernest Z. Robles | 70,129 | 37.3 | ||
| Total votes | 187,910 | 100.0 | |||
| Republican win (new seat) | |||||
1974[]
| Party | Candidate | Votes | % | |
|---|---|---|---|---|
| Republican | Clair Burgener (Incumbent) | 114,102 | 60.4 | |
| Democratic | Bill Bandes | 74,905 | 39.6 | |
| Total votes | 189,007 | 100.0 | ||
| Republican hold | ||||
1976[]
| Party | Candidate | Votes | % | |
|---|---|---|---|---|
| Republican | Clair Burgener (Incumbent) | 173,576 | 65.0 | |
| Democratic | Pat Kelly | 93,475 | 35.0 | |
| Total votes | 267,051 | 100.0 | ||
| Republican hold | ||||
1978[]
| Party | Candidate | Votes | % | |
|---|---|---|---|---|
| Republican | Clair Burgener (Incumbent) | 167,150 | 68.7 | |
| Democratic | Reuben B. Brooks | 76,308 | 31.3 | |
| Total votes | 243,458 | 100.0 | ||
| Republican hold | ||||
1980[]
| Party | Candidate | Votes | % | |
|---|---|---|---|---|
| Republican | Clair Burgener (Incumbent) | 298,815 | 86.6 | |
| Democratic | Tom Metzger | 46,361 | 13.4 | |
| Total votes | 345,176 | 100.0 | ||
| Republican hold | ||||
1982[]
| Party | Candidate | Votes | % | |
|---|---|---|---|---|
| Republican | Ron Packard (write-in) | 66,444 | 36.8 | |
| Democratic | Roy Pat Archer | 57,995 | 32.1 | |
| Republican | Johnnie R. Crean | 56,297 | 31.1 | |
| Total votes | 180,736 | 100.0 | ||
| Republican hold | ||||
1984[]
| Party | Candidate | Votes | % | |
|---|---|---|---|---|
| Republican | Ron Packard (Incumbent) | 165,643 | 74.1 | |
| Democratic | Lois E. Humphreys | 50,996 | 22.8 | |
| Libertarian | Phyllis Avery | 6,878 | 3.1 | |
| Total votes | 223,517 | 100.0 | ||
| Republican hold | ||||
1986[]
| Party | Candidate | Votes | % | |
|---|---|---|---|---|
| Republican | Ron Packard (Incumbent) | 137,341 | 73.1 | |
| Democratic | Joseph Chirra | 45,078 | 24.0 | |
| Libertarian | Phyllis Avery | 5,370 | 2.9 | |
| Total votes | 187,789 | 100.0 | ||
| Republican hold | ||||
1988[]
| Party | Candidate | Votes | % | |
|---|---|---|---|---|
| Republican | Ron Packard (Incumbent) | 202,478 | 71.7 | |
| Democratic | Howard Greenbaum | 72,499 | 25.6 | |
| Libertarian | Daniel L. Muhe | 7,552 | 2.7 | |
| Total votes | 282,529 | 100.0 | ||
| Republican hold | ||||
1990[]
| Party | Candidate | Votes | % | |
|---|---|---|---|---|
| Republican | Ron Packard (Incumbent) | 151,206 | 68.1 | |
| Peace and Freedom | Doug Hansen | 40,212 | 18.1 | |
| Libertarian | Richard L. "Rick" Arnold | 30,720 | 13.8 | |
| Total votes | 222,138 | 100.0 | ||
| Republican hold | ||||
1992[]
| Party | Candidate | Votes | % | |
|---|---|---|---|---|
| Republican | Ken Calvert | 88,987 | 46.7 | |
| Democratic | Mark A. Takano | 88,468 | 46.4 | |
| American Independent | Gary Odom | 6,095 | 3.2 | |
| Libertarian | Gene L. Berkman | 4,989 | 2.6 | |
| Independent | John Schwab (write-in) | 2,100 | 1.1 | |
| Invalid or blank votes | 13,210 | 6.5 | ||
| Total votes | 203,849 | 100.0 | ||
| Republican hold | ||||
1994[]
| Party | Candidate | Votes | % | |
|---|---|---|---|---|
| Republican | Ken Calvert (Incumbent) | 84,500 | 54.7 | |
| Democratic | Mark A. Takano | 59,342 | 38.4 | |
| Libertarian | Gene L. Berkman | 9,636 | 6.3 | |
| Independent | John Schwab (write-in) | 767 | 0.5 | |
| Independent | Velma Hickey (write-in) | 141 | 0.1 | |
| Invalid or blank votes | 6,421 | 4.0 | ||
| Total votes | 160,807 | 100.0 | ||
| Republican hold | ||||
1996[]
| Party | Candidate | Votes | % | |
|---|---|---|---|---|
| Republican | Ken Calvert (Incumbent) | 97,247 | 54.7 | |
| Democratic | Guy Kimborough | 67,422 | 37.9 | |
| Natural Law | Annie Wallack | 6,576 | 3.7 | |
| Peace and Freedom | Kevin Akin | 3,309 | 1.9 | |
| Libertarian | Gene Berkman | 3,086 | 1.7 | |
| Independent | Colleen Cummings (write-in) | 84 | 0.1 | |
| Invalid or blank votes | 6,571 | 3.6 | ||
| Total votes | 184,295 | 100.0 | ||
| Republican hold | ||||
1998[]
| Party | Candidate | Votes | % | |
|---|---|---|---|---|
| Republican | Ken Calvert (Incumbent) | 83,012 | 55.7 | |
| Democratic | Mike Rayburn | 56,373 | 37.8 | |
| Green | Phill Courtney | 5,508 | 3.7 | |
| Natural Law | Annie Wallack | 4,178 | 2.8 | |
| Invalid or blank votes | 9,064 | 5.7 | ||
| Total votes | 158,135 | 100.0 | ||
| Republican hold | ||||
2000[]
| Party | Candidate | Votes | % | |
|---|---|---|---|---|
| Republican | Ken Calvert (Incumbent) | 140,201 | 73.7 | |
| Libertarian | Bill Reed | 29,755 | 15.6 | |
| Natural Law | Nat Adam | 20,376 | 10.7 | |
| Invalid or blank votes | 0 | 0.0 | ||
| Total votes | 190,332 | 100.0 | ||
| Republican hold | ||||
2002[]
| Party | Candidate | Votes | % | |
|---|---|---|---|---|
| Democratic | Joe Baca (Incumbent) | 45,374 | 66.4 | |
| Republican | Wendy C. Neighbor | 20,821 | 30.5 | |
| Libertarian | Ethel M. Mohler | 2,145 | 3.1 | |
| Invalid or blank votes | 5,273 | 7.2 | ||
| Total votes | 73,613 | 100.0 | ||
| Democratic hold | ||||
2004[]
| Party | Candidate | Votes | % | |
|---|---|---|---|---|
| Democratic | Joe Baca (Incumbent) | 86,830 | 66.4 | |
| Republican | Ed Laning | 44,004 | 33.6 | |
| Independent | Barry J. Patts (write-in) | 0 | 0.0 | |
| Total votes | 130,834 | 100.0 | ||
| Democratic hold | ||||
2006[]
| Party | Candidate | Votes | % | |
|---|---|---|---|---|
| Democratic | Joe Baca (Incumbent) | 52,791 | 64.5 | |
| Republican | Scott Folkens | 29,069 | 35.5 | |
| Total votes | 81,860 | 100.0 | ||
| Democratic hold | ||||
2008[]
| Party | Candidate | Votes | % | |
|---|---|---|---|---|
| Democratic | Joe Baca (Incumbent) | 108,259 | 69.1 | |
| Republican | John Roberts | 48,312 | 30.9 | |
| Total votes | 156,571 | 100.0 | ||
| Turnout | 63.4 | |||
| Democratic hold | ||||
2010[]
| Party | Candidate | Votes | % | |
|---|---|---|---|---|
| Democratic | Joe Baca (Incumbent) | 70,026 | 65.5 | |
| Republican | Scott Folkens | 36,890 | 34.5 | |
| Total votes | 106,916 | 100.0 | ||
| Democratic hold | ||||
2012[]
| Party | Candidate | Votes | % | |
|---|---|---|---|---|
| Democratic | Maxine Waters (Incumbent) | 143,123 | 71.2 | |
| Democratic | Bob Flores | 57,771 | 28.8 | |
| Total votes | 200,894 | 100.0 | ||
| Democratic hold | ||||
2014[]
| Party | Candidate | Votes | % | |
|---|---|---|---|---|
| Democratic | Maxine Waters (Incumbent) | 69,681 | 71.0 | |
| Republican | John Wood, Jr. | 28,521 | 29.0 | |
| Total votes | 98,202 | 100.0 | ||
| Democratic hold | ||||
2016[]
| Party | Candidate | Votes | % | |
|---|---|---|---|---|
| Democratic | Maxine Waters (Incumbent) | 167,017 | 76.1 | |
| Republican | Omar Navarro | 52,499 | 23.9 | |
| Total votes | 219,516 | 100.0 | ||
| Democratic hold | ||||
2018[]
| Party | Candidate | Votes | % | |
|---|---|---|---|---|
| Democratic | Maxine Waters (Incumbent) | 152,272 | 77.7 | |
| Republican | Omar Navarro | 43,780 | 22.3 | |
| Total votes | 196,052 | 100.0 | ||
| Democratic hold | ||||
2020[]
| Party | Candidate | Votes | % | |
|---|---|---|---|---|
| Democratic | Maxine Waters (incumbent) | 199,210 | 71.7 | |
| Republican | Joe E. Collins III | 78,688 | 28.3 | |
| Total votes | 277,898 | 100.0 | ||
| Democratic hold | ||||
Historical district boundaries[]
From 2003 through 2013, the district consisted of many of San Bernardino's central suburbs, including San Bernardino, Ontario and Fontana. Due to redistricting after the 2010 United States Census, the district has moved south west into South Los Angeles and now includes Hawthorne and Inglewood.

See also[]
References[]
- ^ Center for New Media & Promotion (CNMP), US Census Bureau. "My Congressional District". www.census.gov.
- ^ "Partisan Voting Index – Districts of the 115th Congress" (PDF). The Cook Political Report. April 7, 2017. Retrieved April 7, 2017.
- ^ Statement of Vote (1990 Governor)
- ^ Statement of Vote (1992 President)
- ^ a b Statement of Vote (1992 Senate)
- ^ Statement of Vote (1994 Governor)
- ^ Statement of Vote (1994 Senate)
- ^ Statement of Vote (1996 President)
- ^ "Statement of Vote (1998 Governor)" (PDF). Archived from the original (PDF) on September 29, 2011.
- ^ "Statement of Vote (1998 Senate)" (PDF). Archived from the original (PDF) on September 29, 2011.
- ^ Statement of Vote (2000 President)
- ^ Statement of Vote (2000 Senator)
- ^ Statement of Vote (2002 Governor)
- ^ Statement of Vote (2003 Recall Question)
- ^ Statement of Vote (2003 Governor)
- ^ Statement of Vote (2004 President)
- ^ Statement of Vote (2004 Senator)
- ^ Statement of Vote (2006 Governor)
- ^ Statement of Vote (2006 Senator)
- ^ Statement of Vote (2008 President)
- ^ Statement of Vote (2010 Governor)
- ^ Statement of Vote (2010 Senator)
- ^ Statement of Vote (2012 President)
- ^ Statement of Vote (2012 Senator)
- ^ Statement of Vote (2014 Governor)
- ^ Statement of Vote (2016 President)
- ^ Statement of Vote (2016 Senate)
- ^ Statement of Vote (2018 Governor)
- ^ Statement of Vote (2018 Senator)
- ^ "Daily Kos Elections' presidential results by congressional district for 2020, 2016, and 2012".
- ^ https://www.ourcampaigns.com/RaceDetail.html?RaceID=942549
- ^ "1972 election results" (PDF).
- ^ "1974 election results" (PDF).
- ^ "1976 election results" (PDF).
- ^ "1978 election results" (PDF).
- ^ "1980 election results" (PDF).
- ^ "1982 election results" (PDF).
- ^ "1984 election results" (PDF).
- ^ "1986 election results" (PDF).
- ^ "1988 election results" (PDF).
- ^ "1990 election results" (PDF).
- ^ "1992 election results" (PDF).
- ^ "1994 election results" (PDF).
- ^ "1996 election results" (PDF).
- ^ "1998 election results" (PDF).
- ^ "2000 election results" (PDF).
- ^ 2002 election results
- ^ 2004 election results
- ^ 2006 election results
- ^ 2008 election results
- ^ 2010 election results
- ^ 2012 election results
- ^ 2014 election results
- ^ 2016 election results
- ^ 2018 election results
External links[]
- The new District 43— California's GovTrack.us: Map of current 43rd congressional district (Westside, Los Angeles County)
- California Voter Foundation map of former 43rd congressional district (San Bernardino County) — (pre-2013).
- RAND.org: California Election Returns for pre-2013 43rd congressional district (San Bernardino County)
Coordinates: 33°54′11″N 118°20′11″W / 33.90306°N 118.33639°W

- Congressional districts of California
- Government of Los Angeles County, California
- Government of Los Angeles
- Westside (Los Angeles County)
- Gardena, California
- Hawthorne, California
- Inglewood, California
- Lawndale, California
- Lomita, California
- Playa del Rey, Los Angeles
- Playa Vista, Los Angeles
- Torrance, California
- Westchester, Los Angeles
- Constituencies established in 1973
- 1973 establishments in California