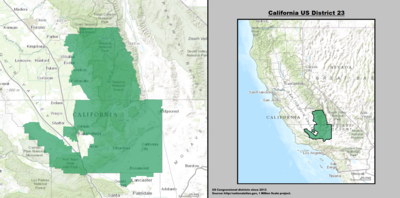
California's 23rd congressional district
| California's 23rd congressional district | |||
|---|---|---|---|
 California's 23rd congressional district since January 3, 2013 | |||
| Representative |
| ||
| Population (2019) | 741,557[1] | ||
| Median household income | $63,550[1] | ||
| Ethnicity |
| ||
| Cook PVI | R+12[2] | ||
California's 23rd congressional district is a congressional district in the U.S. state of California. The district is represented in the 117th United States Congress by Republican Kevin McCarthy. Since January 2019, McCarthy has been House minority leader.
The current district includes parts of the southern San Joaquin Valley, the Tehachapi Mountains and southern Sierra Nevada, and the northwestern Mojave Desert. It comprises most of Kern County and portions of Los Angeles and Tulare counties. Cities in the district include Porterville, Ridgecrest, most of Bakersfield, and part of Lancaster.[3] With a Cook Partisan Voting Index rating of R+12, it is the most Republican district in California and the second-most Republican district in a West Coast state, behind only Washington's 4th district.[2]
Former characteristics[]
From 2003 to 2013 the district ran along the Pacific coasts of Ventura, Santa Barbara, and San Luis Obispo counties. Major cities in the district included Santa Barbara, San Luis Obispo, Ventura, and Oxnard.[4] Before redistricting by the California Citizens Redistricting Commission in 2011, California's 23rd congressional district was one of the narrowest districts in the United States, stretching along the Pacific coast from Oxnard to the Monterey County line. It was often referred to as "the district that disappears at high tide"[5] or the "ribbon of shame".[6] This area is now divided between the 24th and 26th districts, while the current 23rd covers much of the territory that was previously in the 22nd district.
Election results from statewide races[]
| Year | Office | Results |
|---|---|---|
| 1992 | President | Clinton 38.4–34.5% |
| Senator | Herschensohn 49.4–40.6% | |
| Senator | Feinstein 46.2–45.3% | |
| 1994 | Governor | [data unknown/missing] |
| Senator | [data unknown/missing] | |
| 1996 | President | [data unknown/missing] |
| 1998 | Governor | [data unknown/missing] |
| Senator | [data unknown/missing] | |
| 2000 | President[7] | Gore 48.2–46.9% |
| Senator[8] | Feinstein 51.2–41.5% | |
| 2002 | Governor[9] | Davis 48.0–40.7% |
| 2003 | Recall[10][11] | |
| Schwarzenegger 42.4–35.2% | ||
| 2004 | President[12] | Kerry 58.3–40.3% |
| Senator[13] | Boxer 60.2–34.8% | |
| 2006 | Governor[14] | Schwarzenegger 53.6–41.1% |
| Senator[15] | Feinstein 62.3–33.1% | |
| 2008 | President[16] | Obama 65.3–32.3% |
| 2010 | Governor | Brown 55.9–38.5% |
| Senator | Boxer 55.9–38.4% | |
| 2012 | President | Romney 61.5–36.1% |
| Senator | Emken 62.0–38.0% | |
| 2014 | Governor | Kashkari 64.5–35.5% |
| 2016 | President | Trump 58.1–36.1% |
| Senator | Harris 54.3–45.7% | |
| 2018 | Governor | Cox 62.6–37.4% |
| Senator | de Leon 60.3–39.7% | |
| 2020 | President | Trump 57.1–41.5% |
List of members representing the district[]
| Representative | Party | Years | Cong ress(es) |
Electoral history | District location |
|---|---|---|---|---|---|
| District created on January 3, 1943 | |||||
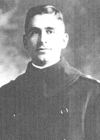 Edouard Izac |
Democratic | January 3, 1943 – January 3, 1947 |
78th 79th |
Redistricted from the 20th district and re-elected in 1942. Re-elected in 1944. Lost re-election. |
1943–1953 San Diego |
 Charles K. Fletcher |
Republican | January 3, 1947 – January 3, 1949 |
80th | Elected in 1946. Lost re-election. | |
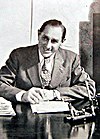
 Clinton D. McKinnon |
Democratic | January 3, 1949 – January 3, 1953 |
81st 82nd |
Elected in 1948. Re-elected in 1950. Retired to run for U.S. senator. | |
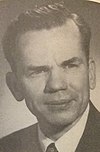
 Clyde Doyle |
Democratic | January 3, 1953 – March 14, 1963 |
83rd 84th 85th 86th 87th 88th |
Redistricted from the 18th district and re-elected in 1952. Re-elected in 1954. Re-elected in 1956. Re-elected in 1958. Re-elected in 1960. Re-elected in 1962. Died. |
1953–1973 Los Angeles |
| Vacant | March 14, 1963 – June 11, 1963 |
88th | |||
 Del M. Clawson |
Republican | June 11, 1963 – January 3, 1975 |
88th 89th 90th 91st 92nd 93rd |
Elected to finish Doyle's term. Re-elected in 1964. Re-elected in 1966. Re-elected in 1968. Re-elected in 1970. Re-elected in 1972. Redistricted to the 33rd district. | |
| 1973–1975 Los Angeles, Orange | |||||
 Thomas M. Rees |
Democratic | January 3, 1975 – January 3, 1977 |
94th | Redistricted from the 26th district and re-elected in 1974. Retired. |
1975–1983 Los Angeles |
 Anthony Beilenson |
Democratic | January 3, 1977 – January 3, 1993 |
95th 96th 97th 98th 99th 100th 101st 102nd |
Elected in 1976. Re-elected in 1978. Re-elected in 1980. Re-elected in 1982. Re-elected in 1984. Re-elected in 1986. Re-elected in 1988. Re-elected in 1990. Redistricted to the 24th district. | |
| 1983–1993 Los Angeles (northern L.A. suburbs) | |||||
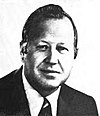
 Elton Gallegly |
Republican | January 3, 1993 – January 3, 2003 |
103rd 104th 105th 106th 107th |
Redistricted from the 21st district and re-elected in 1992. Re-elected in 1994. Re-elected in 1996. Re-elected in 1998. Re-elected in 2000. Redistricted to the 24th district. |
1993–2003 Santa Barbara (Carpinteria), Ventura |
 Lois Capps |
Democratic | January 3, 2003 – January 3, 2013 |
108th 109th 110th 111th 112th |
Redistricted from the 22nd district and re-elected in 2002. Re-elected in 2004. Re-elected in 2006. Re-elected in 2008. Re-elected in 2010. Redistricted to the 24th district. |
2003–2013 Coastal San Luis Obispo, Santa Barbara, Ventura |
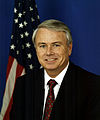
 Kevin McCarthy |
Republican | January 3, 2013 – present |
113th 114th 115th 116th 117th |
Redistricted from the 22nd district and re-elected in 2012. Re-elected in 2014. Re-elected in 2016. Re-elected in 2018. Re-elected in 2020. Redistricted to the 20th district. |
2013–present Southern Central Valley including parts of Bakersfield |
Election results[]
1942[]
| Party | Candidate | Votes | % | |
|---|---|---|---|---|
| Democratic | Edouard Izac (Incumbent) | 42,864 | 50.5% | |
| Republican | James B. Abbey | 42,087 | 49.5% | |
| Total votes | 84,951 | 100.0% | ||
| Turnout | ||||
| Democratic hold | ||||
1944[]
| Party | Candidate | Votes | % | |
|---|---|---|---|---|
| Democratic | Edouard Izac (Incumbent) | 86,707 | 55.1% | |
| Republican | James B. Abbey | 70,787 | 44.9% | |
| Total votes | 157,494 | 100.0% | ||
| Turnout | ||||
| Democratic hold | ||||
1946[]
| Party | Candidate | Votes | % | |||
|---|---|---|---|---|---|---|
| Republican | Charles K. Fletcher | 69,411 | 56.3% | |||
| Democratic | Edouard Izac (Incumbent) | 53,898 | 43.7% | |||
| Total votes | 123,309 | 100.0% | ||||
| Turnout | ||||||
| Republican gain from Democratic | ||||||
1948[]
| Party | Candidate | Votes | % | |||
|---|---|---|---|---|---|---|
| Democratic | Clinton D. McKinnon | 112,534 | 55.8% | |||
| Republican | Charles K. Fletcher (Incumbent) | 87,138 | 43.2% | |||
| Progressive | Harry C. Steinmetz | 2,017 | 1.0% | |||
| Total votes | 201,689 | 100.0% | ||||
| Turnout | ||||||
| Democratic gain from Republican | ||||||
1950[]
| Party | Candidate | Votes | % | |
|---|---|---|---|---|
| Democratic | Clinton D. McKinnon (Incumbent) | 94,137 | 51% | |
| Republican | Leslie E. Gehres | 90,398 | 49% | |
| Total votes | 184,535 | 100.0% | ||
| Turnout | ||||
| Democratic hold | ||||
1952[]
| Party | Candidate | Votes | % | |
|---|---|---|---|---|
| Democratic | Clyde Doyle (Incumbent) | 138,356 | 87.5% | |
| Progressive | Olive T. Thompson | 17,501 | 11.1% | |
| Republican | C. Cleveland (write-in) | 2,329 | 1.4% | |
| Total votes | 158,186 | 100.0% | ||
| Turnout | ||||
| Democratic hold | ||||
1954[]
| Party | Candidate | Votes | % | |
|---|---|---|---|---|
| Democratic | Clyde Doyle (Incumbent) | 90,729 | 70.9% | |
| Republican | Frank G. Bussing | 34,911 | 27.3% | |
| Progressive | Olive T. Thompson | 2,293 | 1.8% | |
| Total votes | 127,933 | 100.0% | ||
| Turnout | ||||
| Democratic hold | ||||
1956[]
| Party | Candidate | Votes | % | |
|---|---|---|---|---|
| Democratic | Clyde Doyle (Incumbent) | 120,109 | 70.9% | |
| Republican | E. Elgie "Cal" Calvin | 49,198 | 29.1% | |
| Total votes | 169,207 | 100.0% | ||
| Turnout | ||||
| Democratic hold | ||||
1958[]
| Party | Candidate | Votes | % | |
|---|---|---|---|---|
| Democratic | Clyde Doyle (Incumbent) | 140,817 | 100.0% | |
| Turnout | ||||
| Democratic hold | ||||
1960[]
| Party | Candidate | Votes | % | |
|---|---|---|---|---|
| Democratic | Clyde Doyle (Incumbent) | 148,415 | 74.2% | |
| Republican | Emmett A. Schwartz | 51,548 | 25.8% | |
| Total votes | 199,963 | 100.0% | ||
| Turnout | ||||
| Democratic hold | ||||
1962[]
| Party | Candidate | Votes | % | |
|---|---|---|---|---|
| Democratic | Clyde Doyle (Incumbent) | 83,269 | 64.2% | |
| Republican | Emmett A. Schwartz | 46,488 | 35.8% | |
| Total votes | 129,757 | 100.0% | ||
| Turnout | ||||
| Democratic hold | ||||
1963 (Special)[]
| Party | Candidate | Votes | % | |||
|---|---|---|---|---|---|---|
| Republican | Del M. Clawson | 53.2% | ||||
| Democratic | Carley V. Porter | 35.4% | ||||
| Democratic | Maurice H. Quigley | 4.7% | ||||
| Democratic | Armand R. Porter | 2.7% | ||||
| Democratic | James Earle Christo | 1.4% | ||||
| Democratic | Lynn W. Johnston | 1.4% | ||||
| Republican | Harold R. "Hal" Bennett | 0.6% | ||||
| Republican | Harry L. Butler | 0.6% | ||||
| Total votes | 100.0% | |||||
| Turnout | ||||||
| Republican gain from Democratic | ||||||
1964[]
| Party | Candidate | Votes | % | |
|---|---|---|---|---|
| Republican | Del M. Clawson (Incumbent) | 90,721 | 55.4% | |
| Democratic | H. O. Van Pettin | 72,903 | 44.6% | |
| Total votes | 163,624 | 100.0% | ||
| Turnout | ||||
| Republican hold | ||||
1966[]
| Party | Candidate | Votes | % | |
|---|---|---|---|---|
| Republican | Del M. Clawson (Incumbent) | 93,320 | 67.4% | |
| Democratic | Ed O'Connor | 45,141 | 32.6% | |
| Total votes | 138,461 | 100.0% | ||
| Turnout | ||||
| Republican hold | ||||
1968[]
| Party | Candidate | Votes | % | |
|---|---|---|---|---|
| Republican | Del M. Clawson (Incumbent) | 95,628 | 64.9% | |
| Democratic | Jim Sperrazzo | 51,606 | 35.1% | |
| Total votes | 147,234 | 100.0% | ||
| Turnout | ||||
| Republican hold | ||||
1970[]
| Party | Candidate | Votes | % | |
|---|---|---|---|---|
| Republican | Del M. Clawson (Incumbent) | 77,346 | 63.3% | |
| Democratic | G. L. "Jerry" Chapman | 44,767 | 36.7% | |
| Total votes | 122,113 | 100.0% | ||
| Turnout | ||||
| Republican hold | ||||
1972[]
| Party | Candidate | Votes | % | |
|---|---|---|---|---|
| Republican | Del M. Clawson (Incumbent) | 118,731 | 61.4% | |
| Democratic | Conrad G. Tuohey | 74,561 | 38.6% | |
| Total votes | 193,292 | 100.0% | ||
| Turnout | ||||
| Republican hold | ||||
1974[]
| Party | Candidate | Votes | % | |
|---|---|---|---|---|
| Democratic | Thomas M. Rees | 119,239 | 71.4% | |
| Republican | Jack E. Roberts | 47,615 | 28.6% | |
| Total votes | 166,854 | 100.0% | ||
| Turnout | ||||
| Democratic hold | ||||
1976[]
| Party | Candidate | Votes | % | |
|---|---|---|---|---|
| Democratic | Anthony C. Beilenson | 130,619 | 60.2% | |
| Republican | Thomas F. Bartman | 86,434 | 39.8% | |
| Total votes | 217,053 | 100.0% | ||
| Turnout | ||||
| Democratic hold | ||||
1978[]
| Party | Candidate | Votes | % | |
|---|---|---|---|---|
| Democratic | Anthony C. Beilenson (Incumbent) | 117,498 | 65.6% | |
| Republican | Joseph Barbara | 61,496 | 34.4% | |
| Total votes | 178,994 | 100.0% | ||
| Turnout | ||||
| Democratic hold | ||||
1980[]
| Party | Candidate | Votes | % | |
|---|---|---|---|---|
| Democratic | Anthony C. Beilenson (Incumbent) | 126,020 | 63.2% | |
| Republican | Robert "Bob" Winckler | 62,742 | 31.5% | |
| Libertarian | Jeffrey P. Lieb | 10,623 | 5.3% | |
| Total votes | 199,385 | 100.0% | ||
| Turnout | ||||
| Democratic hold | ||||
1982[]
| Party | Candidate | Votes | % | |
|---|---|---|---|---|
| Democratic | Anthony C. Beilenson (Incumbent) | 120,788 | 59.6% | |
| Republican | David Armor | 82,031 | 40.4% | |
| Total votes | 202,819 | 100.0% | ||
| Turnout | ||||
| Democratic hold | ||||
1984[]
| Party | Candidate | Votes | % | |
|---|---|---|---|---|
| Democratic | Anthony C. Beilenson (Incumbent) | 140,461 | 61.6% | |
| Republican | Claude W. Parrish | 84,093 | 36.9% | |
| Libertarian | Larry Leathers | 3,580 | 1.6% | |
| Total votes | 228,134 | 100.0% | ||
| Turnout | ||||
| Democratic hold | ||||
1986[]
| Party | Candidate | Votes | % | |
|---|---|---|---|---|
| Democratic | Anthony C. Beilenson (Incumbent) | 121,468 | 65.7% | |
| Republican | George Woolverton | 58,746 | 31.8% | |
| Peace and Freedom | Tom Hopke | 2,521 | 1.4% | |
| Libertarian | Taylor Rhodes | 2,019 | 1.1% | |
| Total votes | 184,754 | 100.0% | ||
| Turnout | ||||
| Democratic hold | ||||
1988[]
| Party | Candidate | Votes | % | |
|---|---|---|---|---|
| Democratic | Anthony C. Beilenson (Incumbent) | 147,858 | 63.5% | |
| Republican | Jim Salomon | 77,184 | 33.1% | |
| Libertarian | John R. Vernon | 4,503 | 1.9% | |
| Peace and Freedom | John Honigsfeld | 3,316 | 1.4% | |
| No party | Write-ins | 18 | 0.0% | |
| Total votes | 232,879 | 100.0% | ||
| Turnout | ||||
| Democratic hold | ||||
1990[]
| Party | Candidate | Votes | % | |
|---|---|---|---|---|
| Democratic | Anthony C. Beilenson (Incumbent) | 103,141 | 61.7% | |
| Republican | Jim Salomon | 57,118 | 34.2% | |
| Peace and Freedom | John Honigsfeld | 6,834 | 4.1% | |
| Total votes | 167,093 | 100.0% | ||
| Turnout | ||||
| Democratic hold | ||||
1992[]
| Party | Candidate | Votes | % | |
|---|---|---|---|---|
| Republican | Elton Gallegly (Redistricted incumbent) | 115,504 | 54.3% | |
| Democratic | Anita Perez Ferguson | 88,225 | 41.4% | |
| Libertarian | Jay C. Wood | 9,091 | 4.3% | |
| No party | Dunbar (write-in) | 61 | 0.0% | |
| Total votes | 212,881 | 100.0% | ||
| Turnout | ||||
| Republican hold | ||||
1994[]
| Party | Candidate | Votes | % | |
|---|---|---|---|---|
| Republican | Elton Gallegly (Incumbent) | 114,043 | 66.17% | |
| Democratic | Kevin Ready | 47,345 | 27.47% | |
| Libertarian | Bill Brown | 6,481 | 3.76% | |
| Green | Robert T. Marston | 4,457 | 2.59% | |
| No party | Nagode (write-in) | 14 | 0.01% | |
| Total votes | 172,340 | 100.0% | ||
| Turnout | ||||
| Republican hold | ||||
1996[]
| Party | Candidate | Votes | % | |
|---|---|---|---|---|
| Republican | Elton Gallegly (Incumbent) | 118,880 | 59.6% | |
| Democratic | Robert Unruhe | 70,035 | 35.2% | |
| Libertarian | Gail Lightfoot | 8,346 | 4.1% | |
| Natural Law | Stephen Hospodar | 2,246 | 1.1% | |
| Total votes | 199,507 | 100.0% | ||
| Turnout | ||||
| Republican hold | ||||
1998[]
| Party | Candidate | Votes | % | |
|---|---|---|---|---|
| Republican | Elton Gallegly (Incumbent) | 96,362 | 60.06% | |
| Democratic | Daniel "Dan" Gonzalez | 64,068 | 39.94% | |
| Total votes | 160,430 | 100.0% | ||
| Turnout | ||||
| Republican hold | ||||
2000[]
| Party | Candidate | Votes | % | |
|---|---|---|---|---|
| Republican | Elton Gallegly (Incumbent) | 119,479 | 54.1% | |
| Democratic | Michael Case | 89,918 | 40.7% | |
| Reform | Cary Savitch | 6,473 | 3.0% | |
| Libertarian | Roger Peebles | 3,708 | 1.6% | |
| Natural Law | Stephen P. Hospodar | 1,456 | 0.6% | |
| Total votes | 221,034 | 100.0% | ||
| Turnout | ||||
| Republican hold | ||||
2002[]
| Party | Candidate | Votes | % | |
|---|---|---|---|---|
| Democratic | Lois Capps (Redistricted incumbent) | 95,752 | 59.1% | |
| Republican | Beth Rogers | 62,604 | 38.6% | |
| Libertarian | James E. Hill | 3,866 | 2.3% | |
| Total votes | 162,222 | 100.0% | ||
| Turnout | ||||
| Democratic hold | ||||
2004[]
| Party | Candidate | Votes | % | |
|---|---|---|---|---|
| Democratic | Lois Capps (Incumbent) | 153,980 | 63.1% | |
| Republican | Don Regan | 83,926 | 34.3% | |
| Libertarian | Michael Favorite | 6,391 | 2.6% | |
| Total votes | 244,297 | 100.0% | ||
| Turnout | ||||
| Democratic hold | ||||
2006[]
| Party | Candidate | Votes | % | |
|---|---|---|---|---|
| Democratic | Lois Capps (Incumbent) | 114,661 | 65.2% | |
| Republican | Victor G. Tognazzini | 61,272 | 34.8% | |
| No party | H.A. Gardner Jr. (write-in) | 18 | 0.0% | |
| Total votes | 175,951 | 100.0% | ||
| Turnout | ||||
| Democratic hold | ||||
2008[]
| Party | Candidate | Votes | % | |
|---|---|---|---|---|
| Democratic | Lois Capps (Incumbent) | 171,403 | 68.07% | |
| Republican | Matt Kokkonen | 80,385 | 31.93% | |
| Total votes | 251,788 | 100.00% | ||
| Turnout | 77.41% | |||
| Democratic hold | ||||
2010[]
| Party | Candidate | Votes | % | |
|---|---|---|---|---|
| Democratic | Lois Capps (Incumbent) | 111,768 | 57.8% | |
| Republican | Tom Watson | 72,744 | 37.6% | |
| Libertarian | Darrell M. Stafford | 3,326 | 1.7% | |
| No party | John V. Hager | 5,625 | 2.9% | |
| Total votes | 193,463 | 100.0% | ||
| Turnout | ||||
| Democratic hold | ||||
2012[]
| Party | Candidate | Votes | % | |
|---|---|---|---|---|
| Republican | Kevin McCarthy (Redistricted incumbent) | 158,161 | 73.2% | |
| No party preference | Terry Phillips | 57,842 | 26.8% | |
| Total votes | 216,003 | 100.0% | ||
| Republican hold | ||||
2014[]
| Primary election | ||||
|---|---|---|---|---|
| Party | Candidate | Votes | % | |
| Republican | Kevin McCarthy (Incumbent) | 58,334 | 99.1% | |
| Democratic | Raul Garcia (write-in) | 313 | 0.5% | |
| Republican | Mike Biglay (write-in) | 157 | 0.3% | |
| No party preference | Ronald L. Porter (write-in) | 36 | 0.1% | |
| Libertarian | Gail K. Lightfoot (write-in) | 31 | 0.1% | |
| Green | Noah Calugaru (write-in) | 3 | 0.01% | |
| Total votes | 58,871 | 100.0% | ||
| General election | ||||
| Republican | Kevin McCarthy (Incumbent) | 100,317 | 74.8% | |
| Democratic | Raul Garcia | 33,726 | 25.2% | |
| Total votes | 134,043 | 100.0% | ||
| Republican hold | ||||
2016[]
| Party | Candidate | Votes | % | |
|---|---|---|---|---|
| Republican | Kevin McCarthy (Incumbent) | 167,116 | 69.2% | |
| Democratic | Wendy Reed | 74,468 | 30.8% | |
| Total votes | 241,584 | 100.0% | ||
| Republican hold | ||||
2018[]
| Party | Candidate | Votes | % | |
|---|---|---|---|---|
| Republican | Kevin McCarthy (Incumbent) | 131,113 | 63.7% | |
| Democratic | Tatiana Matta | 74,661 | 36.3% | |
| Total votes | 205,774 | 100.0% | ||
| Republican hold | ||||
2020[]
| Primary election | ||||
|---|---|---|---|---|
| Party | Candidate | Votes | % | |
| Republican | Kevin McCarthy (incumbent) | 107,897 | 66.5 | |
| Democratic | Kim Mangone | 54,375 | 33.5 | |
| Total votes | 162,272 | 100.0 | ||
| General election | ||||
| Republican | Kevin McCarthy (incumbent) | 190,222 | 62.1 | |
| Democratic | Kim Mangone | 115,896 | 37.9 | |
| Total votes | 306,118 | 100.0 | ||
| Republican hold | ||||
See also[]
References[]
- ^ a b Center for New Media & Promotion (CNMP), US Census Bureau. "My Congressional District". www.census.gov.
- ^ a b "Partisan Voting Index – Districts of the 115th Congress" (PDF). The Cook Political Report. April 7, 2017. Retrieved April 7, 2017.
- ^ "California's citizen commission final district maps: Find out what's changed where you live". Los Angeles Times. August 2, 2011.
- ^ https://statewidedatabase.org/pub/data/MAPS/district/2001/cd23.pdf
- ^ Patrick McGreevy (December 19, 2010). "New redistricting panel takes aim at bizarre political boundaries". Los Angeles Times. Retrieved December 19, 2010.
- ^ Aaron Blake (July 27, 2011). "Name that district! (Gerrymandering edition)". Washington Post. Retrieved July 28, 2011.
- ^ "Statement of Vote (2000 President)" (PDF). Archived from the original (PDF) on June 11, 2007. Retrieved September 17, 2008.
- ^ "Statement of Vote (2000 Senator)" (PDF). Archived from the original (PDF) on June 11, 2007. Retrieved September 17, 2008.
- ^ "Statement of Vote (2002 Governor)" (PDF). Archived from the original (PDF) on November 11, 2010.
- ^ "Statement of Vote (2003 Recall Question)" (PDF). Archived from the original (PDF) on May 20, 2011. Retrieved October 8, 2007.
- ^ "Statement of Vote (2003 Governor)" (PDF). Archived from the original (PDF) on May 20, 2011. Retrieved October 8, 2007.
- ^ "Statement of Vote (2004 President)" (PDF). Archived from the original (PDF) on August 1, 2010. Retrieved August 8, 2007.
- ^ "Statement of Vote (2004 Senator)" (PDF). Archived from the original (PDF) on August 10, 2011.
- ^ "Statement of Vote (2006 Governor)" (PDF). Archived from the original (PDF) on August 10, 2011.
- ^ "Statement of Vote (2006 Senator)" (PDF). Archived from the original (PDF) on August 10, 2011.
- ^ "(2008 President)". Archived from the original on February 11, 2009. Retrieved March 5, 2009.
- ^ "1942 election results" (PDF).
- ^ "1944 election results" (PDF).
- ^ "1946 election results" (PDF).
- ^ "1948 election results" (PDF).
- ^ "1950 election results" (PDF).
- ^ "1952 election results" (PDF).
- ^ "1954 election results" (PDF).
- ^ "1956 election results" (PDF).
- ^ "1958 election results" (PDF).
- ^ "1960 election results" (PDF).
- ^ "1962 election results" (PDF).
- ^ "JoinCalifornia - 06-11-1963 Election". www.joincalifornia.com.
- ^ "1964 election results" (PDF).
- ^ "1966 election results" (PDF).
- ^ "1968 election results" (PDF).
- ^ "1970 election results" (PDF).
- ^ "1972 election results" (PDF).
- ^ "1974 election results" (PDF).
- ^ "1976 election results" (PDF).
- ^ "1978 election results" (PDF).
- ^ "1980 election results" (PDF).
- ^ "1982 election results" (PDF).
- ^ "1984 election results" (PDF).
- ^ "1986 election results" (PDF).
- ^ "1988 election results" (PDF).
- ^ "1990 election results" (PDF).
- ^ "1992 election results" (PDF).
- ^ "1994 election results" (PDF).
- ^ "1996 election results" (PDF).
- ^ "1998 election results" (PDF).
- ^ "2000 election results" (PDF).
- ^ "2002 general election results" (PDF). Archived from the original (PDF) on February 3, 2009.
- ^ "2004 general election results" (PDF). Archived from the original (PDF) on August 21, 2008.
- ^ "2006 general election results" (PDF). Archived from the original (PDF) on November 27, 2008.
- ^ "2010 general election results". Archived from the original on November 17, 2010. Retrieved December 9, 2010.
- ^ a b "2012 general election results" (PDF). Archived from the original (PDF) on October 19, 2013.
- ^ 2018 general election results
External links[]

- Congressional districts of California
- Government of Kern County, California
- Government of Los Angeles County, California
- Government of Tulare County, California
- Government of Bakersfield, California
- Mojave Desert
- San Joaquin Valley
- Tehachapi Mountains
- Sierra Nevada (United States)
- Lancaster, California
- Mojave, California
- Ridgecrest, California
- Visalia, California
- Constituencies established in 1943
- 1943 establishments in California