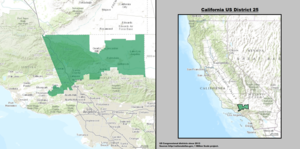
California's 25th congressional district
| California's 25th congressional district | |||
|---|---|---|---|
 California's 25th congressional district since January 3, 2013 | |||
| Representative |
| ||
| Population (2019) | 718,949 | ||
| Median household income | $84,670[1] | ||
| Ethnicity |
| ||
| Cook PVI | D+3[2] | ||
California's 25th congressional district is a congressional district in the U.S. state of California that currently covers most of northern Los Angeles County and part of eastern Ventura County. It includes the cities of Palmdale and Santa Clarita, most of Lancaster and Simi Valley, and part of the Los Angeles neighborhood of Porter Ranch in the San Fernando Valley. It is the most Republican congressional district located primarily within Los Angeles County.
The district is represented by Republican Mike Garcia, after his predecessor, Democrat Katie Hill, resigned November 3, 2019, over allegations of sexual misconduct with a staff member in violation of U.S. House personnel rules.[3] Garcia won the special election on May 12, 2020, against Christy Smith.[4] It is one of nine districts that voted for Joe Biden in the 2020 presidential election while being held or won by a Republican.
Prior to redistricting in 2011, the district included Mono and Inyo counties as well as part of San Bernardino and Los Angeles counties. Cities in the district included Santa Clarita, Palmdale, Barstow, and Bishop.
Demographics[]
According to the APM Research Lab's Voter Profile Tools (featuring the U.S. Census Bureau's 2019 American Community Survey), the district contained about 491,000 potential voters (citizens, age 18+). Of these, 44% are White, 34% Latino, 10% Black, and 9% Asian. Immigrants make up 17% of the district's potential voters. Median income among households (with one or more potential voter) in the district is about $86,600, while 9% of households live below the poverty line. 12% of residents 25 years and older have not graduated high school, while 26% hold a bachelor's degree or higher.
Recent results in statewide elections[]
| Year | U.S. President | U.S. Senator | Governor |
|---|---|---|---|
| 1992 | Bush (R): 39.0 – 36.1%[5] | Herschensohn (R): 53.9 – 36.6%[6] | Seymour (R): 47.9 – 43.1%[7] |
| 1994 | — | Huffington (R): 57.5 - 34.1%[8] | Wilson (R): 67.2 - 28.7%[9] |
| 1996 | Dole (R): 47.2 - 41.0%[10] | — | — |
| 1998 | — | Fong (R): 52.7 - 43.4%[11] | Davis (D): 49.5 - 47.5%[12] |
| 2000 | Bush (R): 51.4 – 44.7%[13] | Feinstein (D): 47.0 – 46.2%[14] | — |
| 2002 | — | — | Simon (R): 57.5 – 34.3%[15] |
| 2003 | — | — | Recall: |
| Schwarzenegger (R): 66.2 – 16.2%[17] | |||
| 2004 | Bush (R): 58.8 – 39.9%[18] | Jones (R): 49.3 – 45.6%[19] | — |
| 2006 | — | Mountjoy (R): 49.5 – 45.2%[20] | Schwarzenegger (R): 66.4 – 28.5%[21] |
| 2008 | Obama (D): 49.4 – 48.3%[22] | — | — |
| 2010 | — | Fiorina (R): 54.0 – 38.9% | Whitman (R): 50.9 – 41.4% |
| 2012 | Romney (R): 49.7 – 47.8% | Emken (R): 50.8 – 49.2% | — |
| 2014 | — | — | Kashkari (R): 57.2 – 42.8% |
| 2016 | H. Clinton (D): 50.3 – 43.6% | Harris (D): 60.1 – 39.9% | — |
| 2018 | — | de Leon (D): 50.3 – 49.7% | Newsom (D): 51.1 – 48.9% |
| 2020 | Biden (D): 54.0 – 43.9% | — | — |
List of members representing the district[]
| Member | Party | Dates | Cong- ress |
Electoral history | Counties |
|---|---|---|---|---|---|
| District created on January 3, 1953 | |||||
 Patrick J. Hillings |
Republican | January 3, 1953 – January 3, 1959 |
83rd 84th 85th |
Redistricted from the 12th district and re-elected in 1952. Re-elected in 1954. Re-elected in 1956. Retired to run for Attorney General of California. |
1953–1967 Los Angeles |
 George A. Kasem |
Democratic | January 3, 1959 – January 3, 1961 |
86th | Elected in 1958. Lost re-election. | |
 John H. Rousselot |
Republican | January 3, 1961 – January 3, 1963 |
87th | Elected in 1960. Lost re-election. | |
 Ronald B. Cameron |
Democratic | January 3, 1963 – January 3, 1967 |
88th 89th |
Elected in 1962. Re-elected in 1964. Lost re-election. | |
 Charles E. Wiggins |
Republican | January 3, 1967 – January 3, 1975 |
90th 91st 92nd 93rd |
Elected in 1966. Re-elected in 1968. Re-elected in 1970. Re-elected in 1972. Redistricted to the 39th district. |
1967–1973 Los Angeles, Orange |
| 1973–1983 Los Angeles | |||||
 Edward R. Roybal |
Democratic | January 3, 1975 – January 3, 1993 |
94th 95th 96th 97th 98th 99th 100th 101st 102nd |
Redistricted from the 30th district and re-elected in 1974. Re-elected in 1976. Re-elected in 1978. Re-elected in 1980. Re-elected in 1982. Re-elected in 1984. Re-elected in 1986. Re-elected in 1988. Re-elected in 1990. Retired. | |
| 1983–1993 Central/eastern Los Angeles | |||||
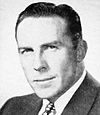
 Buck McKeon |
Republican | January 3, 1993 – January 3, 2015 |
103rd 104th 105th 106th 107th 108th 109th 110th 111th 112th 113th |
Elected in 1992. Re-elected in 1994. Re-elected in 1996. Re-elected in 1998. Re-elected in 2000. Re-elected in 2002. Re-elected in 2004. Re-elected in 2006. Re-elected in 2008. Re-elected in 2010. Re-elected in 2012. Retired. |
1993–2003 Northern Los Angeles |
2003–2013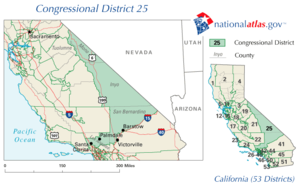 Inyo, northern Los Angeles, Mono, northwestern San Bernardino | |||||
| 2013–present Northern Los Angeles including Palmdale and Santa Clarita, northeastern Ventura including Simi Valley | |||||
 Steve Knight |
Republican | January 3, 2015 – January 3, 2019 |
114th 115th |
Elected in 2014. Re-elected in 2016. Lost re-election. | |
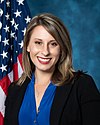 Katie Hill |
Democratic | January 3, 2019 – November 3, 2019 |
116th | Elected in 2018. Resigned. | |
| Vacant | November 3, 2019 – May 12, 2020 |
116th 117th | |||
 Mike Garcia |
Republican | May 12, 2020 – present |
Elected to finish Hill's term. Re-elected in 2020. Redistricted to the 27th district. | ||
Election results[]
Original district: 1953–1967[]
| Party | Candidate | Votes | % | |
|---|---|---|---|---|
| Republican | Patrick J. Hillings (Incumbent) | 135,465 | 64.3 | |
| Democratic | Woodrow Wilson Sayre | 75,125 | 35.7 | |
| Total votes | 210,590 | 100.0 | ||
| Turnout | ||||
| Republican hold | ||||
| Party | Candidate | Votes | % | |
|---|---|---|---|---|
| Republican | Patrick J. Hillings (Incumbent) | 113,027 | 65.2 | |
| Democratic | John S. Sobieski | 60,370 | 34.8 | |
| Total votes | 173,397 | 100.0 | ||
| Turnout | ||||
| Republican hold | ||||
| Party | Candidate | Votes | % | |
|---|---|---|---|---|
| Republican | Patrick J. Hillings (Incumbent) | 166,305 | 63.8 | |
| Democratic | John S. Sobieski | 94,180 | 36.2 | |
| Total votes | 260,485 | 100.0 | ||
| Turnout | ||||
| Republican hold | ||||
| Party | Candidate | Votes | % | |||
|---|---|---|---|---|---|---|
| Democratic | George A. Kasem | 135,009 | 50.1 | |||
| Republican | Prescott O. Lieberg | 134,406 | 49.9 | |||
| Total votes | 269,415 | 100.0 | ||||
| Turnout | ||||||
| Democratic gain from Republican | ||||||
| Party | Candidate | Votes | % | |||
|---|---|---|---|---|---|---|
| Republican | John H. Rousselot | 182,545 | 53.6 | |||
| Democratic | George A. Kasem (Incumbent) | 158,289 | 46.4 | |||
| Total votes | 340,834 | 100.0 | ||||
| Turnout | ||||||
| Republican gain from Democratic | ||||||
| Party | Candidate | Votes | % | |||
|---|---|---|---|---|---|---|
| Democratic | Ronald B. Cameron | 62,371 | 53.6 | |||
| Republican | John H. Rousselot (Incumbent) | 53,961 | 46.4 | |||
| Total votes | 116,332 | 100.0 | ||||
| Turnout | ||||||
| Democratic gain from Republican | ||||||
| Party | Candidate | Votes | % | |
|---|---|---|---|---|
| Democratic | Ronald B. Cameron (Incumbent) | 81,320 | 55.4 | |
| Republican | Frank J. Walton | 65,344 | 44.6 | |
| Total votes | 146,664 | 100.0 | ||
| Turnout | ||||
| Democratic hold | ||||
First redistricting: 1967–1973[]
| Party | Candidate | Votes | % | |||
|---|---|---|---|---|---|---|
| Republican | Charles E. Wiggins | 70,154 | 52.6 | |||
| Democratic | Ronald B. Cameron (Incumbent) | 63,345 | 47.4 | |||
| Total votes | 133,499 | |||||
| Republican gain from Democratic | ||||||
| Party | Candidate | Votes | % | |
|---|---|---|---|---|
| Republican | Charles E. Wiggins (Incumbent) | 141,600 | 68.6 | |
| Democratic | Keith F. Shirey | 64,732 | 31.4 | |
| Total votes | 206,332 | 100.0 | ||
| Turnout | ||||
| Republican hold | ||||
| Party | Candidate | Votes | % | |
|---|---|---|---|---|
| Republican | Charles E. Wiggins (Incumbent) | 116,169 | 63.3 | |
| Democratic | Leslie W. "Les" Craven | 64,386 | 35.1 | |
| American Independent | Kevin Scanlon | 2,994 | 1.6 | |
| Total votes | 183,549 | 100.0 | ||
| Turnout | ||||
| Republican hold | ||||
Second redistricting: 1973–1983[]
| Party | Candidate | Votes | % | |
|---|---|---|---|---|
| Republican | Charles E. Wiggins (Incumbent) | 115,908 | 64.9 | |
| Democratic | Leslie W. "Les" Craven | 50,015 | 31.9 | |
| American Independent | Alfred Romirez | 5,541 | 3.1 | |
| Total votes | 171,464 | 100.0 | ||
| Turnout | ||||
| Republican hold | ||||
| Party | Candidate | Votes | % | |||
|---|---|---|---|---|---|---|
| Democratic | Edward R. Roybal (Incumbent) | 43,998 | 100.0 | |||
| Turnout | ||||||
| Democratic gain from Republican | ||||||
| Party | Candidate | Votes | % | |
|---|---|---|---|---|
| Democratic | Edward R. Roybal (Incumbent) | 57,966 | 71.9 | |
| Republican | Robert K. Watson | 17,737 | 22.0 | |
| Peace and Freedom | Marilyn Se | 4,922 | 6.1 | |
| Total votes | 80,625 | 100.0 | ||
| Turnout | ||||
| Democratic hold | ||||
| Party | Candidate | Votes | % | |
|---|---|---|---|---|
| Democratic | Edward R. Roybal (Incumbent) | 45,881 | 67.4 | |
| Republican | Robert K. Watson | 22,205 | 32.6 | |
| Total votes | 68,086 | 100.0 | ||
| Turnout | ||||
| Democratic hold | ||||
| Party | Candidate | Votes | % | |
|---|---|---|---|---|
| Democratic | Edward R. Roybal (Incumbent) | 49,080 | 66.0 | |
| Republican | Richard E. Ferraro | 21,116 | 28.4 | |
| Libertarian | William D. Mitchell | 4,169 | 5.6 | |
| Total votes | 74,365 | 100.0 | ||
| Turnout | ||||
| Democratic hold | ||||
Third redistricting: 1983–1993[]
| Party | Candidate | Votes | % | |
|---|---|---|---|---|
| Democratic | Edward R. Roybal (Incumbent) | 71,106 | 84.5 | |
| Libertarian | Daniel John Gorham | 12,060 | 14.5 | |
| Total votes | 83,166 | 100.0 | ||
| Turnout | ||||
| Democratic hold | ||||
| Party | Candidate | Votes | % | |
|---|---|---|---|---|
| Democratic | Edward R. Roybal (Incumbent) | 74,261 | 71.7 | |
| Republican | Roy D. "Bill" Bloxom | 24,968 | 24.1 | |
| Libertarian | Anthony G. Bajada | 4,370 | 4.2 | |
| Total votes | 103,599 | 100.0 | ||
| Turnout | ||||
| Democratic hold | ||||
| Party | Candidate | Votes | % | |
|---|---|---|---|---|
| Democratic | Edward R. Roybal (Incumbent) | 62,692 | 76.1 | |
| Republican | Gregory L. Hardy | 17,558 | 21.3 | |
| Libertarian | Ted Brown | 2,163 | 2.6 | |
| Total votes | 82,413 | 100.0 | ||
| Turnout | ||||
| Democratic hold | ||||
| Party | Candidate | Votes | % | |
|---|---|---|---|---|
| Democratic | Edward R. Roybal (Incumbent) | 85,378 | 85.5 | |
| Peace and Freedom | Paul Reyes | 8,746 | 8.8 | |
| Libertarian | John C. Thie | 5,752 | 5.8 | |
| Total votes | 98,876 | 100.0 | ||
| Turnout | ||||
| Democratic hold | ||||
| Party | Candidate | Votes | % | |
|---|---|---|---|---|
| Democratic | Edward R. Roybal (Incumbent) | 48,120 | 70.0 | |
| Republican | Steven J. Renshaw | 17,021 | 24.8 | |
| Libertarian | Robert H. Scott | 3,576 | 5.2 | |
| Total votes | 68,717 | 100.0 | ||
| Turnout | ||||
| Democratic hold | ||||
Fourth redistricting: 1993–2003[]
| Party | Candidate | Votes | % | ||
|---|---|---|---|---|---|
| Republican | Buck McKeon | 113,611 | 51.9 | ||
| Democratic | James H. Gilmartin | 72,233 | 33.0 | ||
| Independent | Rick Pamplin | 13,930 | 6.4 | ||
| Libertarian | Peggy L. Christensen | 6,932 | 3.2 | ||
| Green | Charles Wilken | 6,919 | 3.2 | ||
| Peace and Freedom | Nancy Lawrence | 5,090 | 2.3 | ||
| Total votes | 218,715 | 100.0 | |||
| Turnout | |||||
| Republican win (new seat) | |||||
| Party | Candidate | Votes | % | |
|---|---|---|---|---|
| Republican | Buck McKeon (Incumbent) | 110,301 | 64.89 | |
| Democratic | James H. Gilmartin | 53,445 | 31.44 | |
| Libertarian | Devin Cutler | 6,205 | 3.65 | |
| No party | Tulley (write-in) | 20 | 0.01 | |
| Total votes | 169,971 | 100.0 | ||
| Turnout | ||||
| Republican hold | ||||
| Party | Candidate | Votes | % | |
|---|---|---|---|---|
| Republican | Buck McKeon (Incumbent) | 122,428 | 62.4 | |
| Democratic | Diane Trautman | 65,089 | 33.2 | |
| Libertarian | Bruce Acker | 6,173 | 3.2 | |
| Peace and Freedom | Justin Gerber | 2,513 | 1.2 | |
| Total votes | 196,203 | 100.0 | ||
| Turnout | ||||
| Republican hold | ||||
| Party | Candidate | Votes | % | |
|---|---|---|---|---|
| Republican | Buck McKeon (Incumbent) | 114,013 | 74.67 | |
| Libertarian | Bruce Acker | 38,669 | 25.33 | |
| Total votes | 152,682 | 100.0 | ||
| Turnout | ||||
| Republican hold | ||||
| Party | Candidate | Votes | % | |
|---|---|---|---|---|
| Republican | Buck McKeon (Incumbent) | 138,628 | 62.3 | |
| Democratic | Sid Gold | 73,921 | 33.2 | |
| Libertarian | Bruce R. Acker | 7,219 | 3.2 | |
| Natural Law | Mews Small | 3,010 | 1.3 | |
| Total votes | 222,778 | 100.0 | ||
| Turnout | ||||
| Republican hold | ||||
Fifth redistricting: 2003–2013[]
| Party | Candidate | Votes | % | |
|---|---|---|---|---|
| Republican | Buck McKeon (Incumbent) | 80,775 | 65.0 | |
| Democratic | Bob Conaway | 38,674 | 31.1 | |
| Libertarian | Frank M. Consolo Jr. | 4,887 | 3.9 | |
| Total votes | 124,336 | 100.0 | ||
| Turnout | ||||
| Republican hold | ||||
| Party | Candidate | Votes | % | |
|---|---|---|---|---|
| Republican | Buck McKeon (Incumbent) | 145,575 | 64.5 | |
| Democratic | Fred "Tim" Willoughby | 80,395 | 35.5 | |
| Total votes | 225,970 | 100.0 | ||
| Turnout | ||||
| Republican hold | ||||
| Party | Candidate | Votes | % | |
|---|---|---|---|---|
| Republican | Buck McKeon (Incumbent) | 93,987 | 60.0 | |
| Democratic | Robert Rodriguez | 55,913 | 35.7 | |
| Libertarian | David W. Erickson | 6,873 | 4.3 | |
| Total votes | 156,773 | 100.0 | ||
| Turnout | ||||
| Republican hold | ||||
| Party | Candidate | Votes | % | |
|---|---|---|---|---|
| Republican | Buck McKeon (Incumbent) | 144,660 | 57.73 | |
| Democratic | Jackie Conaway | 105,929 | 42.27 | |
| Total votes | 250,589 | 100.0 | ||
| Turnout | 72.24 | |||
| Republican hold | ||||
| Party | Candidate | Votes | % | |
|---|---|---|---|---|
| Republican | Buck McKeon (Incumbent) | 118,308 | 61.83 | |
| Democratic | Jackie Conaway | 73,028 | 38.17 | |
| Total votes | 191,336 | 100.0 | ||
| Turnout | ||||
| Republican hold | ||||
Sixth redistricting: 2013–present[]
| Party | Candidate | Votes | % | |
|---|---|---|---|---|
| Republican | Buck McKeon (Incumbent) | 121,593 | 53.2 | |
| Democratic | Lee Rogers | 106,982 | 46.8 | |
| Total votes | 228,575 | 100.0 | ||
| Turnout | ||||
| Republican hold | ||||
| Party | Candidate | Votes | % | |
|---|---|---|---|---|
| Republican | Steve Knight | 60,847 | 53.3 | |
| Republican | Tony Strickland | 53,225 | 46.7 | |
| Total votes | 114,072 | 100.0 | ||
| Turnout | ||||
| Republican hold | ||||
| Party | Candidate | Votes | % | |
|---|---|---|---|---|
| Republican | Steve Knight (Incumbent) | 138,755 | 53.1 | |
| Democratic | Bryan Caforio | 122,406 | 46.9 | |
| Total votes | 261,161 | 100.0 | ||
| Republican hold | ||||
| Party | Candidate | Votes | % | |
|---|---|---|---|---|
| Democratic | Katie Hill | 133,209 | 54.4 | |
| Republican | Steve Knight (Incumbent) | 111,813 | 45.6 | |
| Total votes | 245,022 | 100.0 | ||
| Democratic gain from Republican | ||||
| Party | Candidate | Votes | % | ||
|---|---|---|---|---|---|
| Republican | Mike Garcia | 95,383 | 54.9 | ||
| Democratic | Christy Smith | 78,406 | 45.1 | ||
| Total votes | 173,868 | 100.0 | |||
| Republican gain from Democratic | |||||
| Party | Candidate | Votes | % | |
|---|---|---|---|---|
| Republican | Mike Garcia (Incumbent) | 169,638 | 50.05 | |
| Democratic | Christy Smith | 169,305 | 49.95 | |
| Total votes | 338,943 | 100.0 | ||
| Republican hold | ||||
See also[]
References[]
- ^ Center for New Media & Promotion (CNMP), US Census Bureau. "My Congressional District". www.census.gov. Retrieved July 19, 2019.
- ^ "Partisan Voting / – Districts of the 115th Congress" (PDF). The Cook Political Report. April 7, 2017. Retrieved April 7, 2017.
- ^ "Democratic Rep. Katie Hill to resign amid allegations of improper relationship with staffer". Los Angeles Times. October 27, 2019.
- ^ Panetta, Grace. "Republican Mike Garcia defeats Democrat Christy Smith in the special election for California's 25th congressional district". Business Insider. Retrieved May 18, 2020.
- ^ "Supplement to the Statement of Vote, President by County (1992)" (PDF). Retrieved March 14, 2021.
- ^ "Supplement to the Statement of Vote, Senator by County (1992)" (PDF). Retrieved March 14, 2021.
- ^ "Supplement to the Statement of Vote, Senator by County (1992)" (PDF). Retrieved March 14, 2021.
- ^ "Supplement to the Statement of Vote, United States Senator, Counties by Congressional Districts (1994)" (PDF). Retrieved March 14, 2021.
- ^ "Supplement to the Statement of Vote, Governor, Counties by Congressional Districts (1994)" (PDF). Retrieved March 14, 2021.
- ^ "Supplement to the Statement of Vote, President, Counties by Congressional Districts (1996)" (PDF). Retrieved March 14, 2021.
- ^ "Supplement to the Statement of Vote, Senator, Counties by Congressional Districts (1998)" (PDF). Archived from the original (PDF) on October 1, 2011. Retrieved March 14, 2021.
- ^ "Supplement to the Statement of Vote, Governor, Counties by Congressional Districts (1998)" (PDF). Archived from the original (PDF) on October 1, 2011. Retrieved March 14, 2021.
- ^ "Statement of Vote (2000 President)" (PDF). Archived from the original (PDF) on May 20, 2011. Retrieved July 19, 2019.
- ^ "Statement of Vote (2000 Senator)" (PDF). Archived from the original (PDF) on May 20, 2011. Retrieved July 19, 2019.
- ^ "Statement of Vote (2002 Governor)" (PDF). Archived from the original (PDF) on November 11, 2010. Retrieved July 19, 2019.
- ^ "Statement of Vote (2003 Recall Question)" (PDF). Archived from the original (PDF) on May 20, 2011. Retrieved July 19, 2019.
- ^ "Statement of Vote (2003 Governor)" (PDF). Archived from the original (PDF) on May 20, 2011. Retrieved July 19, 2019.
- ^ "Statement of Vote (2004 President)" (PDF). Archived from the original (PDF) on May 20, 2011. Retrieved July 19, 2019.
- ^ "Statement of Vote (2004 Senator)" (PDF). Archived from the original (PDF) on August 10, 2011. Retrieved July 19, 2019.
- ^ "Statement of Vote (2006 Senator)" (PDF). Archived from the original (PDF) on August 10, 2011. Retrieved July 19, 2019.
- ^ "Statement of Vote (2006 Governor)" (PDF). Archived from the original (PDF) on August 10, 2011. Retrieved July 19, 2019.
- ^ "(2008 President)". Archived from the original on February 14, 2009. Retrieved July 19, 2019.
- ^ "1952 election results" (PDF). Clerk.house.gov. Retrieved September 22, 2018.
- ^ "1954 election results" (PDF). Clerk.house.gov. Retrieved September 22, 2018.
- ^ "1956 election results" (PDF). Clerk.house.gov. Retrieved September 22, 2018.
- ^ "1958 election results" (PDF). Clerk.house.gov. Retrieved September 22, 2018.
- ^ "1960 election results" (PDF). Clerk.house.gov. Retrieved September 22, 2018.
- ^ "1962 election results" (PDF). Clerk.house.gov. Retrieved September 22, 2018.
- ^ "1964 election results" (PDF). Clerk.house.gov. Retrieved September 22, 2018.
- ^ "1966 election results" (PDF). Clerk.house.gov. Retrieved September 22, 2018.
- ^ "1968 election results" (PDF). Clerk.house.gov. Retrieved September 22, 2018.
- ^ "1970 election results" (PDF). Clerk.house.gov. Retrieved September 22, 2018.
- ^ "1972 election results" (PDF). Clerk.house.gov. Retrieved September 22, 2018.
- ^ "1974 election results" (PDF). Clerk.house.gov. Retrieved September 22, 2018.
- ^ "1976 election results" (PDF). Clerk.house.gov. Retrieved September 22, 2018.
- ^ "1978 election results" (PDF). Clerk.house.gov. Retrieved September 22, 2018.
- ^ "1980 election results" (PDF). Clerk.house.gov. Retrieved September 22, 2018.
- ^ "1982 election results" (PDF). Clerk.house.gov. Retrieved September 22, 2018.
- ^ "1984 election results" (PDF). Clerk.house.gov. Retrieved September 22, 2018.
- ^ "1986 election results" (PDF). Clerk.house.gov. Retrieved September 22, 2018.
- ^ "1988 election results" (PDF). Clerk.house.gov. Retrieved September 22, 2018.
- ^ "1990 election results" (PDF). Clerk.house.gov. Retrieved September 22, 2018.
- ^ "1992 election results" (PDF). Clerk.house.gov. Retrieved September 22, 2018.
- ^ "1994 election results" (PDF). Clerk.house.gov. Retrieved September 22, 2018.
- ^ "1996 election results" (PDF). Clerk.house.gov. Retrieved September 22, 2018.
- ^ "1998 election results" (PDF). Clerk.house.gov. Retrieved September 22, 2018.
- ^ "2000 election results" (PDF). Clerk.house.gov. Retrieved September 22, 2018.
- ^ "2002 general election results" (PDF). Archived from the original (PDF) on February 3, 2009. Retrieved July 19, 2019.
- ^ [1][permanent dead link]
- ^ "2006 general election results" (PDF). Archived from the original (PDF) on November 27, 2008. Retrieved July 19, 2019.
- ^ "Archived copy" (PDF). Archived from the original (PDF) on February 2, 2014. Retrieved January 21, 2014.
{{cite web}}: CS1 maint: archived copy as title (link) - ^ "Archived copy" (PDF). Archived from the original (PDF) on May 20, 2011. Retrieved January 21, 2014.
{{cite web}}: CS1 maint: archived copy as title (link) - ^ "Archived copy" (PDF). Archived from the original (PDF) on October 19, 2013. Retrieved January 21, 2014.
{{cite web}}: CS1 maint: archived copy as title (link) - ^ "Archived copy". Archived from the original on December 22, 2014. Retrieved December 22, 2014.
{{cite web}}: CS1 maint: archived copy as title (link) - ^ "Archived copy". Archived from the original on November 30, 2016. Retrieved December 10, 2016.
{{cite web}}: CS1 maint: archived copy as title (link) - ^ "United States Representative in Congress by District" (PDF). Retrieved March 19, 2019.
- ^ "California Special Election Results: 25th Congressional District". The New York Times. New York, New York. May 13, 2020. Retrieved May 14, 2020.
- ^ "U.S. House of Representatives District 25 - Districtwide Results". Retrieved May 21, 2020.
External links[]
- "California's 25th Congressional District - CA-25 Representatives & District Map". GovTrack.us. Retrieved May 23, 2020.
- "RAND California Election Returns: District Definitions". December 19, 2010. Archived from the original on December 19, 2010. Retrieved May 23, 2020.
- (PDF). September 10, 2008 https://web.archive.org/web/20080910061011/http://www.calvoter.org/voter/maps/congress/CD25.pdf. Archived from the original (PDF) on September 10, 2008. Retrieved May 23, 2020.
{{cite web}}: Missing or empty|title=(help)

- Congressional districts of California
- Government of Los Angeles County, California
- Government of Ventura County, California
- Angeles National Forest
- Antelope Valley
- San Fernando Valley
- Santa Susana Mountains
- Sierra Pelona Ridge
- Simi Hills
- Lancaster, California
- Palmdale, California
- Porter Ranch, Los Angeles
- Santa Clara River (California)
- Santa Clarita, California
- Simi Valley, California
- Constituencies established in 1953
- 1953 establishments in California