California's 30th congressional district
| California's 30th congressional district | |||
|---|---|---|---|
 California's 30th congressional district since January 3, 2013 | |||
| Representative |
| ||
| Population (2019) | 764,062 | ||
| Median household income | $89,460[1] | ||
| Ethnicity |
| ||
| Cook PVI | D+20[2] | ||

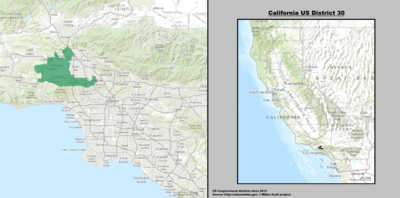
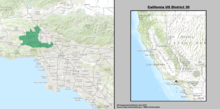
California's 30th congressional district is a congressional district in the U.S. state of California, in the western San Fernando Valley of Los Angeles County and the eastern Simi Hills of Ventura County.
The district is currently represented by Democrat Brad Sherman, who won the November 2012 Election for the seat.[3]
Communities[]
The 30th congressional district boundaries currently include the communities of:
- Bell Canyon
- Canoga Park, Los Angeles
- Chatsworth, Los Angeles
- Encino, Los Angeles
- Granada Hills, Los Angeles
- Hidden Hills
- Northridge, Los Angeles
- Porter Ranch, Los Angeles
- Reseda, Los Angeles
- Santa Susana Field Laboratory
- Sherman Oaks, Los Angeles
- Studio City, Los Angeles
- Tarzana, Los Angeles
- Toluca Lake, Los Angeles
- West Hills, Los Angeles
- Winnetka, Los Angeles
- Woodland Hills, Los Angeles
Competitiveness[]
In statewide races[]
| Election results from statewide races | ||
|---|---|---|
| Year | Office | Results |
| 1990 | Governor[4] | Feinstein 48.0% - 46.7% |
| 1992 | President[5] | Clinton 62.7% - 24.2.7% |
| Senator[6] | Boxer 61.2% - 30.3% | |
| Senator (Special)[7] | Feinstein 66.7% - 20.3% | |
| 1994 | Governor[8] | Brown 59.8% - 36.3% |
| Senator[9] | Feinstein 59.3% - 30.5% | |
| 1996 | President[10] | Clinton 71.0% - 19.8% |
| 1998 | Governor[11] | Davis 77.1% - 18.8% |
| Senator[12] | Boxer 72.7% - 23.5% | |
| 2000 | President[13] | Gore 75.0% - 19.3% |
| Senator[14] | Feinstein 73.2% - 16.5% | |
| 2002 | Governor[15] | Davis 57.1% - 33.3% |
| 2003 | Recall[16][17] | |
| Schwarzenegger 43.5% - 38.7% | ||
| 2004 | President[18] | Kerry 66.1% - 32.8% |
| Senator[19] | Boxer 69.4% - 26.8% | |
| 2006 | Governor[20] | Schwarzenegger 49.8% - 45.9% |
| Senator[21] | Feinstein 71.7% - 29.6% | |
| 2008 | President[22] | Obama 70.4% - 27.9% |
| 2010 | Governor[23] | Brown 62.1% - 24.8% |
| Senator[24] | Boxer 62.8% - 33.8% | |
| 2012 | President[25] | Obama 65.3% - 32.1% |
| Senator[26] | Feinstein 68.6% - 31.4% | |
| 2014 | Governor[27] | Brown 64.3% – 35.7% |
| 2016 | President[28] | Clinton 69.1% - 25.7% |
| Senator[29] | Harris 66.5% - 33.5% | |
| 2018 | Governor[30] | Newsom 69.9% – 30.1% |
| Senator[31] | Feinstein 62.1% – 37.9% | |
| 2020 | President[32] | Biden 68.7% - 29.4% |
List of members representing the district[]


Election results[]
|
1952 • 1954 • 1956 • 1958 • 1960 • 1962 • 1964 • 1966 • 1968 • 1970 • 1972 • 1974 • 1976 • 1978 • 1980 • 1982 (Special) • 1982 • 1984 • 1986 • 1988 • 1990 • 1992 • 1994 • 1996 • 1998 • 2000 • 2002 • 2004 • 2006 • 2008 • 2010 • 2012 • 2014 • 2016 • 2018 • 2020 |
1952[]
| Party | Candidate | Votes | % | ||
|---|---|---|---|---|---|
| Republican | Bob Wilson | 121,322 | 59.6 | ||
| Democratic | De Graff Austin | 82,311 | 40.4 | ||
| Total votes | 203,633 | 100.0 | |||
| Republican win (new seat) | |||||
1954[]
| Party | Candidate | Votes | % | |
|---|---|---|---|---|
| Republican | Bob Wilson (Incumbent) | 94,623 | 60.4 | |
| Democratic | Ross T. McIntire | 61,994 | 39.6 | |
| Total votes | 156,617 | 100.0 | ||
| Republican hold | ||||
1956[]
| Party | Candidate | Votes | % | |
|---|---|---|---|---|
| Republican | Bob Wilson (Incumbent) | 142,753 | 66.7 | |
| Democratic | George A. Cheney | 71,112 | 33.3 | |
| Total votes | 213,865 | 100.0 | ||
| Republican hold | ||||
1958[]
| Party | Candidate | Votes | % | |
|---|---|---|---|---|
| Republican | Bob Wilson (Incumbent) | 112,290 | 52.7 | |
| Democratic | Lionel Van Deerlin | 90,641 | 47.3 | |
| Total votes | 202,931 | 100.0 | ||
| Republican hold | ||||
1960[]
| Party | Candidate | Votes | % | |
|---|---|---|---|---|
| Republican | Bob Wilson (Incumbent) | 158,679 | 59.3 | |
| Democratic | Walter Wencke | 108,882 | 40.7 | |
| Total votes | 267,561 | 100.0 | ||
| Republican hold | ||||
1962[]
| Party | Candidate | Votes | % | |||
|---|---|---|---|---|---|---|
| Democratic | Edward R. Roybal | 69,008 | 56.5 | |||
| Republican | Gordon L. McDonough (Incumbent) | 53,104 | 43.5 | |||
| Total votes | 122,112 | 100.0 | ||||
| Democratic gain from Republican | ||||||
1964[]
| Party | Candidate | Votes | % | |
|---|---|---|---|---|
| Democratic | Edward R. Roybal (Incumbent) | 90,329 | 66.3 | |
| Republican | Alfred J. Feder | 45,912 | 33.7 | |
| Total votes | 136,241 | 100.0 | ||
| Democratic hold | ||||
1966[]
| Party | Candidate | Votes | % | |
|---|---|---|---|---|
| Democratic | Edward R. Roybal (Incumbent) | 72,173 | 66.4 | |
| Republican | Henri O'Bryant Jr. | 36,506 | 33.6 | |
| Total votes | 108,679 | 100.0 | ||
| Democratic hold | ||||
1968[]
| Party | Candidate | Votes | % | |
|---|---|---|---|---|
| Democratic | Edward R. Roybal (Incumbent) | 75,381 | 67.5 | |
| Republican | Samuel F. Cavnar | 36,312 | 32.5 | |
| Total votes | 111,693 | 100.0 | ||
| Democratic hold | ||||
1970[]
| Party | Candidate | Votes | % | |
|---|---|---|---|---|
| Democratic | Edward R. Roybal (Incumbent) | 63,903 | 68.3 | |
| Republican | Samuel F. Cavnar | 28,038 | 29.9 | |
| American Independent | Boris Belousov | 1,681 | 1.8 | |
| Total votes | 93,622 | 100.0 | ||
| Democratic hold | ||||
1972[]
| Party | Candidate | Votes | % | |
|---|---|---|---|---|
| Democratic | Edward R. Roybal (Incumbent) | 76,521 | 68.4 | |
| Republican | Bill Brophy | 32,005 | 28.6 | |
| Peace and Freedom | Lewis McCammon | 3,355 | 3.0 | |
| Total votes | 111,881 | 100.0 | ||
| Democratic hold | ||||
1974[]
| Party | Candidate | Votes | % | |
|---|---|---|---|---|
| Democratic | George E. Danielson (Incumbent) | 66,074 | 74.2 | |
| Republican | John J. Perez | 22,928 | 25.8 | |
| Total votes | 89,002 | 100.0 | ||
| Democratic hold | ||||
1976[]
| Party | Candidate | Votes | % | |
|---|---|---|---|---|
| Democratic | George E. Danielson (Incumbent) | 82,767 | 74.4 | |
| Republican | Harry Couch | 28,503 | 25.6 | |
| Total votes | 111,270 | 100.0 | ||
| Democratic hold | ||||
1978[]
| Party | Candidate | Votes | % | |
|---|---|---|---|---|
| Democratic | George E. Danielson (Incumbent) | 66,241 | 71.4 | |
| Republican | Henry Ares | 26,511 | 28.6 | |
| Total votes | 92,752 | 100.0 | ||
| Democratic hold | ||||
1980[]
| Party | Candidate | Votes | % | |
|---|---|---|---|---|
| Democratic | George E. Danielson (Incumbent) | 74,119 | 72.1 | |
| Republican | J. Arthur "Art" Platten | 24,136 | 23.5 | |
| Libertarian | Bruce M. Hobbs | 4,480 | 4.4 | |
| Total votes | 102,735 | 100.0 | ||
| Democratic hold | ||||
1982 (Special)[]
| Party | Candidate | Votes | % | |
|---|---|---|---|---|
| Democratic | Matthew G. Martinez | 14,593 | 51.0 | |
| Republican | Ralph Roy Ramirez | 14,043 | 49.0 | |
| Total votes | 28,636 | 100.0 | ||
| Democratic hold | ||||
1982[]
| Party | Candidate | Votes | % | |
|---|---|---|---|---|
| Democratic | Matthew G. Martinez (Incumbent) | 60,905 | 53.9 | |
| Republican | John H. Rousselot (Incumbent) | 52,177 | 46.1 | |
| Total votes | 113,082 | 100.0 | ||
| Democratic hold | ||||
1984[]
| Party | Candidate | Votes | % | |
|---|---|---|---|---|
| Democratic | Matthew G. Martinez (Incumbent) | 64,378 | 51.8 | |
| Republican | Richard Gomez | 53,900 | 43.4 | |
| American Independent | Houston A. Meyers | 6,055 | 4.8 | |
| Total votes | 124,333 | 100.0 | ||
| Democratic hold | ||||
1986[]
| Party | Candidate | Votes | % | |
|---|---|---|---|---|
| Democratic | Matthew G. Martinez (Incumbent) | 59,369 | 62.5 | |
| Republican | John W. Almquist | 33,705 | 35.5 | |
| Libertarian | Kim J. Goldsworthy | 1,911 | 2.0 | |
| Total votes | 94,985 | 100.0 | ||
| Democratic hold | ||||
1988[]
| Party | Candidate | Votes | % | |
|---|---|---|---|---|
| Democratic | Matthew G. Martinez (Incumbent) | 72,253 | 59.9 | |
| Republican | Ralph Roy Ramirez | 43,833 | 25.5 | |
| American Independent | Houston A. Myers | 2,694 | 2.2 | |
| Libertarian | Kim J. Goldsworthy | 1,864 | 1.5 | |
| Total votes | 120,644 | 100.0 | ||
| Democratic hold | ||||
1990[]
| Party | Candidate | Votes | % | |
|---|---|---|---|---|
| Democratic | Matthew G. Martinez (Incumbent) | 45,456 | 58.2 | |
| Republican | Reuben D. Franco | 28,914 | 37.0 | |
| Libertarian | George Curtis Feger | 3,713 | 4.8 | |
| Total votes | 78,083 | 100.0 | ||
| Democratic hold | ||||
1992[]
| Party | Candidate | Votes | % | |
|---|---|---|---|---|
| Democratic | Xavier Becerra | 48,800 | 58.5 | |
| Republican | Mark Robbins | 20,034 | 25.8 | |
| Green | Blase Bonpane | 6,315 | 7.6 | |
| Peace and Freedom | Elizabeth A. Nakano | 6,173 | 7.4 | |
| Libertarian | Andrew "Drew" Consalvo | 2,221 | 2.7 | |
| Total votes | 83,543 | 100.0 | ||
| Democratic hold | ||||
1994[]
| Party | Candidate | Votes | % | |
|---|---|---|---|---|
| Democratic | Xavier Becerra (Incumbent) | 43,943 | 66.2 | |
| Republican | David A. Ramirez | 18,741 | 28.2 | |
| Libertarian | R. William Weilberg | 3,741 | 5.6 | |
| Total votes | 66,425 | 100.0 | ||
| Democratic hold | ||||
1996[]
| Party | Candidate | Votes | % | |
|---|---|---|---|---|
| Democratic | Xavier Becerra (Incumbent) | 58,283 | 72.4 | |
| Republican | Patricia Parker | 15,078 | 18.7 | |
| Libertarian | Pam Probst | 2,759 | 3.4 | |
| Peace and Freedom | Shirley Mandel | 2,499 | 3.1 | |
| Natural Law | Rosemary Watson-Frith | 1,971 | 2.4 | |
| Total votes | 70,590 | 100.0 | ||
| Democratic hold | ||||
1998[]
| Party | Candidate | Votes | % | |
|---|---|---|---|---|
| Democratic | Xavier Becerra (Incumbent) | 58,230 | 81.2 | |
| Republican | Patricia Parker | 13,441 | 18.8 | |
| Total votes | 71,671 | 100.0 | ||
| Democratic hold | ||||
2000[]
| Party | Candidate | Votes | % | |
|---|---|---|---|---|
| Democratic | Xavier Becerra (Incumbent) | 83,223 | 83.3 | |
| Republican | Tony Goss | 11,788 | 11.8 | |
| Libertarian | Jason E. Heath | 2,858 | 2.9 | |
| Natural Law | Gary D. Hearne | 2,051 | 2.0 | |
| Total votes | 99,920 | 100.0 | ||
| Democratic hold | ||||
2002[]
| Party | Candidate | Votes | % | |
|---|---|---|---|---|
| Democratic | Henry Waxman (Incumbent) | 130,604 | 70.4 | |
| Republican | Tony D. Goss | 54,989 | 29.6 | |
| Total votes | 185,593 | 100.0 | ||
| Democratic hold | ||||
2004[]
| Party | Candidate | Votes | % | |
|---|---|---|---|---|
| Democratic | Henry Waxman (Incumbent) | 216,682 | 71.3 | |
| Republican | Victor Elizalde | 87,465 | 28.7 | |
| Total votes | 313,147 | 100.0 | ||
| Democratic hold | ||||
2006[]
| Party | Candidate | Votes | % | |
|---|---|---|---|---|
| Democratic | Henry Waxman (Incumbent) | 151,284 | 71.5 | |
| Republican | David Nelson Jones | 55,904 | 26.4 | |
| Peace and Freedom | Adele M. Cannon | 4,546 | 2.1 | |
| Total votes | 211,734 | 100.0 | ||
| Democratic hold | ||||
2008[]
| Party | Candidate | Votes | % | |
|---|---|---|---|---|
| Democratic | Henry Waxman (Incumbent) | 242,792 | 100.0 | |
| Democratic hold | ||||
2010[]
| Party | Candidate | Votes | % | |
|---|---|---|---|---|
| Democratic | Henry Waxman (Incumbent) | 153,663 | 64.7 | |
| Republican | Charles E. Wilkerson | 75,948 | 31.9 | |
| Libertarian | Erich D. Miller | 5,021 | 2.1 | |
| Peace and Freedom | Richard R. Castaldo | 3,115 | 1.3 | |
| Total votes | 237,747 | 100.0 | ||
| Democratic hold | ||||
2012[]
| Party | Candidate | Votes | % | |
|---|---|---|---|---|
| Democratic | Brad Sherman (Incumbent) | 149,456 | 60.3 | |
| Democratic | Howard Berman (incumbent) | 98,395 | 39.7 | |
| Total votes | 247,851 | 100.0 | ||
| Democratic hold | ||||
2014[]
| Party | Candidate | Votes | % | |
|---|---|---|---|---|
| Democratic | Brad Sherman (Incumbent) | 86,568 | 65.6 | |
| Republican | Mark S. Reed | 45,315 | 34.4 | |
| Total votes | 131,883 | 100% | ||
| Democratic hold | ||||
2016[]
| Party | Candidate | Votes | % | |
|---|---|---|---|---|
| Democratic | Brad Sherman (Incumbent) | 205,279 | 72.6 | |
| Republican | Mark S. Reed | 77,325 | 27.4 | |
| Total votes | 282,604 | 100.0 | ||
| Democratic hold | ||||
2018[]
| Party | Candidate | Votes | % | |
|---|---|---|---|---|
| Democratic | Brad Sherman (Incumbent) | 191,573 | 73.4 | |
| Republican | Mark S. Reed | 69,420 | 26.6 | |
| Total votes | 260,993 | 100.0 | ||
| Democratic hold | ||||
2020[]
| Party | Candidate | Votes | % | |
|---|---|---|---|---|
| Democratic | Brad Sherman (incumbent) | 240,038 | 69.5 | |
| Republican | Mark S. Reed | 105,426 | 30.5 | |
| Total votes | 345,464 | 100.0 | ||
| Democratic hold | ||||
Historical district boundaries[]
Before the 2013 redistricting resulting from the 2010 United States Census and the 2012 elections, the western Los Angeles County district was represented by Democrat Henry A. Waxman. From 2003 to 2013 the district included many of the cities and suburbs of western Greater Los Angeles, most notably Hollywood, West Hollywood, Beverly Hills, Santa Monica, Pacific Palisades, Malibu and Topanga, Calabasas, Agoura Hills, Woodland Hills.
See also[]
References[]
- ^ US Census
- ^ "Introducing the 2021 Cook Political Report Partisan Voter Index". The Cook Political Report. April 15, 2021. Retrieved April 15, 2021.
- ^ Merl, Jean (November 7, 2012). "Brad Sherman wins 30th Congressional District seat in Valley - latimes.com". Los Angeles Times. Retrieved November 9, 2012.
- ^ Statement of Vote (1990 Governor)
- ^ Statement of Vote (1992 President)
- ^ Statement of Vote (1992 Senate)
- ^ Statement of Vote (1992 Senate)
- ^ Statement of Vote (1994 Governor)
- ^ Statement of Vote (1994 Senate)
- ^ Statement of Vote (1996 President)
- ^ Statement of Vote (1998 Governor) Archived September 29, 2011, at the Wayback Machine
- ^ Statement of Vote (1998 Senate) Archived September 29, 2011, at the Wayback Machine
- ^ Statement of Vote (2000 President)
- ^ Statement of Vote (2000 Senator)
- ^ Statement of Vote (2002 Governor)
- ^ Statement of Vote (2003 Recall Question)
- ^ Statement of Vote (2003 Governor)
- ^ Statement of Vote (2004 President)
- ^ Statement of Vote (2004 Senator)
- ^ Statement of Vote (2006 Governor)
- ^ Statement of Vote (2006 Senator)
- ^ Statement of Vote (2008 President)
- ^ Statement of Vote (2010 Governor)
- ^ Statement of Vote (2010 Senator)
- ^ Statement of Vote (2012 President)
- ^ Statement of Vote (2012 Senator)
- ^ Statement of Vote (2014 Governor)
- ^ Statement of Vote (2016 President)
- ^ Statement of Vote (2016 Senator)
- ^ Statement of Vote (2018 Governor)
- ^ Statement of Vote (2018 Senator)
- ^ https://www.dailykos.com/stories/2012/11/19/1163009/-Daily-Kos-Elections-presidential-results-by-congressional-district-for-the-2012-2008-elections
- ^ 1952 election results
- ^ 1954 election results
- ^ 1956 election results
- ^ 1958 election results
- ^ 1960 election results
- ^ 1962 election results
- ^ 1964 election results
- ^ 1966 election results
- ^ 1968 election results
- ^ 1970 election results
- ^ 1972 election results
- ^ 1974 election results
- ^ 1976 election results
- ^ 1978 election results
- ^ 1980 election results
- ^ 1982 special election results
- ^ 1982 election results
- ^ 1984 election results
- ^ 1986 election results
- ^ 1988 election results
- ^ 1990 election results
- ^ 1992 election results
- ^ 1994 election results
- ^ 1996 election results
- ^ 1998 election results
- ^ 2000 election results
- ^ 2002 election results
- ^ 2004 election results
- ^ 2006 election results
- ^ 2008 election results
- ^ 2010 election results
- ^ 2012 election results
- ^ 2014 election results
- ^ 2016 election results
- ^ 2018 election results
External links[]
- GovTrack.us: Map of California's 30th congressional district
- GovTrack.us: Brad Sherman, U.S. Representative for California's 30th Congressional District
- California Voter Foundation map: 30th Congressional District—CD30
| Authority control |
|
|---|
Coordinates: 34°12′07″N 118°32′49″W / 34.20194°N 118.54694°W

- Congressional districts of California
- Government of Los Angeles County, California
- Government of Ventura County, California
- San Fernando Valley
- Simi Hills
- Canoga Park, Los Angeles
- Chatsworth, Los Angeles
- Encino, Los Angeles
- Granada Hills, Los Angeles
- Hidden Hills, California
- Hollywood Hills
- Los Angeles River
- Reseda, Los Angeles
- Sherman Oaks, Los Angeles
- Studio City, Los Angeles
- Tarzana, Los Angeles
- West Hills, Los Angeles
- Winnetka, Los Angeles
- Woodland Hills, Los Angeles
- Constituencies established in 1953
- 1953 establishments in California