U.S. House district for California
Coordinates : 37°48′N 122°15′W / 37.8°N 122.25°W / 37.8; -122.25
California's 13th congressional district California's 13th congressional district—since January 3, 2013
Representative Population (2019) 768,889 Median household $91,514[1] Ethnicity Cook PVI D+40[2]
California's 13th congressional district is a congressional district in the U.S. state of California . Barbara Lee , a Democrat , has represented this district since January 2013.
Currently, the 13th district consists of the northwestern portion of Alameda County . Cities in the district include Alameda , Albany , Berkeley , Emeryville , Oakland , Piedmont , and San Leandro .[3] Cook Partisan Voting Index rating of D+40, it is the most Democratic district in California.[2]
Prior to redistricting by the California Citizens Redistricting Commission of 2011, the 13th district was in southwestern Alameda County, anchored by Hayward and Fremont .
Recent election results from statewide races [ ]
Year
Office
Results
1992
President
Clinton 54.4 - 25.6%
Senator
Boxer 58.0 - 31.4%
Senator
Feinstein 66.1 - 26.9%
1994
Governor [4] Brown 51.0 - 44.7%
Senator [5] Feinstein 59.3 - 32.8%
1996
President [6] Clinton 62.3- 27.5%
1998
Governor [7] Davis 68.9 - 27.7%
Senator [8] Boxer 63.0 - 33.5%
2000
President [9] Gore 66.4 - 29.6%
Senator [10] Feinstein 66.9 - 27.3%
2002
Governor [11] Davis 62.8 - 26.7%
2003
Recall [12] [13] No 63.2 - 36.8%
Bustamante 46.8 - 31.5%
2004
President [14] Kerry 70.9 - 28.0%
Senator [15] Boxer 72.8 - 23.2%
2006
Governor [16] Angelides 52.1 - 42.4%
Senator [17] Feinstein 75.0 - 20.0%
2008
President [18] Obama 74.4 - 23.8%
2010
Governor
Brown 68.7 - 27.4%
Senator
Boxer 69.4 - 25.9%
2012
President
Obama 87.5 - 9.0%
Senator
Feinstein 90.9 - 9.1%
2014
Governor
Brown 91.2 - 8.8%
2016
President
Clinton 87.4 - 6.8%
Senator
Harris 80.9 - 19.1%
2018
Governor
Newsom 90.2 - 9.8%
Senator
Feinstein 58.9 - 41.1%
2020
President
Biden 88.9 - 9.0%
List of members representing the district [ ]
Member
Party
Dates
Cong
Electoral history
Counties
District created on March 4, 1933
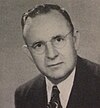
Charles Kramer Democratic
March 4, 1933 –
73rd 74th 75th 76th 77th
Elected in 1932 .Re-elected in 1934 .Re-elected in 1936 .Re-elected in 1938 .Re-elected in 1940 .1933–1943 [data unknown/missing
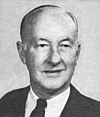
Norris Poulson Republican
January 3, 1943 –
78th
Elected in 1942 .1943–1953 [data unknown/missing
Ned R. Healy Democratic
January 3, 1945 –
79th
Elected in 1944 .
Norris Poulson Republican
January 3, 1947 –
80th 81st 82nd
Elected in 1946 .Re-elected in 1948 .Re-elected in 1950 .24th district
Ernest K. Bramblett Republican
January 3, 1953 –
83rd
Redistricted from the 11th district re-elected in 1952 .
1953–1963 Monterey , San Luis Obispo , Santa Barbara , Ventura
Charles M. Teague Republican
January 3, 1955 –
84th 85th 86th 87th 88th 89th 90th 91st 92nd 93rd
Elected in 1954 .Re-elected in 1956 .Re-elected in 1958 .Re-elected in 1960 .Re-elected in 1962 .Re-elected in 1964 .Re-elected in 1966 .Re-elected in 1968 .Re-elected in 1970 .Re-elected in 1972 .
1963–1967 Santa Barbara , Ventura
1967–1973 Los Angeles , Santa Barbara , Ventura
1973–1975 Santa Barbara and Ventura
Vacant
January 1, 1974 –
93rd
Robert J. Lagomarsino Republican
March 5, 1974 –
Elected to finish Teague's term .19th district
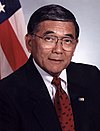
Norman Mineta Democratic
January 3, 1975 –
94th 95th 96th 97th 98th 99th 100th 101st 102nd
Elected in 1974 .Re-elected in 1976 .Re-elected in 1978 .Re-elected in 1980 .Re-elected in 1982 .Re-elected in 1984 .Re-elected in 1986 .Re-elected in 1988 .Re-elected in 1990 .15th district 1975–1983 Santa Clara
1983–1993 Santa Clara (western San Jose )
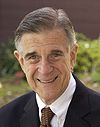
Pete Stark Democratic
January 3, 1993 –
103rd 104th 105th 106th 107th 108th 109th 110th 111th 112th
Redistricted from the 9th district re-elected in 1992 .Re-elected in 1994 .Re-elected in 1996 .Re-elected in 1998 .Re-elected in 2000 .Re-elected in 2002 .Re-elected in 2004 .Re-elected in 2006 .Re-elected in 2008 .Re-elected in 2010 .15th district
1993–2003 Alameda , small part of northern Santa Clara
2003–2013 Alameda
Barbara Lee Democratic
January 3, 2013 –
113th 114th 115th 116th 117th
Redistricted from the 9th district re-elected in 2012 .Re-elected in 2014 .Re-elected in 2016 .Re-elected in 2018 .Re-elected in 2020 .12th district
2013–present Alameda
Election results [ ] 1932 [ ] 1934 [ ] 1936 [ ] 1938 [ ] 1940 [ ] 1942 [ ] 1944 [ ] 1946 [ ] 1948 [ ] 1950 [ ] 1952 [ ] 1954 [ ] 1956 [ ] 1958 [ ] 1960 [ ] 1962 [ ] 1964 [ ] 1966 [ ] 1968 [ ] 1970 [ ] 1972 [ ] 1974 (Special) [ ] 1974 [ ] 1976 [ ] 1978 [ ] 1980 [ ] 1982 [ ] 1984 [ ] 1986 [ ] 1988 [ ] 1990 [ ] 1992 [ ] 1994 [ ] 1996 [ ] 1998 [ ] 2000 [ ] 2002 [ ] 2004 [ ] 2006 [ ] 2008 [ ] 2010 [ ] 2012 [ ] 2014 [ ] 2016 [ ] 2018 [ ] 2020 [ ] See also [ ]
United States portal California portal San Francisco Bay Area portal
References [ ]
^ "My Congressional District" .^ a b "Introducing the 2021 Cook Political Report Partisan Voter Index" . The Cook Political Report. April 15, 2021. Retrieved April 15, 2021 .^ "Maps: Final Congressional Districts" . Citizens Redistricting Commission. Archived from the original on March 10, 2013. Retrieved February 25, 2013 .^ https://elections.cdn.sos.ca.gov/sov/1994-general/ssov/governor-congress-district.pdf ^ https://elections.cdn.sos.ca.gov/sov/1994-general/ssov/us-senate-congress-district.pdf ^ https://elections.cdn.sos.ca.gov/sov/1996-general/ssov/president-congress-district.pdf ^ (PDF) . September 29, 2011 https://web.archive.org/web/20110929224728/http://www.sos.ca.gov/elections/sov/1998-general/ssov/gov-cd.pdf# . Archived from the original (PDF) on September 29, 2011. ^ (PDF) . September 29, 2011 https://web.archive.org/web/20110929224732/http://www.sos.ca.gov/elections/sov/1998-general/ssov/sen-cd.pdf# . Archived from the original (PDF) on September 29, 2011. ^ "Statement of Vote (2000 President)" (PDF) . Archived from the original (PDF) on June 11, 2007. Retrieved September 17, 2008 .^ "Statement of Vote (2000 Senator)" (PDF) . Archived from the original (PDF) on June 11, 2007. Retrieved September 17, 2008 .^ "Statement of Vote (2002 Governor)" (PDF) . Archived from the original (PDF) on November 11, 2010.^ "Statement of Vote (2003 Recall Question)" (PDF) . Archived from the original (PDF) on May 20, 2011. Retrieved October 8, 2007 .^ "Statement of Vote (2003 Governor)" (PDF) . Archived from the original (PDF) on May 20, 2011. Retrieved October 8, 2007 .^ "Statement of Vote (2004 President)" (PDF) . Archived from the original (PDF) on August 1, 2010. Retrieved August 8, 2007 .^ "Statement of Vote (2004 Senator)" (PDF) . Archived from the original (PDF) on August 10, 2011.^ "Statement of Vote (2006 Governor)" (PDF) . Archived from the original (PDF) on August 10, 2011.^ "Statement of Vote (2006 Senator)" (PDF) . Archived from the original (PDF) on August 10, 2011.^ "(2008 President)" . Archived from the original on February 11, 2009. Retrieved March 5, 2009 .^ "1932 election results" (PDF) .^ "1934 election results" (PDF) .^ "1936 election results" (PDF) .^ "1938 election results" (PDF) .^ "1940 election results" (PDF) .^ "1942 election results" (PDF) .^ "1944 election results" (PDF) .^ "1946 election results" (PDF) .^ "1948 election results" (PDF) .^ "1950 election results" (PDF) .^ "1952 election results" (PDF) .^ "1954 election results" (PDF) .^ "1956 election results" (PDF) .^ "1958 election results" (PDF) .^ "1960 election results" (PDF) .^ "1962 election results" (PDF) .^ "1964 election results" (PDF) .^ "1966 election results" (PDF) .^ "1968 election results" (PDF) .^ "1970 election results" (PDF) .^ "1972 election results" (PDF) .^ "JoinCalifornia - 03-05-1974 Election" . www.joincalifornia.com .^ "1974 election results" (PDF) .^ "1976 election results" (PDF) .^ "1978 election results" (PDF) .^ "1980 election results" (PDF) .^ "1982 election results" (PDF) .^ "1984 election results" (PDF) .^ "1986 election results" (PDF) .^ "1988 election results" (PDF) .^ "1990 election results" (PDF) .^ "1992 election results" (PDF) .^ "1994 election results" (PDF) .^ "1996 election results" (PDF) .^ "1998 election results" (PDF) .^ "2000 election results" (PDF) .^ "2002 general election results" (PDF) . Archived from the original (PDF) on February 3, 2009.^ "2004 general election results" (PDF) . Archived from the original (PDF) on August 21, 2008.^ "2006 general election results" (PDF) . Archived from the original (PDF) on November 27, 2008.^ "2008 general election results" (PDF) . Archived from the original (PDF) on October 18, 2012. Retrieved January 5, 2009 .^ "2010 general election results" (PDF) . Archived from the original (PDF) on June 11, 2014. Retrieved March 24, 2011 .^ a b "2012 general election results" (PDF) . Archived from the original (PDF) on October 19, 2013.
External links [ ]
The at-large seats only existed from 1850 to 1865 and from 1883 to 1885. See also
California's past and present representatives , senators , and delegations