2020 United States presidential election in California
| ||||||||||||||||||||||||||
| Turnout | 80.67% (of registered voters) 70.88% (of eligible voters) | |||||||||||||||||||||||||
|---|---|---|---|---|---|---|---|---|---|---|---|---|---|---|---|---|---|---|---|---|---|---|---|---|---|---|
| ||||||||||||||||||||||||||
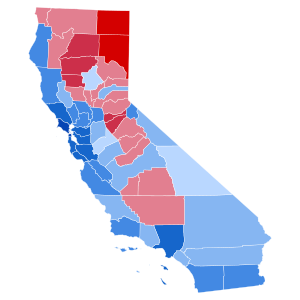 County results
| ||||||||||||||||||||||||||
| ||||||||||||||||||||||||||

| Elections in California |
|---|
 |
|
show |
|
show |
|
show |
|
show |
|
show |
|
show |
|
show |
|
show |
|
show |
|
show |
|
show |
|
show |
|
show |
|
show |
|
show |
|
show |
The 2020 United States presidential election in California was held on Tuesday, November 3, 2020, as part of the 2020 United States presidential election in which all 50 states plus the District of Columbia participated.[2] California voters chose electors to represent them in the Electoral College via a popular vote, pitting the Republican Party's nominee, incumbent President Donald Trump, and running mate Vice President Mike Pence against Democratic Party nominee, former Vice President Joe Biden, and his running mate Kamala Harris, the junior senator from California. California has 55 electoral votes in the Electoral College, the most of any state.[3] Prior to the election, most news organizations considered California a strongly Democratic state, or a safe blue state. It has voted Democratic in every presidential election from 1992 onward. California was one of six states where Trump received more percentage of the two-party vote than he did in 2016, and this election marked the first time since 2004 that the Republican candidate won more than one million votes in Los Angeles County.[a]
Biden carried California with 63.5% of the vote and a margin of 29.2% over Trump. Biden earned the highest percentage of the vote in the state for any candidate since Franklin D. Roosevelt in 1936, although Biden's margin of victory was slightly smaller than Hillary Clinton's 30.1% in 2016. Biden became the first candidate in any race for any office in U.S. history to win more than 10 million votes in a single state, while Trump also received the most votes a Republican has ever received in any state in any race since the country's founding, even narrowly besting his vote total in Texas, a state that he won.[4] Biden's vote margin was the largest vote margin for a presidential candidate in a singular state.
Per exit polls by Edison Research, Biden dominated key Democratic constituencies in the state including Latinos with 75%, African Americans with 82%, Asian Americans with 76%, and union households with 63%.[5] Post-election analysis by Cook Political Report showed Trump made inroads with some Asian American constituencies, particularly Vietnamese American voters in Orange County.[6]
Biden flipped Butte County and Inyo County into the Democratic column, which had not voted Democrat since 2008 and 1964, respectively. Biden's victory in Orange County was only the second time a Democrat carried the county since 1936. In contrast, while he improved his total vote share by nearly three percentage points, Trump did not flip any counties and his main regions of strength came from Republican strongholds in Gold Country, Northern California, and the Central Valley. California Secretary of State Alex Padilla certified the results on December 4, and took Harris' seat in the Senate upon her resignation to become Vice President, having been appointed by Governor Gavin Newsom.[7]
California was one of five states in the nation in which Biden's victory margin was larger than 1 million raw votes, the others being New York, Maryland, Massachusetts and Illinois.
Primary elections[]
In a departure from previous election cycles, California held its primaries on Super Tuesday, March 3, 2020.[8] Early voting began several weeks earlier.
Donald Trump secured the Republican nomination on March 17, 2020, defeating several longshot candidates, most notably former Massachusetts Governor Bill Weld. Kamala Harris, the state's junior U.S. senator, was among the Democratic candidates declared until she dropped out on December 3, 2019. Representative Eric Swalwell from the 15th district was also a Democratic candidate but dropped out of the race on July 8, 2019. Other prominent state figures, including former Governor Jerry Brown, current Governor Gavin Newsom, and Los Angeles Mayor Eric Garcetti declined to run.[9][10][11]
Republican primary[]
The Republican Party's primary campaign was dominated by a lawsuit over the President's taxes.[12] The suit alleges that the new requirement for several years of a candidate's taxes was unconstitutional and onerous. The law was blocked in September 2019 while State Supreme court heard testimony and made a ruling.[13]
As a contingency, the Republican state committee changed its delegate selection process, turning the primary into a mere "beauty contest" and setting up an emergency state convention to Trump's delegate choices.[14] If Trump were allowed on the ballot, the convention would be canceled and the so-called "winner-take-most" rules, which require a challenger to get 20% of the vote, would apply.
President Trump was allowed on the ballot, and the contingency convention was canceled.
| Candidate | Votes | % | Estimated delegates |
|---|---|---|---|
| Donald Trump | 2,279,120 | 92.2% | 172 |
| Bill Weld | 66,904 | 2.7% | |
| Joe Walsh (withdrawn) | 64,749 | 2.6% | |
| Rocky De La Fuente | 24,351 | 1.0% | |
| Matthew John Matern | 15,469 | 0.6% | |
| Robert Ardini | 12,857 | 0.5% | |
| Zoltan Istvan | 8,141 | 0.3% | |
| Total | 2,471,591 | 100% |
Democratic primary[]
Candidates began filing their paperwork on November 4, 2019, and the final list was announced on December 9.
Leading California Democrats complained that Joe Biden and Senator Elizabeth Warren were snubbing the state by refusing to attend a forum at the State's "endorsement convention".[16] Early voting began on February 11 and ended the day before primary day.


| 2020 California Democratic presidential primary[17][18] | |||
|---|---|---|---|
| Candidate | Votes | % | Delegates |
| Bernie Sanders | 2,080,846 | 35.97 | 225 |
| Joe Biden | 1,613,854 | 27.90 | 172 |
| Elizabeth Warren | 762,555 | 13.18 | 11 |
| Michael Bloomberg | 701,803 | 12.13 | 7 |
| Pete Buttigieg (withdrawn)[b] | 249,256 | 4.31 | 0 |
| Amy Klobuchar (withdrawn)[b] | 126,961 | 2.19 | 0 |
| Tom Steyer (withdrawn)[b] | 113,092 | 1.96 | 0 |
| Andrew Yang (withdrawn) | 43,571 | 0.75 | 0 |
| Tulsi Gabbard | 33,769 | 0.58 | 0 |
| Julian Castro (withdrawn) | 13,892 | 0.24 | 0 |
| Michael Bennet (withdrawn) | 7,377 | 0.13 | 0 |
| Marianne Williamson (withdrawn) | 7,052 | 0.12 | 0 |
| Rocky De La Fuente | 6,151 | 0.11 | 0 |
| Cory Booker (withdrawn) | 6,000 | 0.10 | 0 |
| John Delaney (withdrawn) | 4,606 | 0.08 | 0 |
| Michael Ellinger | 3,424 | 0.06 | 0 |
| Joe Sestak (withdrawn) | 3,270 | 0.06 | 0 |
| Mark Greenstein | 3,190 | 0.06 | 0 |
| Deval Patrick (withdrawn) | 2,022 | 0.03 | 0 |
| Mosie Boyd | 1,639 | 0.03 | 0 |
| Robert Jordan (write-in) | 20 | 0.00 | 0 |
| Daphne Bradford (write-in) | 8 | 0.00 | 0 |
| Nakia Anthony (write-in) | 3 | 0.00 | 0 |
| Willie Carter (write-in) | 3 | 0.00 | 0 |
| Michael Dename (write-in) | 0 | 0.00 | 0 |
| Jeffrey Drobman (write-in) | 0 | 0.00 | 0 |
| Heather Stagg (write-in) | 0 | 0.00 | 0 |
| Total votes | 5,784,364 | 100% | 415 |
| District | Bernie Sanders | Joe Biden | Michael Bloomberg | Elizabeth Warren | Total delegates | District Region | Largest City | ||||
|---|---|---|---|---|---|---|---|---|---|---|---|
| 1st | 34% | 2 | 23.7% | 2 | 10.3% | 0 | 12.9% | 0 | 4 | Shasta Cascade | Chico, Redding |
| 2nd | 33.3% | 3 | 25.3% | 2 | 13.5% | 0 | 15.9% | 1 | 6 | North Coast | Eureka |
| 3rd | 34.3% | 3 | 29.3% | 2 | 12% | 0 | 12% | 0 | 5 | Sacramento Valley | Fairfield |
| 4th | 26.1% | 2 | 29.6% | 3 | 14.7% | 0 | 11.4% | 0 | 5 | Sierras | Roseville |
| 5th | 32.7% | 3 | 27.2% | 3 | 14.9% | 0 | 12.6% | 0 | 6 | Wine Country | Santa Rosa |
| 6th | 35.8% | 3 | 28.1% | 2 | 10.7% | 0 | 14.3% | 0 | 5 | Sacramento Valley | Sacramento |
| 7th | 30.9% | 2 | 31.4% | 3 | 13% | 0 | 11.2% | 0 | 5 | Sacramento Valley | Elk Grove |
| 8th | 35.7% | 2 | 31.2% | 2 | 11.8% | 0 | 8.8% | 0 | 4 | Eastern Desert | Victorville |
| 9th | 32.9% | 2 | 32.5% | 2 | 15.9% | 1 | 7% | 0 | 5 | San Joaquin Valley | Stockton |
| 10th | 35.5% | 2 | 29.1% | 1 | 15.3% | 1 | 7.2% | 0 | 4 | San Joaquin Valley | Modesto |
| 11th | 29% | 2 | 30.7% | 3 | 15.3% | 1 | 14.7% | 0 | 6 | Bay Area | Concord |
| 12th | 33.8% | 3 | 23.9% | 2 | 11% | 0 | 23.4% | 2 | 7 | San Francisco Bay Area | SF |
| 13th | 38.7% | 3 | 22.4% | 2 | 8.1% | 0 | 24.7% | 2 | 7 | Bay Area | Oakland |
| 14th | 31.9% | 3 | 26.4% | 2 | 15.6% | 1 | 14.8% | 0 | 6 | Bay Area | Daly City |
| 15th | 34.1% | 3 | 29.5% | 3 | 14.4% | 0 | 11.5% | 0 | 6 | Bay Area | Hayward |
| 16th | 40.9% | 3 | 26.2% | 1 | 12.6% | 0 | 7.2% | 0 | 4 | San Joaquin Valley | Fresno, Merced |
| 17th | 36.1% | 3 | 25.9% | 2 | 14.3% | 0 | 12.5% | 0 | 5 | Bay Area | Fremont, Santa Clara |
| 18th | 26.6% | 2 | 29% | 2 | 15.4% | 1 | 17.1% | 1 | 6 | Bay Area | Sunnyvale |
| 19th | 38.9% | 4 | 25.9% | 2 | 13.6% | 0 | 10.7% | 0 | 6 | Bay Area | San Jose |
| 20th | 39.8% | 3 | 25.5% | 2 | 10.9% | 0 | 13% | 0 | 5 | Central Coast | Salinas |
| 21st | 43.2% | 3 | 25.3% | 1 | 13.7% | 0 | 5.1% | 0 | 4 | San Joaquin Valley | Kings, Kern, SW Fresno |
| 22nd | 34.4% | 2 | 29.1% | 2 | 13% | 0 | 8.8% | 0 | 4 | San Joaquin Valley | Visalia |
| 23rd | 34.9% | 2 | 30.2% | 2 | 12.2% | 0 | 9% | 0 | 4 | South Central California | Bakersfield |
| 24th | 35.3% | 3 | 26.8% | 2 | 10.5% | 0 | 14.7% | 0 | 5 | Central Coast | Santa Maria |
| 25th | 35.6% | 3 | 33.6% | 2 | 10% | 0 | 10% | 0 | 5 | LA County | Santa Clarita |
| 26th | 34.4% | 3 | 31.1% | 2 | 12.1% | 0 | 11.5% | 0 | 5 | Central Coast | Oxnard |
| 27th | 35.9% | 2 | 29.2% | 2 | 10.2% | 0 | 15.7% | 1 | 5 | LA County | San Gabriel Valley |
| 28th | 40% | 3 | 22.7% | 2 | 7.5% | 0 | 21.7% | 1 | 6 | LA County | Glendale |
| 29th | 49.8% | 3 | 21.5% | 2 | 7.7% | 0 | 11.2% | 0 | 5 | LA County | San Fernando Valley |
| 30th | 32.6% | 3 | 31.2% | 2 | 11.2% | 0 | 15.4% | 1 | 6 | LA County | San Fernando Valley |
| 31st | 39.1% | 3 | 32.3% | 2 | 11% | 0 | 8.3% | 0 | 5 | Southern California | San Bernardino |
| 32nd | 44.7% | 3 | 28.2% | 2 | 10.5% | 0 | 7.5% | 0 | 5 | LA County | El Monte |
| 33rd | 26.2% | 2 | 34.2% | 3 | 14.3% | 0 | 16.1% | 1 | 6 | LA County | Santa Monica, Coastal LA |
| 34th | 53.7% | 4 | 16.8% | 1 | 8.1% | 0 | 14.7% | 0 | 5 | LA County | Downtown Los Angeles |
| 35th | 46.6% | 2 | 28.2% | 2 | 10.9% | 0 | 6.2% | 0 | 4 | Southern California | Fontana |
| 36th | 27.5% | 1 | 29.8% | 2 | 15.4% | 1 | 8.1% | 0 | 4 | Eastern Desert | Indio |
| 37th | 35.6% | 3 | 31.3% | 2 | 10.1% | 0 | 16.2% | 1 | 6 | LA County | West LA |
| 38th | 41.7% | 3 | 30.8% | 2 | 10.5% | 0 | 7.6% | 0 | 5 | LA County | Norwalk |
| 39th | 36.7% | 3 | 30.5% | 2 | 12.6% | 0 | 9.6% | 0 | 5 | Southern California | Fullerton |
| 40th | 56.4% | 4 | 20.9% | 1 | 8.9% | 0 | 5.4% | 0 | 5 | LA County | East Los Angeles |
| 41st | 45% | 3 | 27.9% | 2 | 10.7% | 0 | 7.5% | 0 | 5 | Southern California | Riverside |
| 42nd | 37% | 3 | 31.6% | 2 | 12.4% | 0 | 7.9% | 0 | 5 | Southern California | Corona |
| 43rd | 36.5% | 3 | 34.3% | 2 | 10% | 0 | 10.3% | 0 | 5 | LA County | Inglewood |
| 44th | 44% | 3 | 29.6% | 2 | 6.2% | 0 | 9.6% | 0 | 5 | Los Angeles County | Compton |
| 45th | 34% | 3 | 29.1% | 2 | 13.5% | 0 | 12% | 0 | 5 | Southern California | Irvine |
| 46th | 53.7% | 2 | 20% | 2 | 10.5% | 0 | 7.7% | 0 | 4 | Southern California | Anaheim |
| 47th | 38.5% | 3 | 27.3% | 2 | 10.6% | 0 | 12.2% | 0 | 5 | Southern California | Long Beach |
| 48th | 30.4% | 2 | 30.3% | 2 | 16.3% | 1 | 11% | 0 | 5 | Southern California | Huntington Beach |
| 49th | 30.6% | 3 | 30.5% | 2 | 14.6% | 0 | 12.2% | 0 | 5 | Southern California | Oceanside |
| 50th | 34.9% | 2 | 27.6% | 2 | 13% | 0 | 11.3% | 0 | 4 | Southern California | Escondido |
| 51st | 49.2% | 3 | 23.7% | 2 | 11.3% | 0 | 6.8% | 0 | 5 | Southern California | Downtown San Diego and Border Communities |
| 52nd | 30.6% | 3 | 30% | 3 | 13.4% | 0 | 14.6% | 0 | 6 | Southern California | North San Diego |
| 53rd | 37.8% | 3 | 27.3% | 3 | 10.1% | 0 | 14.5% | 0 | 6 | Southern California | Eastern San Diego and suburbs |
| Total | 36.0% | 144 | 27.9% | 109 | 12.1% | 7 | 13.2% | 11 | 271 | ||
| Delegate type | Bernie Sanders | Joe Biden | Michael Bloomberg | Elizabeth Warren |
|---|---|---|---|---|
| At-large | 51 | 39 | 0 | 0 |
| PLEO | 30 | 24 | 0 | 0 |
| District-level | 144 | 109 | 7 | 11 |
| Total | 225 | 172 | 7 | 11 |
Libertarian primary[]
| |||||||||||||||||||||||||||||||||||||||||||||||||||||||||||||||||||||
| |||||||||||||||||||||||||||||||||||||||||||||||||||||||||||||||||||||
 Election results by county
| |||||||||||||||||||||||||||||||||||||||||||||||||||||||||||||||||||||


The Libertarian Party of California permitted non-affiliated voters to vote in their presidential primary.[21]
| Party | Candidate | Votes | % | |
|---|---|---|---|---|
| Libertarian | Jacob Hornberger | 5,530 | 19.4 | |
| Libertarian | Jo Jorgensen | 3,534 | 12.4 | |
| Libertarian | Vermin Supreme | 3,469 | 12.2 | |
| Libertarian | Ken Armstrong | 3,011 | 10.6 | |
| Libertarian | Kim Ruff (withdrawn) | 2,330 | 8.2 | |
| Libertarian | Adam Kokesh | 2,161 | 7.6 | |
| Libertarian | Sam Robb | 1,722 | 6.0 | |
| Libertarian | Dan Behrman | 1,695 | 5.9 | |
| Libertarian | Max Abramson | 1,605 | 5.6 | |
| Libertarian | Souraya Faas | 999 | 3.5 | |
| Libertarian | Steve Richey | 982 | 3.4 | |
| Libertarian | Erik Gerhardt | 748 | 2.6 | |
| Libertarian | Keenan Wallace Dunham | 720 | 2.5 | |
| Libertarian | Sorinne Ardeleanu (write-in) | 27 | 0.1 | |
| Libertarian | Geby Eva Espínosa (write-in) | 2 | 0.0 | |
| Libertarian | Nicholas D'Artagnan Dumas (write-in) | 0 | 0.0 | |
| Libertarian | James Orlando Ogle (write-in) | 0 | 0.0 | |
| Total votes | 28,535 | 100% | ||
Green primary[]
| 2020 California Green primary[23] | |||
|---|---|---|---|
| Candidate | Votes | Percentage | National delegates |
| Howie Hawkins | 4,202 | 36.2% | 16 estimated |
| Dario Hunter | 2,558 | 22.0% | 9 estimated |
| Sedinam Moyowasifza-Curry | 2,071 | 17.8% | 8 estimated |
| Dennis Lambert | 1,999 | 17.2% | 7 estimated |
| David Rolde | 774 | 6.7% | 3 estimated |
| Total | 9,656 | 100.00% | 43 |
American Independent primary[]
The American Independent Party permitted non-affiliated voters to vote in their presidential primary.[21]
| Party | Candidate | Votes | % | |
|---|---|---|---|---|
| American Independent | Phil Collins | 11,532 | 32.8 | |
| American Independent | Roque "Rocky" De La Fuente | 7,263 | 21.0 | |
| American Independent | Don Blankenship | 6,913 | 19.7 | |
| American Independent | J. R. Myers | 5,099 | 14.5 | |
| American Independent | Charles Kraut | 4,216 | 12.0 | |
| Total votes | 35,723 | 100% | ||
Peace and Freedom primary[]
| Party | Candidate | Votes | % | |
|---|---|---|---|---|
| Peace and Freedom | Gloria La Riva | 2,570 | 66.0 | |
| Peace and Freedom | Howie Hawkins | 1,325 | 34.0 | |
| Total votes | 3,895 | 100% | ||
General election[]
Final predictions[]
| Source | Ranking |
|---|---|
| The Cook Political Report[26] | Solid D |
| Inside Elections[27] | Solid D |
| Sabato's Crystal Ball[28] | Safe D |
| Politico[29] | Solid D |
| RCP[30] | Solid D |
| Niskanen[31] | Safe D |
| CNN[32] | Solid D |
| The Economist[33] | Safe D |
| CBS News[34] | Likely D |
| 270towin[35] | Safe D |
| ABC News[36] | Solid D |
| NPR[37] | Likely D |
| NBC News[38] | Solid D |
| 538[39] | Solid D |
Polling[]
- Graphical summary
Aggregate polls[]
| Source of poll aggregation |
Dates administered |
Dates updated |
Joe Biden Democratic |
Donald Trump Republican |
Other/ Undecided [c] |
Margin |
|---|---|---|---|---|---|---|
| 270 to Win | October 17–27, 2020 | November 3, 2020 | 61.7% | 32.3% | 6.0% | Biden +29.4 |
| Real Clear Politics | September 26 – October 21, 2020 | October 27, 2020 | 60.7% | 31.0% | 8.3% | Biden +29.7 |
| FiveThirtyEight | until November 2, 2020 | November 3, 2020 | 61.6% | 32.4% | 6.0% | Biden +29.2 |
| Average | 61.3% | 31.9% | 6.8% | Biden +29.4 | ||
Polls[]
| Poll source | Date(s) administered |
Sample size[d] |
Margin of error |
Donald Trump Republican |
Joe Biden Democratic |
Jo Jorgensen Libertarian |
Howie Hawkins Green |
Other | Undecided |
|---|---|---|---|---|---|---|---|---|---|
| SurveyMonkey/Axios | Oct 20 – Nov 2, 2021 | 12,370 (LV) | ± 1.5% | 36%[e] | 62% | – | – | – | – |
| David Binder Research | Oct 28 – Nov 1, 2020 | 800 (LV) | – | 31% | 62% | – | – | 3% | 4% |
| USC Schwarzenegger Institute | Oct 27–31, 2020 | 1,155 (RV) | ± 3% | 28% | 65% | – | – | 4%[f] | 2% |
| SurveyMonkey/Tableau | Sep 30 – Oct 28, 2020 | 22,450 (LV) | – | 37%[e] | 61% | – | – | – | – |
| Swayable | Oct 23–26, 2020 | 635 (LV) | ± 5.2% | 35% | 62% | 2% | 1% | – | – |
| UC Berkeley/LA Times[1] | Oct 16–21, 2020 | 5,352 (LV) | ± 2% | 29% | 65% | 1% | 0% | 0%[g][h] | 3% |
| Public Policy Institute of California | Oct 9–18, 2020 | 1,185 (LV) | ± 4.3% | 32% | 58% | 3% | 2% | 1%[i] | 4% |
| SurveyMonkey/Tableau | Sep 1–30, 2020 | 20,346 (LV) | – | 35% | 63% | – | – | – | 2% |
| SurveyUSA | Sep 26–28, 2020 | 588 (LV) | ± 5.4% | 34% | 59% | – | – | 3%[j] | 6% |
| Redfield & Wilton Strategies | Sep 19–21, 2020 | 1,775 (LV) | – | 28% | 62% | 1% | 1% | 1%[k] | 8% |
| UC Berkeley/LA Times[2] | Sep 9–15, 2020 | 5,942 (LV) | ± 2% | 28% | 67% | 1% | 0% | 0%[g][h] | 3% |
| Public Policy Institute of California | Sep 4–13, 2020 | 1,168 (LV) | ± 4.3% | 31% | 60% | 3% | 2% | 1%[i] | 2% |
| Spry Strategies/Women's Liberation Front Archived September 27, 2020, at the Wayback Machine | Aug 29 – Sep 1, 2020 | 600 (LV) | ± 4% | 39% | 56% | – | – | – | 5% |
| SurveyMonkey/Tableau | Aug 1–31, 2020 | 17,537 (LV) | – | 35% | 63% | – | – | – | 2% |
| David Binder Research | Aug 22–24, 2020 | 800 (LV) | – | 31% | 61% | – | – | 3%[l] | 5% |
| Redfield and Wilton Strategies | Aug 9, 2020 | 1,904 (LV) | ± 2.3% | 25% | 61% | 1% | 1% | 2%[m] | 9% |
| SurveyMonkey/Tableau | Jul 1–31, 2020 | 19,027 (LV) | – | 35% | 63% | – | – | – | 2% |
| University of California Berkeley[3] | Jul 21–27, 2020 | 6,756 (LV) | ± 2.0% | 28% | 67% | – | – | – | 5% |
| SurveyMonkey/Tableau | Jun 8–30, 2020 | 8,412 (LV) | – | 36% | 62% | – | – | – | 2% |
| Public Policy Institute of California | May 19–26, 2020 | 1,048 (LV) | ± 4.6% | 33% | 57% | – | – | 6%[n] | 3% |
| SurveyUSA | May 18–19, 2020 | 537 (LV) | ± 5.4% | 30% | 58% | – | – | 5% | 7% |
| Emerson College | May 8–10, 2020 | 800 (RV) | ± 3.4% | 35%[o] | 65% | – | – | – | – |
| Public Policy Polling | Mar 28–29, 2020 | 962 (RV) | – | 29% | 67% | – | – | – | 3% |
| AtlasIntel | Feb 24 – Mar 2, 2020 | 1,100 (RV) | ± 3.0% | 26% | 62% | – | – | 12% | – |
| YouGov | Feb 26–28, 2020 | 1,507 (RV) | – | 31% | 59% | – | – | 4% | 4% |
| CNN/SSRS | Feb 22–26, 2020 | 951 (RV) | ± 3.3% | 35% | 60% | – | – | 3%[p] | 3% |
| University of California Berkeley | Feb 20–25, 2020 | 5,526 (RV) | – | 31% | 58% | – | – | – | 11% |
| SurveyUSA | Feb 13–16, 2020 | 1,196 (RV) | ± 3.1% | 37% | 57% | – | – | – | 6% |
| YouGov/USC Price-Schwarzenegger Institute | Feb 1–15, 2020 | 1,200 (RV) | ± 3.1% | 30% | 60% | – | – | – | 4% |
| SurveyUSA | Jan 14–16, 2020 | 1,967 (RV) | ± 2.8% | 35% | 59% | – | – | – | 6% |
| CNN/SSRS | Dec 4–8, 2019 | 1,011 (RV) | ± 3.4% | 36% | 56% | – | – | 3%[p] | 5% |
| SurveyUSA | Nov 20–22, 2019 | 2,039 (RV) | ± 2.4% | 32% | 59% | – | – | – | 9% |
| SurveyUSA | Oct 15–16, 2019 | 1,242 (RV) | ± 3.8% | 32% | 59% | – | – | – | 9% |
| Emerson College | Sep 13–16, 2019 | 830 (RV) | ± 3.3% | 36% | 64% | – | – | – | – |
| SurveyUSA | Sep 13–15, 2019 | 1,785 (RV) | ± 3.2% | 31% | 57% | – | – | – | 11% |
| SurveyUSA | Aug 1–5, 2019 | 2,184 (RV) | ± 2.7% | 27% | 61% | – | – | – | 12% |
| SurveyUSA | Mar 22–25, 2018 | 882 (RV) | ± 3.8% | 33% | 56% | – | – | – | 11% |
| show
Hypothetical polling |
|---|
Results[]
Biden won California with a smaller margin of victory than in 2016. Nevertheless, he performed well in most urban areas of the state. Biden is also the first candidate for any statewide race in California to receive over ten million votes.
| Party | Candidate | Votes | % | ±% | |
|---|---|---|---|---|---|
| Democratic | Joe Biden Kamala Harris |
11,110,250 | 63.48% | +1.75% | |
| Republican | Donald Trump Mike Pence |
6,006,429 | 34.32% | +2.70% | |
| Libertarian | Jo Jorgensen Spike Cohen |
187,895 | 1.07% | −2.30% | |
| Green | Howie Hawkins Angela Walker |
81,029 | 0.46% | −1.51% | |
| American Independent | Rocky De La Fuente Kanye West |
60,160 | 0.34% | N/A | |
| Peace and Freedom | Gloria La Riva Sunil Freeman |
51,037 | 0.29% | −0.18% | |
| Write-in | 4,081 (2605 for Brian T. Carroll)[42] | 0.01% | −0.28% | ||
| Total votes | 17,500,881 | 100% | |||
Results by county[]
| County | Joe Biden Democratic |
Donald Trump Republican |
Jo Jorgensen Libertarian |
Howie Hawkins Green |
Rocky De La Fuente American Independent |
Gloria La Riva Peace and Freedom |
Write-in votes | Total votes | |||||||
|---|---|---|---|---|---|---|---|---|---|---|---|---|---|---|---|
| % | # | % | # | % | # | % | # | % | # | % | # | % | # | ||
| Alameda | 79.83% | 617,659 | 17.62% | 136,309 | 0.81% | 6,295 | 0.60% | 4,664 | 0.31% | 2,399 | 0.33% | 2,538 | 0.51% | 3,889 | 773,753 |
| Alpine | 64.24% | 476 | 32.93% | 244 | 2.02% | 15 | 0.54% | 4 | 0.00% | 0 | 0.27% | 2 | 0.00% | 0 | 741 |
| Amador | 36.40% | 8,153 | 60.66% | 13,585 | 1.56% | 349 | 0.49% | 110 | 0.29% | 64 | 0.18% | 41 | 0.42% | 95 | 22,397 |
| Butte | 49.54% | 50,815 | 47.60% | 48,819 | 1.74% | 1,789 | 0.50% | 510 | 0.32% | 326 | 0.27% | 282 | 0.02% | 24 | 102,565 |
| Calaveras | 36.84% | 10,046 | 60.57% | 16,518 | 1.32% | 359 | 0.46% | 125 | 0.26% | 72 | 0.16% | 44 | 0.40% | 108 | 27,272 |
| Colusa | 40.69% | 3,239 | 57.27% | 4,559 | 1.02% | 81 | 0.31% | 25 | 0.38% | 30 | 0.34% | 27 | 0.00% | 0 | 7,961 |
| Contra Costa | 71.63% | 416,386 | 26.30% | 152,877 | 1.05% | 6,116 | 0.45% | 2,618 | 0.34% | 1,949 | 0.22% | 1,284 | 0.01% | 86 | 581,316 |
| Del Norte | 40.84% | 4,677 | 56.41% | 6,461 | 1.31% | 150 | 0.68% | 78 | 0.46% | 53 | 0.29% | 33 | 0.01% | 1 | 11,453 |
| El Dorado | 44.44% | 51,621 | 53.24% | 61,838 | 1.61% | 1,871 | 0.40% | 460 | 0.21% | 240 | 0.09% | 108 | 0.01% | 21 | 116,159 |
| Fresno | 52.90% | 193,025 | 45.07% | 164,464 | 1.10% | 4,031 | 0.40% | 1,474 | 0.31% | 1,147 | 0.18% | 668 | 0.03% | 108 | 364,917 |
| Glenn | 35.36% | 3,995 | 62.52% | 7,063 | 1.13% | 128 | 0.30% | 34 | 0.35% | 39 | 0.29% | 33 | 0.04% | 5 | 11,297 |
| Humboldt | 64.48% | 44,768 | 31.36% | 21,770 | 1.63% | 1,132 | 0.90% | 625 | 0.36% | 251 | 0.41% | 282 | 0.86% | 596 | 69,424 |
| Imperial | 61.11% | 34,678 | 36.74% | 20,847 | 0.69% | 390 | 0.41% | 234 | 0.51% | 291 | 0.49% | 278 | 0.04% | 25 | 56,743 |
| Inyo | 48.86% | 4,634 | 48.71% | 4,620 | 1.35% | 128 | 0.47% | 45 | 0.34% | 32 | 0.23% | 22 | 0.03% | 3 | 9,484 |
| Kern | 43.68% | 133,366 | 53.88% | 164,484 | 1.29% | 3,942 | 0.35% | 1,074 | 0.41% | 1,264 | 0.36% | 1,096 | 0.02% | 66 | 305,292 |
| Kings | 42.63% | 18,699 | 54.88% | 24,072 | 1.38% | 604 | 0.28% | 125 | 0.41% | 180 | 0.41% | 178 | 0.01% | 3 | 43,861 |
| Lake | 51.55% | 14,941 | 45.27% | 13,123 | 1.29% | 374 | 0.71% | 207 | 0.31% | 89 | 0.23% | 66 | 0.65% | 186 | 28,986 |
| Lassen | 23.24% | 2,799 | 74.47% | 8,970 | 1.17% | 141 | 0.26% | 31 | 0.22% | 26 | 0.15% | 18 | 0.50% | 60 | 12,045 |
| Los Angeles | 71.03% | 3,028,885 | 26.86% | 1,145,530 | 0.83% | 35,452 | 0.51% | 21,660 | 0.38% | 15,999 | 0.37% | 15,917 | 0.02% | 922 | 4,264,365 |
| Madera | 43.12% | 23,168 | 54.68% | 29,378 | 1.16% | 621 | 0.40% | 217 | 0.32% | 173 | 0.31% | 165 | 0.02% | 10 | 53,732 |
| Marin | 82.33% | 128,288 | 15.79% | 24,612 | 0.99% | 1,536 | 0.46% | 724 | 0.24% | 380 | 0.17% | 261 | 0.02% | 29 | 155,830 |
| Mariposa | 39.77% | 4,088 | 57.88% | 5,950 | 1.51% | 155 | 0.38% | 39 | 0.25% | 26 | 0.21% | 22 | 0.00% | 0 | 10,280 |
| Mendocino | 66.41% | 28,782 | 30.61% | 13,267 | 1.36% | 591 | 0.91% | 394 | 0.28% | 123 | 0.41% | 179 | 0.01% | 4 | 43,340 |
| Merced | 53.84% | 48,991 | 43.30% | 39,397 | 1.03% | 941 | 0.43% | 388 | 0.43% | 391 | 0.48% | 433 | 0.49% | 452 | 90,993 |
| Modoc | 26.33% | 1,150 | 71.19% | 3,109 | 0.89% | 39 | 0.34% | 15 | 0.30% | 13 | 0.27% | 12 | 0.66% | 29 | 4,367 |
| Mono | 59.56% | 4,013 | 37.30% | 2,513 | 1.87% | 126 | 0.62% | 42 | 0.37% | 25 | 0.27% | 18 | 0.01% | 1 | 6,738 |
| Monterey | 69.52% | 113,953 | 28.24% | 46,299 | 1.11% | 1,820 | 0.46% | 749 | 0.35% | 566 | 0.30% | 496 | 0.02% | 40 | 163,923 |
| Napa | 69.05% | 49,817 | 28.66% | 20,676 | 1.27% | 914 | 0.43% | 310 | 0.33% | 241 | 0.23% | 164 | 0.04% | 28 | 72,150 |
| Nevada | 55.76% | 36,359 | 41.07% | 26,779 | 1.41% | 919 | 0.53% | 345 | 0.29% | 189 | 0.23% | 147 | 0.70% | 464 | 65,202 |
| Orange | 53.48% | 814,009 | 44.44% | 676,498 | 1.14% | 17,325 | 0.38% | 5,819 | 0.30% | 4,642 | 0.23% | 3,432 | 0.02% | 388 | 1,522,113 |
| Placer | 45.46% | 106,869 | 52.10% | 122,488 | 1.68% | 3,948 | 0.33% | 779 | 0.25% | 593 | 0.14% | 340 | 0.03% | 67 | 235,084 |
| Plumas | 40.51% | 4,561 | 57.24% | 6,445 | 1.36% | 153 | 0.35% | 39 | 0.28% | 31 | 0.24% | 27 | 0.04% | 4 | 11,260 |
| Riverside | 52.98% | 528,340 | 45.04% | 449,144 | 1.00% | 9,970 | 0.34% | 3,372 | 0.34% | 3,392 | 0.28% | 2,789 | 0.01% | 149 | 997,156 |
| Sacramento | 61.36% | 440,808 | 36.11% | 259,405 | 1.36% | 9,770 | 0.45% | 3,254 | 0.37% | 2,630 | 0.34% | 2,423 | 0.02% | 150 | 718,440 |
| San Benito | 61.14% | 17,628 | 36.73% | 10,590 | 1.20% | 345 | 0.32% | 91 | 0.29% | 84 | 0.29% | 83 | 0.03% | 9 | 28,830 |
| San Bernardino | 54.20% | 455,859 | 43.54% | 366,257 | 1.05% | 8,791 | 0.43% | 3,619 | 0.40% | 3,355 | 0.36% | 3,050 | 0.02% | 199 | 841,130 |
| San Diego | 60.21% | 964,650 | 37.46% | 600,094 | 1.33% | 21,386 | 0.46% | 7,421 | 0.33% | 5,302 | 0.18% | 2,869 | 0.02% | 421 | 1,602,143 |
| San Francisco | 85.26% | 378,156 | 12.72% | 56,417 | 0.74% | 3,299 | 0.63% | 2,781 | 0.28% | 1,262 | 0.35% | 1,543 | 0.02% | 95 | 443,553 |
| San Joaquin | 55.61% | 161,137 | 41.79% | 121,098 | 1.01% | 2,929 | 0.37% | 1,064 | 0.43% | 1,251 | 0.33% | 964 | 0.46% | 1,338 | 289,781 |
| San Luis Obispo | 55.29% | 88,310 | 42.22% | 67,436 | 1.51% | 2,408 | 0.50% | 794 | 0.28% | 455 | 0.17% | 278 | 0.01% | 33 | 159,714 |
| San Mateo | 77.89% | 291,496 | 20.20% | 75,584 | 0.95% | 3,554 | 0.43% | 1,595 | 0.31% | 1,145 | 0.21% | 797 | 0.02% | 80 | 374,251 |
| Santa Barbara | 64.52% | 129,963 | 32.63% | 65,736 | 1.20% | 2,416 | 0.47% | 939 | 0.35% | 714 | 0.26% | 520 | 0.57% | 1,144 | 201,432 |
| Santa Clara | 72.64% | 617,967 | 25.23% | 214,612 | 1.07% | 9,131 | 0.47% | 4,040 | 0.31% | 2,623 | 0.25% | 2,149 | 0.03% | 219 | 850,741 |
| Santa Cruz | 78.44% | 114,246 | 18.49% | 26,937 | 1.17% | 1,704 | 0.73% | 1,062 | 0.30% | 434 | 0.28% | 413 | 0.59% | 853 | 145,649 |
| Shasta | 32.28% | 30,000 | 65.41% | 60,789 | 1.37% | 1,277 | 0.40% | 368 | 0.30% | 281 | 0.20% | 185 | 0.04% | 30 | 92,930 |
| Sierra | 37.49% | 730 | 58.65% | 1,142 | 1.39% | 27 | 0.67% | 13 | 0.62% | 12 | 0.31% | 6 | 0.87% | 17 | 1,947 |
| Siskiyou | 40.87% | 9,593 | 56.62% | 13,290 | 1.35% | 318 | 0.49% | 116 | 0.34% | 79 | 0.23% | 54 | 0.09% | 22 | 23,472 |
| Solano | 63.65% | 131,639 | 33.51% | 69,306 | 1.20% | 2,475 | 0.46% | 958 | 0.40% | 825 | 0.30% | 628 | 0.48% | 1,000 | 206,831 |
| Sonoma | 74.52% | 199,938 | 23.04% | 61,825 | 1.27% | 3,418 | 0.56% | 1,499 | 0.31% | 832 | 0.28% | 740 | 0.02% | 65 | 268,317 |
| Stanislaus | 49.00% | 105,841 | 48.22% | 104,145 | 1.15% | 2,494 | 0.34% | 742 | 0.43% | 926 | 0.34% | 728 | 0.52% | 1,111 | 215,987 |
| Sutter | 40.73% | 17,367 | 57.16% | 24,375 | 1.22% | 521 | 0.32% | 136 | 0.30% | 126 | 0.27% | 115 | 0.01% | 4 | 42,644 |
| Tehama | 31.02% | 8,911 | 66.62% | 19,141 | 1.40% | 403 | 0.31% | 90 | 0.39% | 111 | 0.23% | 65 | 0.03% | 10 | 28,731 |
| Trinity | 45.04% | 2,851 | 50.36% | 3,188 | 1.85% | 117 | 0.79% | 50 | 0.43% | 27 | 0.39% | 25 | 1.14% | 72 | 6,330 |
| Tulare | 45.00% | 66,105 | 52.82% | 77,579 | 1.02% | 1,498 | 0.33% | 483 | 0.43% | 632 | 0.36% | 535 | 0.04% | 53 | 146,885 |
| Tuolumne | 39.39% | 11,978 | 58.17% | 17,689 | 1.44% | 439 | 0.48% | 145 | 0.30% | 91 | 0.19% | 59 | 0.02% | 7 | 30,408 |
| Ventura | 59.45% | 251,388 | 38.36% | 162,207 | 1.20% | 5,069 | 0.42% | 1,766 | 0.30% | 1,278 | 0.23% | 990 | 0.02% | 127 | 422,825 |
| Yolo | 69.48% | 67,598 | 28.05% | 27,292 | 1.24% | 1,206 | 0.56% | 547 | 0.31% | 298 | 0.33% | 323 | 0.03% | 30 | 97,294 |
| Yuba | 37.69% | 11,230 | 59.32% | 17,676 | 1.71% | 510 | 0.42% | 124 | 0.51% | 153 | 0.32% | 94 | 0.03% | 9 | 29,796 |
By congressional district[]
Biden won 46 of the 53 congressional districts in California, including four that were flipped or held by Republicans in Congress.[43]
| District | Trump | Biden | Representative |
|---|---|---|---|
| 1st | 56.4% | 41.1% | Doug LaMalfa |
| 2nd | 23.9% | 73.7% | Jared Huffman |
| 3rd | 42.7% | 54.9% | John Garamendi |
| 4th | 53.7% | 44% | Tom McClintock |
| 5th | 25.3% | 72.5% | Mike Thompson |
| 6th | 27.2% | 70.3% | Doris Matsui |
| 7th | 41.9% | 55.7% | Ami Bera |
| 8th | 54.1% | 43.6% | Paul Cook |
| Jay Obernolte | |||
| 9th | 39.9% | 57.9% | Jerry McNerney |
| 10th | 47.4% | 50.3% | Josh Harder |
| 11th | 23.6% | 74.3% | Mark DeSaulnier |
| 12th | 11.9% | 86.1% | Nancy Pelosi |
| 13th | 9% | 88.9% | Barbara Lee |
| 14th | 20.5% | 77.7% | Jackie Speier |
| 15th | 26.4% | 71.5% | Eric Swalwell |
| 16th | 38.9% | 58.8% | Jim Costa |
| 17th | 25.6% | 72.5% | Ro Khanna |
| 18th | 21.3% | 76.4% | Anna Eshoo |
| 19th | 27.9% | 70% | Zoe Lofgren |
| 20th | 25% | 72.7% | Jimmy Panetta |
| 21st | 43.5% | 54.4% | TJ Cox |
| David Valadao | |||
| 22nd | 51.7% | 46.2% | Devin Nunes |
| 23rd | 57.1% | 40.5% | Kevin McCarthy |
| 24th | 36.9% | 60.7% | Salud Carbajal |
| 25th | 43.9% | 54% | Mike Garcia |
| 26th | 36.5% | 61.4% | Julia Brownley |
| 27th | 30.8% | 67.2% | Judy Chu |
| 28th | 27.2% | 70.9% | Adam Schiff |
| 29th | 23.7% | 74.1% | Tony Cárdenas |
| 30th | 29.4% | 68.7% | Brad Sherman |
| 31st | 38.9% | 58.8% | Pete Aguilar |
| 32nd | 32.8% | 65.2% | Grace Napolitano |
| 33rd | 29% | 69% | Ted Lieu |
| 34th | 16.9% | 80.8% | Jimmy Gomez |
| 35th | 32.6% | 65.1% | Norma Torres |
| 36th | 42.3% | 55.9% | Raul Ruiz |
| 37th | 13.8% | 84.3% | Karen Bass |
| 38th | 32.3% | 65.6% | Linda Sánchez |
| 39th | 44% | 54.1% | Gil Cisneros |
| Young Kim | |||
| 40th | 20.6% | 77.1% | Lucille Roybal-Allard |
| 41st | 36.1% | 61.7% | Mark Takano |
| 42nd | 52.7% | 45.4% | Ken Calvert |
| 43rd | 20.9% | 76.9% | Maxine Waters |
| 44th | 19.2% | 78.4% | Nanette Barragán |
| 45th | 43.3% | 54.6% | Katie Porter |
| 46th | 33.5% | 64.3% | Lou Correa |
| 47th | 35.3% | 62.5% | Alan Lowenthal |
| 48th | 48.3% | 49.7% | Harley Rouda |
| Michelle Steel | |||
| 49th | 42.5% | 55.2% | Mike Levin |
| 50th | 52.7% | 45% | Darrell Issa |
| 51st | 30.9% | 66.9% | Juan Vargas |
| 52nd | 34.2% | 63.4% | Scott Peters |
| 53rd | 30.9% | 67% | Susan Davis |
| Sara Jacobs |
Counties that flipped from Republican to Democratic[]
- Butte (largest municipality: Chico)
- Inyo (largest municipality: Bishop)
See also[]
- United States presidential elections in California
- 2020 California elections
- 2020 United States presidential election
- 2020 Democratic Party presidential primaries
- 2020 Republican Party presidential primaries
- 2020 Libertarian Party presidential primaries
- 2020 Green Party presidential primaries
- 2020 United States elections
Notes[]
- ^ The other five states were Florida, Hawaii, Illinois, Nevada, and New York, as well as Washington DC.
- ^ Jump up to: a b c Candidate withdrew after early voting started, but before the date of the election.
- ^ Calculated by taking the difference of 100% and all other candidates combined.
- ^ Jump up to: a b c d e f g h i j k l m n o p q r s t u v w x y z aa ab ac ad ae af ag ah ai aj Key:
A – all adults
RV – registered voters
LV – likely voters
V – unclear - ^ Jump up to: a b Overlapping sample with the previous SurveyMonkey/Axios poll, but more information available regarding sample size
- ^ "Someone else" with 4%
- ^ Jump up to: a b De La Fuente (A) and De La Riva (PSOL) with 0%
- ^ Jump up to: a b De La Fuente listed as Guerra
- ^ Jump up to: a b Would not vote with 1%; "Someone else" with no voters
- ^ "Another candidate" with 3%
- ^ "Another Third Party/Write-in" with 1%
- ^ "Someone else" with 3%
- ^ "Another Third Party/Write-in" with 2%
- ^ "Someone else" with 4%; would not vote with 2%
- ^ Including voters who lean towards a given candidate
- ^ Jump up to: a b c d Other with 0%; neither with 3%
- ^ "Other" with 3%; would not vote with 3%
- ^ Jump up to: a b c Other with 1%; neither with 3%
- ^ "Other" with 3%; would not vote with 2%
- ^ "Other" with 6%; would not vote with 4%
- ^ Jump up to: a b c Other with 0%; neither with 4%
- ^ "Other" with 5%; would not vote with 2%
- ^ "Other" with 5%; would not vote with 3%
References[]
- ^ https://elections.cdn.sos.ca.gov/sov/2020-general/sov/04-historical-voter-reg-participation.pdf
- ^ Kelly, Ben (August 13, 2018). "US elections key dates: When are the 2018 midterms and the 2020 presidential campaign?". The Independent. Archived from the original on January 3, 2019. Retrieved January 3, 2019.
- ^ "Distribution of Electoral Votes". National Archives and Records Administration. Archived from the original on January 9, 2019. Retrieved January 3, 2019.
- ^ "Texas Presidential Election Results". The New York Times. January 5, 2021. ISSN 0362-4331. Retrieved January 8, 2021.
- ^ "California 2020 President exit polls". www.cnn.com. Retrieved August 8, 2021.
- ^ WIKI