California's 41st congressional district
| California's 41st congressional district | |||
|---|---|---|---|
 California's 41st congressional district since January 3, 2013. | |||
| Representative |
| ||
| Population (2019) | 786,719 | ||
| Median household income | $69,984[1] | ||
| Ethnicity |
| ||
| Cook PVI | D+12[2] | ||
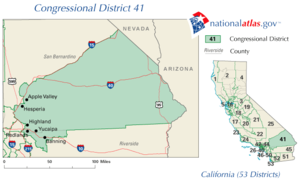
California's 41st congressional district is a congressional district in western Riverside County, in the U.S. state of California.
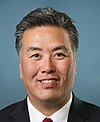
The district is currently represented by Democrat Mark Takano. It includes the cities of Moreno Valley, Perris, and Riverside, located in the Inland Empire region of Southern California.
Competitiveness[]
In statewide races[]
| Year | Office | Results |
|---|---|---|
| 1990 | Governor[3] | Wilson 54.9% - 39.5% |
| 1992 | President[4] | Bush 42.7% - 35.0% |
| Senator[5] | Herschensohn 55.7% - 34.8% | |
| Senator (Special)[6] | Seymour 48.5% - 42.8% | |
| 1994 | Governor[7] | Wilson 63.8% – 31.8% |
| Senator[8] | Huffington 57.0% – 33.2% | |
| 1996 | President[9] | Dole 46.6% – 43.3% |
| 1998 | Governor[10] | Davis 50.8% - 46.3% |
| Senator[11] | Fong 51.1% – 44.8% | |
| 2000 | President[12] | Bush 50.2% - 46.5% |
| Senator[13] | Feinstein 48.3% - 44.8% | |
| 2002 | Governor[14] | Simon 55.5% - 35.5% |
| 2003 | Recall[15][16] | |
| Schwarzenegger 64.0% - 17.1% | ||
| 2004 | President[17] | Bush 61.8% - 36.9% |
| Senator[18] | Jones 51.8% - 43.5% | |
| 2006 | Governor[19] | Schwarzenegger 68.6% - 26.6% |
| Senator[20] | Mountjoy 50.8% - 43.5% | |
| 2008 | President[21] | McCain 54.2% - 43.7% |
| 2010 | Governor[22] | Whitman 53.2% - 38.2% |
| Senator[23] | Fiorina 57.3% - 34.8% | |
| 2012 | President[24] | Obama 61.5% - 36.3% |
| Senator[25] | Feinstein 63.0% - 37.0% | |
| 2014 | Governor[26] | Brown 54.5% – 45.5% |
| 2016 | President[27] | Clinton 61.0% - 33.1% |
| Senator[28] | Harris 53.0% - 47.0% | |
| 2018 | Governor[29] | Newsom 59.4% - 40.6% |
| Senator[30] | Feinstein 51.9% - 48.1% | |
| 2020 | President[31] | Biden 61.7% - 36.1% |
List of members representing the district[]


Election results[]
|
1972 • 1974 • 1976 • 1978 • 1980 • 1982 • 1984 • 1986 • 1988 • 1990 • 1992 • 1994 • 1996 • 1998 • 2000 • 2002 • 2004 • 2006 • 2008 • 2010 • 2012 • 2014 • 2016 • 2018 • 2020 |
1972[]
| Party | Candidate | Votes | % | ||
|---|---|---|---|---|---|
| Democratic | Lionel Van Deerlin (Incumbent) | 115,634 | 74.1 | ||
| Republican | D. Richard "Dick" Kau | 40,514 | 25.9 | ||
| Total votes | 156,148 | 100.0 | |||
| Democratic win (new seat) | |||||
1974[]
| Party | Candidate | Votes | % | |
|---|---|---|---|---|
| Republican | Bob Wilson (Incumbent) | 93,461 | 54.5 | |
| Democratic | Colleen Marie O'Connor | 73,954 | 43.0 | |
| American Independent | Robert W. Franson | 4,312 | 2.5 | |
| Total votes | 171,727 | 100.0 | ||
| Republican hold | ||||
1976[]
| Party | Candidate | Votes | % | |
|---|---|---|---|---|
| Republican | Bob Wilson (Incumbent) | 128,784 | 57.7 | |
| Democratic | King Golden, Jr. | 94,590 | 42.3 | |
| Total votes | 223,374 | 100.0 | ||
| Republican hold | ||||
1978[]
| Party | Candidate | Votes | % | |
|---|---|---|---|---|
| Republican | Bob Wilson (Incumbent) | 107,685 | 58.1 | |
| Democratic | King Golden, Jr. | 77,540 | 41.9 | |
| Total votes | 185,225 | 100.0 | ||
| Republican hold | ||||
1980[]
| Party | Candidate | Votes | % | |
|---|---|---|---|---|
| Republican | Bill Lowery | 123,187 | 52.7 | |
| Democratic | Bob Wilson | 101,101 | 43.2 | |
| Libertarian | Joseph D. Alldredge | 9,630 | 4.1 | |
| Total votes | 233,918 | 100.0 | ||
| Republican hold | ||||
1982[]
| Party | Candidate | Votes | % | |
|---|---|---|---|---|
| Republican | Bill Lowery (Incumbent) | 140,130 | 68.9 | |
| Democratic | Tony Brandenburg | 58,677 | 28.8 | |
| Libertarian | Everett Hale | 4,654 | 2.3 | |
| Total votes | 203,461 | 100.0 | ||
| Republican hold | ||||
1984[]
| Party | Candidate | Votes | % | |
|---|---|---|---|---|
| Republican | Bill Lowery (Incumbent) | 161,068 | 63.5 | |
| Democratic | Bob Simmons | 85,475 | 33.7 | |
| Libertarian | Sara Baase | 7,303 | 2.8 | |
| Total votes | 253,846 | 100.0 | ||
| Republican hold | ||||
1986[]
| Party | Candidate | Votes | % | |
|---|---|---|---|---|
| Republican | Bill Lowery (Incumbent) | 133,566 | 67.8 | |
| Democratic | Daniel F. "Dan" Kripke | 59,816 | 30.4 | |
| Libertarian | Richard "Dick" Rider | 3,541 | 1.8 | |
| Total votes | 196,923 | 100.0 | ||
| Republican hold | ||||
1988[]
| Party | Candidate | Votes | % | |
|---|---|---|---|---|
| Republican | Bill Lowery (Incumbent) | 187,380 | 64.8 | |
| Democratic | Daniel F. "Dan" Kripke | 88,192 | 31.5 | |
| Libertarian | Richard "Dick" Rider | 5,336 | 1.9 | |
| Peace and Freedom | C. T. Weber | 4,853 | 1.8 | |
| Total votes | 285,761 | 100.0 | ||
| Republican hold | ||||
1990[]
| Party | Candidate | Votes | % | |
|---|---|---|---|---|
| Republican | Bill Lowery (Incumbent) | 105,723 | 49.2 | |
| Democratic | Daniel F. "Dan" Kripke | 93,586 | 43.6 | |
| Peace and Freedom | Karen S.R. Works | 15,428 | 7.2 | |
| Total votes | 214,737 | 100.0 | ||
| Republican hold | ||||
1992[]
| Party | Candidate | Votes | % | |
|---|---|---|---|---|
| Republican | Jay Kim (Incumbent) | 101,753 | 59.7 | |
| Democratic | Bob Baker | 58,777 | 34.4 | |
| Peace and Freedom | James Michael "Mike" Noonan | 10,136 | 5.9 | |
| Total votes | 170,666 | 100.0 | ||
| Republican hold | ||||
1994[]
| Party | Candidate | Votes | % | |
|---|---|---|---|---|
| Republican | Jay Kim (Incumbent) | 82,100 | 62.1 | |
| Democratic | Ed Tessier | 50,043 | 37.9 | |
| Total votes | 132,143 | 100.0 | ||
| Republican hold | ||||
1996[]
| Party | Candidate | Votes | % | |
|---|---|---|---|---|
| Republican | Jay Kim (Incumbent) | 83,934 | 58.5 | |
| Democratic | Richard Waldron | 47,346 | 33.0 | |
| Libertarian | Richard Newhouse | 7,135 | 5.0 | |
| Natural Law | David Kramer | 5,030 | 3.5 | |
| Republican | Marjorie Mikels (write-in) | 120 | 0.0 | |
| Total votes | 143,565 | 100.0 | ||
| Republican hold | ||||
1998[]
| Party | Candidate | Votes | % | |
|---|---|---|---|---|
| Republican | Gary Miller | 68,310 | 53.2 | |
| Democratic | Eileen R. Ansari | 52,264 | 40.7 | |
| Green | Cynthia Allaire | 3,597 | 2.8 | |
| Libertarian | Kenneth E. Valentine | 2,529 | 2.0 | |
| Natural Law | David F. Kramer | 1,714 | 1.3 | |
| Total votes | 128,414 | 100.0 | ||
| Republican hold | ||||
2000[]
| Party | Candidate | Votes | % | |
|---|---|---|---|---|
| Republican | Gary Miller (Incumbent) | 104,695 | 59.0 | |
| Democratic | Rodolfo G. Favila | 66,361 | 37.4 | |
| Natural Law | David Kramer | 6,607 | 3.6 | |
| Total votes | 177,616 | 100.0 | ||
| Republican hold | ||||
2002[]
| Party | Candidate | Votes | % | |
|---|---|---|---|---|
| Republican | Jerry Lewis (Incumbent) | 91,326 | 67.4 | |
| Democratic | Keith A. Johnson | 40,155 | 29.7 | |
| Libertarian | Kevin Craig | 4,052 | 2.9 | |
| Total votes | 135,533 | 100.0 | ||
| Republican hold | ||||
2004[]
| Party | Candidate | Votes | % | |
|---|---|---|---|---|
| Republican | Jerry Lewis (Incumbent) | 181,605 | 83.0 | |
| Libertarian | Peymon Mottahedek | 37,332 | 17.0 | |
| Total votes | 218,937 | 100.0 | ||
| Republican hold | ||||
2006[]
| Party | Candidate | Votes | % | |
|---|---|---|---|---|
| Republican | Jerry Lewis (Incumbent) | 109,761 | 67.0 | |
| Democratic | Louie A. Contreras | 54,235 | 33.0 | |
| Independent | Carol Petersen (write-in) | 48 | 0.0 | |
| Total votes | 164,044 | 100.0 | ||
| Republican hold | ||||
2008[]
| Party | Candidate | Votes | % | |
|---|---|---|---|---|
| Republican | Jerry Lewis (Incumbent) | 159,486 | 61.7 | |
| Democratic | Tim Prince | 99,214 | 38.3 | |
| Total votes | 258,700 | 100.0 | ||
| Republican hold | ||||
2010[]
| Party | Candidate | Votes | % | |
|---|---|---|---|---|
| Republican | Jerry Lewis (Incumbent) | 127,857 | 63.3 | |
| Democratic | Pat Meagher | 74,394 | 36.7 | |
| Total votes | 202,251 | 100.0 | ||
| Republican hold | ||||
2012[]
| Party | Candidate | Votes | % | |
|---|---|---|---|---|
| Democratic | Mark Takano | 103,578 | 59.0 | |
| Republican | John Tavaglione | 72,074 | 41.0 | |
| Total votes | 175,652 | 100.0 | ||
| Democratic hold | ||||
2014[]
| Party | Candidate | Votes | % | |
|---|---|---|---|---|
| Democratic | Mark Takano (Incumbent) | 46,948 | 56.6 | |
| Republican | Steve Adams | 35,936 | 43.4 | |
| Total votes | 82,884 | 100.0 | ||
| Democratic hold | ||||
2016[]
| Party | Candidate | Votes | % | |
|---|---|---|---|---|
| Democratic | Mark Takano (Incumbent) | 128,164 | 65.0 | |
| Republican | Doug Shepherd | 69,159 | 35.0 | |
| Total votes | 197,323 | 100.0 | ||
| Democratic hold | ||||
2018[]
| Party | Candidate | Votes | % | |
|---|---|---|---|---|
| Democratic | Mark Takano (Incumbent) | 108,227 | 65.1 | |
| Republican | Aja Smith | 58,021 | 34.9 | |
| Total votes | 166,248 | 100.0 | ||
| Democratic hold | ||||
2020[]
| Party | Candidate | Votes | % | |
|---|---|---|---|---|
| Democratic | Mark Takano (Incumbent) | 167,938 | 64.0 | |
| Republican | Aja Smith | 94,289 | 36.0 | |
| Total votes | 262,227 | 100.0 | ||
| Democratic hold | ||||
Historical district boundaries[]
San Diego County[]
In the 1980s, the 41st congressional district was one of four that divided San Diego County, formerly located in the North County region. The district had been held for 12 years by Republican Bill Lowery and was considered the most Republican district in the San Diego area. The 41st district was renumbered as the California's 51st congressional district after the 1990 U.S. Census in which it became the Inland Empire's 51st.
San Bernardino County[]
From 2003 to 2013, the district included large portions of the cavernous San Bernardino County and a small portion of Riverside County. The district formerly represented parts of the Inland Empire region, San Bernardino Mountains, and Mojave Desert, stretching from portions of the city of San Bernardino north to the Nevada border and east to the Colorado River. Redlands was the largest city in that district; other cities included: Loma Linda, Yucaipa, Victorville, Barstow, Hesperia, Highland, Big Bear Lake and Needles.
See also[]
References[]
- ^ US Census
- ^ "Partisan Voting Index – Districts of the 115th Congress" (PDF). The Cook Political Report. April 7, 2017. Retrieved April 7, 2017.
- ^ Statement of Vote (1990 Governor)
- ^ Statement of Vote (1992 President)
- ^ Statement of Vote (1992 Senate)
- ^ Statement of Vote (1992 Senate)
- ^ Statement of Vote (1994 Governor)
- ^ Statement of Vote (1994 Senate)
- ^ Statement of Vote (1996 President)
- ^ Statement of Vote (1998 Governor) Archived September 29, 2011, at the Wayback Machine
- ^ Statement of Vote (1998 Senate) Archived September 29, 2011, at the Wayback Machine
- ^ Statement of Vote (2000 President)
- ^ Statement of Vote (2000 Senator)
- ^ Statement of Vote (2002 Governor)
- ^ Statement of Vote (2003 Recall Question)
- ^ Statement of Vote (2003 Governor)
- ^ Statement of Vote (2004 President)
- ^ Statement of Vote (2004 Senator)
- ^ Statement of Vote (2006 Governor)
- ^ Statement of Vote (2006 Senator)
- ^ Statement of Vote (2008 President)
- ^ Statement of Vote (2010 Governor)
- ^ Statement of Vote (2010 Senator)
- ^ Statement of Vote (2012 President)
- ^ Statement of Vote (2012 Senator)
- ^ Statement of Vote (2014 Governor)
- ^ Statement of Vote (2016 President)
- ^ Statement of Vote (2016 Senator)
- ^ Statement of Vote (2018 Governor)
- ^ Statement of Vote (2018 Senator)
- ^ https://www.dailykos.com/stories/2012/11/19/1163009/-Daily-Kos-Elections-presidential-results-by-congressional-district-for-the-2012-2008-elections
- ^ 1972 election results
- ^ 1974 election results
- ^ 1976 election results
- ^ 1978 election results
- ^ 1980 election results
- ^ 1982 election results
- ^ 1984 election results
- ^ 1986 election results
- ^ 1988 election results
- ^ 1990 election results
- ^ 1992 election results
- ^ 1994 election results
- ^ 1996 election results
- ^ 1998 election results
- ^ 2000 election results
- ^ 2002 election results
- ^ 2004 election results
- ^ 2006 election results
- ^ 2008 election results
- ^ 2010 election results
- ^ 2012 election results
- ^ 2014 election results
- ^ 2016 election results
- ^ 2018 election results
External links[]

- Congressional districts of California
- Political districts in Riverside County, California
- Government in Riverside, California
- Moreno Valley, California
- Perris, California
- Constituencies established in 1973
- 1973 establishments in California