U.S. House district for California
California's 24th congressional district California's 24th congressional district since January 3, 2013
Representative Population (2019) 737,443 Median household $76,308[1] Ethnicity Cook PVI D+10[2]
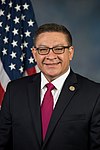
California's 24th congressional district is a congressional district in the U.S. state of California . The district is currently represented by Salud Carbajal . It contains all of Santa Barbara and San Luis Obispo counties and part of Ventura County .
Prior to redistricting in 2011, the district covered the inland portions of Ventura and Santa Barbara counties, as well as a sparsely-populated portion of the Ventura County coast.
Results in statewide elections [ ] List of members representing the district [ ]
Representatives from California's 24th congressional district
Member
Party
Dates
Congress
Electoral history
Counties
District created on January 3, 1953
Norris Poulson Republican
January 3, 1953 –
83rd
Redistricted from the 13th district re-elected in 1952 .Mayor of Los Angeles .
1953–1963 Los Angeles
Vacant
June 11, 1953 –
Glenard P. Lipscomb Republican
November 10, 1953 –
83rd 84th 85th 86th 87th 88th 89th 90th 91st
Elected to finish Poulson's term .Re-elected in 1954 .Re-elected in 1956 .Re-elected in 1958 .Re-elected in 1960 .Re-elected in 1962 .Re-elected in 1964 .Re-elected in 1966 .Re-elected in 1968 .
1967–1973 Los Angeles , southwestern San Bernardino
Vacant
February 1, 1970 –
91st
John H. Rousselot Republican
June 30, 1970 –
91st 92nd 93rd
Elected to finish Lipscomb's term .Re-elected later in 1970 .Re-elected in 1972 .26th district
1973–1983 Los Angeles
Henry Waxman Democratic
January 3, 1975 –
94th 95th 96th 97th 98th 99th 100th 101st 102nd
Elected in 1974 .Re-elected in 1976 .Re-elected in 1978 .Re-elected in 1980 .Re-elected in 1982 .Re-elected in 1984 .Re-elected in 1986 .Re-elected in 1988 .Re-elected in 1990 .29th district
1983–1993 Los Angeles (Hollywood )
Anthony C. Beilenson Democratic
January 3, 1993 –
103rd 104th
Redistricted from the 23rd district re-elected in 1992 .Re-elected in 1994 .
1993–2003 Los Angeles , southeastern Ventura (Thousand Oaks )
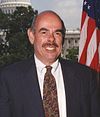
Brad Sherman Democratic
January 3, 1997 –
105th 106th 107th
Elected in 1996 .Re-elected in 1998 .Re-elected in 2000 .27th district
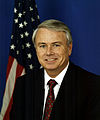
Elton Gallegly Republican
January 3, 2003 –
108th 109th 110th 111th 112th
Redistricted from the 23rd district re-elected in 2002 .Re-elected in 2004 .Re-elected in 2006 .Re-elected in 2008 .Re-elected in 2010 .
2003–2013 Santa Barbara , most of Ventura
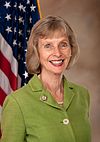
Lois Capps Democratic
January 3, 2013 –
113th 114th
Redistricted from the 23rd district re-elected in 2012 .Re-elected in 2014 .
2013–present Central Coast including San Luis Obispo and Santa Barbara
Salud Carbajal Democratic
January 3, 2017 –
115th 116th 117th
Elected in 2016 .Re-elected in 2018 .Re-elected in 2020 .
Election results [ ] 1952 [ ] 1953 (Special) [ ] Republican Glenard P. Lipscomb won the special election to replace fellow Republican Norris Poulson , who was elected Mayor of Los Angeles . Data for this special election is not available.[15]
1954 [ ]
United States House of Representatives elections, 1954 [16]
Party
Candidate
Votes
%
Republican Glenard P. Lipscomb (inc. ) 65,431
56.9
Democratic
George Arnold
49,592
43.1
Total votes
115,023
100.0
Turnout
Republican hold
1956 [ ]
United States House of Representatives elections, 1956 [17]
Party
Candidate
Votes
%
Republican Glenard P. Lipscomb (inc. ) 84,120
61.9
Democratic
Fay Porter
51,692
38.1
Total votes
135,812
100.0
Turnout
Republican hold
1958 [ ]
United States House of Representatives elections, 1958 [18]
Party
Candidate
Votes
%
Republican Glenard P. Lipscomb (inc. ) 68,184
56.4
Democratic
William H. Ware, Jr.
52,804
43.6
Total votes
120,988
100.0
Turnout
Republican hold
1960 [ ]
United States House of Representatives elections, 1960 [19]
Party
Candidate
Votes
%
Republican Glenard P. Lipscomb (inc. ) 82,497
59.7
Democratic
Norman Hass
55,613
40.3
Total votes
138,110
100.0
Turnout
Republican hold
1962 [ ]
United States House of Representatives elections, 1962 [20]
Party
Candidate
Votes
%
Republican Glenard P. Lipscomb (inc. ) 120,884
70.3
Democratic
Knox Mellon
50,970
29.7
Total votes
171,854
100.0
Turnout
Republican hold
1964 [ ]
United States House of Representatives elections, 1964 [21]
Party
Candidate
Votes
%
Republican Glenard P. Lipscomb (inc. ) 139,784
67.9
Democratic
Bryan W. Stevens
65,967
32.1
Total votes
205,751
100.0
Turnout
Republican hold
1966 [ ]
United States House of Representatives elections, 1966 [22]
Party
Candidate
Votes
%
Republican Glenard P. Lipscomb (inc. ) 148,190
76.3
Democratic
Earl G. McNall
46,115
23.7
Total votes
194,305
100.0
Turnout
Republican hold
1968 [ ]
United States House of Representatives elections, 1968 [23]
Party
Candidate
Votes
%
Republican Glenard P. Lipscomb (inc. ) 152,180
72.8
Democratic
Fred Warner Neal
56,723
27.2
Total votes
208,903
Republican hold
1970 (Special) [ ]
1970 special election[24]
Party
Candidate
Votes
%
Republican John H. Rousselot 62,749
68.2
Democratic
Myrlie B. Evers
29,248
31.8
Total votes
91,997
100.0
Turnout
Republican hold
1970 [ ] 1972 [ ]
United States House of Representatives elections, 1972 [26]
Party
Candidate
Votes
%
Republican John H. Rousselot (inc. ) 141,274
70.1
Democratic
Luther Mandell
60,170
29.9
Total votes
201,444
Republican hold
1974 [ ]
United States House of Representatives elections, 1974 [27]
Party
Candidate
Votes
%
Democratic Henry Waxman 85,343
64.0
Republican
Elliott Stone Graham
43,680
33.0
American Independent David E. Davis
3,980
3.0
Total votes
133,003
100.0
Turnout
Democratic hold
1976 [ ]
United States House of Representatives elections, 1976 [28]
Party
Candidate
Votes
%
Democratic Henry Waxman (incumbent ) 108,296
67.8
Republican
David Irvins Simmons
51,478
32.2
Total votes
159,774
100.0
Turnout
Democratic hold
1978 [ ]
United States House of Representatives elections, 1978 [29]
Party
Candidate
Votes
%
Democratic Henry Waxman (incumbent ) 85,075
62.7
Republican
Howard G. Schaefer
44,243
32.6
Peace and Freedom
Kevin Casey Peters
6,453
4.8
Total votes
135,771
100.0
Turnout
Democratic hold
1980 [ ] 1982 [ ]
United States House of Representatives elections, 1982 [31]
Party
Candidate
Votes
%
Democratic Henry Waxman (incumbent ) 88,516
65.1
Republican
Jerry Zerg
42,133
31.0
Libertarian
Jeff Mandel
5,420
1.8
Total votes
136,069
100.0
Turnout
Democratic hold
1984 [ ]
United States House of Representatives elections, 1984 [32]
Party
Candidate
Votes
%
Democratic Henry Waxman (incumbent ) 97,340
63.4
Republican
Jerry Zerg
51,010
33.2
Peace and Freedom
James Green
2,780
1.8
Libertarian
Tim Custer
2,477
1.6
Total votes
153,607
100.0
Turnout
Democratic hold
1986 [ ]
United States House of Representatives elections, 1986 [33]
Party
Candidate
Votes
%
Democratic Henry Waxman (incumbent ) 103,914
87.9
Libertarian
George Abrahams
8,871
7.5
Peace and Freedom
James Green
5,388
4.6
Total votes
118,173
100.0
Turnout
Democratic hold
1988 [ ]
United States House of Representatives elections, 1988 [34]
Party
Candidate
Votes
%
Democratic Henry Waxman (incumbent ) 112,038
72.2
Republican
John N. Cowles
36,835
23.8
Peace and Freedom
James Green
3,571
2.3
Libertarian
George Abrahams
2,627
1.7
Total votes
155,071
100.0
Turnout
Democratic hold
1990 [ ]
United States House of Representatives elections, 1990 [35]
Party
Candidate
Votes
%
Democratic Henry Waxman (incumbent ) 71,562
68.9
Republican
John N. Cowles
26,607
25.6
Peace and Freedom
Maggie Phair
5,706
5.5
Total votes
103,875
100.0
Turnout
Democratic hold
1992 [ ]
United States House of Representatives elections, 1992 [36]
Party
Candidate
Votes
%
Democratic Anthony C. Beilenson (inc. ) 141,742
55.5
Republican
Tom McClintock
99,835
39.1
Peace and Freedom
John Paul Lindblad
13,690
5.4
Total votes
255,267
100.0
Turnout
Democratic hold
1994 [ ]
United States House of Representatives elections, 1994 [37]
Party
Candidate
Votes
%
Democratic Anthony C. Beilenson (inc. ) 95,342
49.35
Republican
Rich Sybert
91,806
47.52
Libertarian
John C. Koehler
6,031
3.12
Total votes
193,179
100.0
Turnout
Democratic hold
1996 [ ]
United States House of Representatives elections, 1996 [38]
Party
Candidate
Votes
%
Democratic Brad Sherman 106,193
49.5
Republican
Rich Sybert
93,629
43.6
Peace and Freedom
Ralph Shroyer
6,267
2.9
Libertarian
Erich Miller
5,691
2.6
Natural Law
Ron Lawrence
3,068
1.4
Total votes
214,848
100.0
Turnout
Democratic hold
1998 [ ]
United States House of Representatives elections, 1998 [39]
Party
Candidate
Votes
%
Democratic Brad Sherman (incumbent ) 103,491
57.31
Republican
Randy Hoffman
69,501
38.49
Natural Law
Catherine Carter
3,033
1.68
Libertarian
Erich D. Miller
2,695
1.49
Peace and Freedom
Ralph Shroyer
1,860
1.03
Total votes
180,580
100.0
Turnout
Democratic hold
2000 [ ]
United States House of Representatives elections, 2000 [40]
Party
Candidate
Votes
%
Democratic Brad Sherman (incumbent ) 155,398
66.1
Republican
Jerry Doyle
70,169
29.8
Libertarian
Juan Carlos Ros
6,966
2.9
Natural Law
Michael Cuddehe
2,911
1.2
Total votes
235,444
100.0
Turnout
Democratic hold
2002 [ ]
United States House of Representatives elections, 2002 [41]
Party
Candidate
Votes
%
Republican Elton Gallegly (incumbent ) 120,585
65.2
Democratic
Fern Rudin
58,755
31.8
Libertarian
Gary Harber
5,666
3.0
Total votes
185,006
100.0
Turnout
Republican hold
2004 [ ]
United States House of Representatives elections, 2004 [42]
Party
Candidate
Votes
%
Republican Elton Gallegly (incumbent ) 178,660
62.9
Democratic
Brett Wagner
96,397
33.9
Green
Stuart A. Bechman
9,321
3.2
Total votes
284,378
100.0
Turnout
Republican hold
2006 [ ]
United States House of Representatives elections, 2006 [43]
Party
Candidate
Votes
%
Republican Elton Gallegly (incumbent ) 129,812
62.1
Democratic
79,461
37.9
No party
Michael Kurt Stettler (write-in )
16
0.0
No party
Henry Nicolle (write-in )
3
0.0
Total votes
209,292
100.0
Turnout
Republican hold
2008 [ ]
United States House of Representatives elections, 2008 [44]
Party
Candidate
Votes
%
Republican Elton Gallegly (incumbent ) 174,492
58.20
Democratic
Marta Ann Jorgensen
125,560
41.80
Turnout
Republican hold
2010 [ ]
United States House of Representatives elections, 2010 [46]
Party
Candidate
Votes
%
Republican Elton Gallegly (incumbent ) 144,055
59.94
Democratic
Timothy J. Allison
96,279
40.06
Turnout
Republican hold
2012 [ ]
California's 24th congressional district election, 2012
Primary election
Party
Candidate
Votes
%
Democratic
Lois Capps (incumbent )
72,356
46.4
Republican
Abel Maldonado
46,295
29.7
Republican
Chris Mitchum
33,604
21.5
No party preference
Matt Boutté
3,832
2.5
Total votes
156,087
100.0
General election
Democratic Lois Capps (incumbent ) 156,749
55.1
Republican
Abel Maldonado
127,746
44.9
Total votes
284,495
100.0
Democratic hold
2014 [ ] [49]
California's 24th congressional district election, 2014 [48]
Primary election
Party
Candidate
Votes
%
Democratic
Lois Capps (incumbent )
45,482
44.5
Republican
Christopher Mitchum
15,927
15.6
Republican
Justin Donald Fareed
15,013
14.7
Republican
Dale Francisco
12,256
12.0
Republican
Bradley Allen
6,573
6.4
Democratic
Sandra J. Marshall-Eminger
3,675
3.6
Democratic
Paul H. Coyne, Jr.
1,753
1.7
No party preference
Steve Isakson
947
0.9
Republican
Alexis Stuart
527
0.5
Total votes
102,153
100.00
General election
Democratic Lois Capps (incumbent ) 103,228
52%
Republican
Christopher Mitchum
95,566
48%
Total votes
198,794
100%
Democratic hold
2016 [ ]
California's 24th congressional district
Primary election
Party
Candidate
Votes
%
Democratic
Salud Carbajal
66,402
31.9
Republican
Justin Fareed
42,521
20.5
Republican
Katcho Achadjian
37,716
18.1
Democratic
Helene Schneider
31,046
14.9
Democratic
William "Bill" Ostrander
12,657
6.1
Republican
Matt T. Kokkonen
11,636
5.6
No party preference
John Uebersax
2,188
1.1
No party preference
Steve Isakson
2,172
1.0
Democratic
Benjamin Lucas
1,568
0.8
Total votes
207,906
100.0
General election
Democratic Salud Carbajal 166,034
53.4
Republican
Justin Fareed
144,780
46.6
Total votes
310,814
100.0
Democratic hold
2018 [ ]
California's 24th congressional district
Primary election
Party
Candidate
Votes
%
Democratic
Salud Carbajal (incumbent )
94,558
53.6
Republican
Justin Fareed
64,177
36.4
Republican
Michael E. Woody
17,715
10.0
General election
Democratic Salud Carbajal (incumbent ) 166,550
58.6
Republican
Justin Fareed
117,881
41.4
Total votes
284,431
100.0
Democratic hold
2020 [ ]
2020 United States House of Representatives elections in California
Party
Candidate
Votes
%
Democratic
Salud Carbajal (incumbent)
139,973
57.8
Republican
Andy Caldwell
92,537
38.2
No party preference
Kenneth Young
9,650
4.0
Total votes
242,160
100.0
General election
Democratic Salud Carbajal (incumbent) 212,564
58.7
Republican
Andy Caldwell
149,781
41.3
Total votes
362,345
100.0
Democratic hold
See also [ ]
United States portal California portal
References [ ]
^ "My Congressional District" .^ "Partisan Voting Index – Districts of the 115th Congress" (PDF) . The Cook Political Report. April 7, 2017. Retrieved April 7, 2017 .^ Statement of Vote (2000 President) Archived 2011-05-20 at the Wayback Machine ^ Statement of Vote (2000 Senator) Archived 2011-05-20 at the Wayback Machine ^ Statement of Vote (2002 Governor) Archived 2010-11-11 at the Wayback Machine ^ Statement of Vote (2003 Recall Question) Archived 2011-05-20 at the Wayback Machine ^ Statement of Vote (2003 Governor) Archived 2011-05-20 at the Wayback Machine ^ Statement of Vote (2004 President) Archived 2011-05-20 at the Wayback Machine ^ Statement of Vote (2004 Senator) Archived 2011-08-10 at the Wayback Machine ^ Statement of Vote (2006 Governor) Archived 2011-08-10 at the Wayback Machine ^ Statement of Vote (2006 Senator) Archived 2011-08-10 at the Wayback Machine ^ (2008 Presidential election) Archived June 12, 2009, at the Wayback Machine ^ "Daily Kos Elections' presidential results by congressional district for 2016, 2012, and 2008" .^ 1952 election results ^ 1953 special election results ^ 1954 election results ^ 1956 election results ^ 1958 election results ^ 1960 election results ^ 1962 election results ^ 1964 election results ^ 1966 election results ^ 1968 election results ^ 1970 special election results ^ 1970 election results ^ 1972 election results ^ 1974 election results ^ 1976 election results ^ 1978 election results ^ 1980 election results ^ 1982 election results ^ 1984 election results ^ 1986 election results ^ 1988 election results ^ 1990 election results ^ 1992 election results ^ 1994 election results ^ 1996 election results ^ 1998 election results ^ 2000 election results ^ 2002 general election results Archived February 3, 2009, at the Wayback Machine ^ 2004 general election results [permanent dead link ^ 2006 general election results Archived November 27, 2008, at the Wayback Machine ^ STATISTICS OF THE PRESIDENTIAL AND CONGRESSIONAL ELECTION OF NOVEMBER 4, 2008 ^ Statement of Vote November 4, 2008, General Election Archived October 18, 2012, at the Wayback Machine ^ STATISTICS OF THE PRESIDENTIAL AND CONGRESSIONAL ELECTION OF NOVEMBER 2, 2010 ^ Statement of Vote November 2, 2010, General Election [permanent dead link ^ "Archived copy" . Archived from the original on November 17, 2016. Retrieved November 17, 2016 .CS1 maint: archived copy as title (link ) ^ U.S. House of Representatives District 24 - Districtwide Results
External links [ ] hide
The at-large seats only existed from 1850 to 1865 and from 1883 to 1885. See also
California's past and present representatives , senators , and delegations
Coordinates : 34°36′N 119°42′W / 34.6°N 119.7°W / 34.6; -119.7