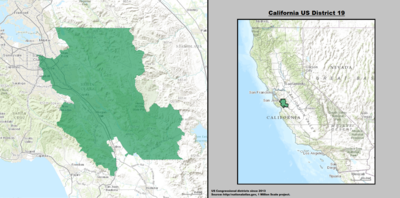
California's 19th congressional district
| California's 19th congressional district | |||
|---|---|---|---|
 California's 19th congressional district – since January 3, 2013. | |||
| Representative |
| ||
| Population (2019) | 737,535 | ||
| Median household income | $107,240[1] | ||
| Ethnicity |
| ||
| Cook PVI | D+23[2] | ||
California's 19th congressional district is a congressional district in the U.S. state of California, currently represented by Democrat Zoe Lofgren. The district covers much of Santa Clara County, including most of the city of San Jose.
Prior to redistricting in 2011, the district covered Mariposa and Tuolumne counties and parts of Fresno, Madera, and Stanislaus counties. As of 2012, the areas comprising the former 19th district were incorporated into 4th, 10th, 16th, 21st, and 22nd districts.
For much of the 20th century prior to the early 1990s, the district had encompassed areas to the south and much of Los Angeles County, California. Gradually it was redefined to take in central and northern counties instead.
Recent election results from statewide races[]
| Year | Office | Results |
|---|---|---|
| 1992 | U.S. President | GHW Bush 43.5 – 38.1% |
| U.S. Senator | Herschensohn 59.1 – 33.6% | |
| U.S. Senator | Seymour 51.5 – 41.7% | |
| 1994 | Governor | [data unknown/missing] |
| U.S. Senator | [data unknown/missing] | |
| 1996 | U.S. President | [data unknown/missing] |
| 1998 | Governor | [data unknown/missing] |
| U.S. Senator | [data unknown/missing] | |
| 2000 | U.S. President[3] | GW Bush 57.6 – 38.2% |
| U.S. Senator[4] | Feinstein 47.9 – 45.1% | |
| 2002 | Governor[5] | Simon 56.6 – 35.7% |
| 2003 | Recall[6][7] | Yes 67.9 – 32.1% |
| Schwarzenegger 52.8 – 23.1% | ||
| 2004 | U.S. President[8] | GW Bush 61.6 – 37.9% |
| U.S. Senator[9] | Jones 54.9 – 42.1% | |
| 2006 | Governor[10] | Schwarzenegger 69.3 – 26.6% |
| U.S. Senator[11] | Mountjoy 48.6 – 46.8% | |
| 2008 | U.S. President[12] | McCain 52.1 – 46.0% |
| 2010 | Governor | Whitman 54.8 – 39.6% |
| U.S. Senator | Fiorina 59.4 – 34.5% | |
| 2012 | U.S. President | Obama 71.2 – 26.5% |
| U.S. Senator | Feinstein 73.5 – 26.5% | |
| 2014 | Governor | Brown 73.4 – 26.6% |
| 2016 | U.S. President | H. Clinton 72.9 – 21.5% |
| U.S. Senator | Harris 59.1 – 40.1% | |
| 2018 | Governor | Newsom 70.3 – 29.7% |
| U.S. Senator | Feinstein 58.4 – 41.6% | |
| 2020 | U.S. President | Biden 70.0 – 27.9% |
List of members representing the district[]
| Member | Party | Dates | Cong ress |
Electoral history | Counties |
|---|---|---|---|---|---|
| District created on March 4, 1933 | |||||
 Sam L. Collins |
Republican | March 4, 1933 – January 3, 1937 |
73rd 74th |
Elected in 1932. Re-elected in 1934. Lost re-election. |
1933–1943 Orange, Riverside, San Bernardino |
 Harry R. Sheppard |
Democratic | January 3, 1937 – January 3, 1943 |
75th 76th 77th |
Elected in 1936. Re-elected in 1938. Re-elected in 1940. Redistricted to the 21st district. | |
 Chester E. Holifield |
Democratic | January 3, 1943 – December 31, 1974 |
78th 79th 80th 81st 82nd 83rd 84th 85th 86th 87th 88th 89th 90th 91st 92nd 93rd |
Elected in 1942. Re-elected in 1944. Re-elected in 1946. Re-elected in 1948. Re-elected in 1950. Re-elected in 1952. Re-elected in 1954. Re-elected in 1956. Re-elected in 1958. Re-elected in 1960. Re-elected in 1962. Re-elected in 1964. Re-elected in 1966. Re-elected in 1968. Re-elected in 1970. Re-elected in 1972. Retired and resigned early. |
1943–1975 Los Angeles |
| Vacant | December 31, 1974 – January 3, 1975 |
93rd | |||
 Robert J. Lagomarsino |
Republican | January 3, 1975 – January 3, 1993 |
94th 95th 96th 97th 98th 99th 100th 101st 102nd |
Redistricted from the 13th district and re-elected in 1974. Re-elected in 1976. Re-elected in 1978. Re-elected in 1980. Re-elected in 1982. Re-elected in 1984. Re-elected in 1986. Re-elected in 1988. Re-elected in 1990. Redistricted to the 22nd district and lost re-election. |
1975–1983 Southern San Luis Obispo, Santa Barbara, western Ventura |
| 1983–1993 Santa Barbara, Ventura | |||||
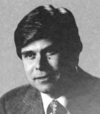 Richard H. Lehman |
Democratic | January 3, 1993 – January 3, 1995 |
103rd | Redistricted from the 18th district and re-elected in 1992. Lost re-election. |
1993–2003 Eastern Fresno, Madera, Mariposa, northern Tulare |
 George Radanovich |
Republican | January 3, 1995 – January 3, 2011 |
104th 105th 106th 107th 108th 109th 110th 111th |
Elected in 1994. Re-elected in 1996. Re-elected in 1998. Re-elected in 2000. Re-elected in 2002. Re-elected in 2004. Re-elected in 2006. Re-elected in 2008. Retired. | |
| 2003–2013 Northern Fresno, Mariposa, Madera, eastern Stanislaus, Tuolumne 
| |||||
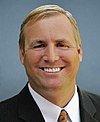 Jeff Denham |
Republican | January 3, 2011 – January 3, 2013 |
112th | Elected in 2010. Redistricted to the 10th district. | |
 Zoe Lofgren |
Democratic | January 3, 2013 – present |
113th 114th 115th 116th 117th |
Redistricted from the 16th district and re-elected in 2012. Re-elected in 2014. Re-elected in 2016. Re-elected in 2018. Re-elected in 2020. |
2013–present Santa Clara 
|
Election results[]
|
1932 • 1934 • 1936 • 1938 • 1940 • 1942 • 1944 • 1946 • 1948 • 1950 • 1952 • 1954 • 1956 • 1958 • 1960 • 1962 • 1964 • 1966 • 1968 • 1970 • 1972 • 1974 • 1976 • 1978 • 1980 • 1982 • 1984 • 1986 • 1988 �� 1990 • 1992 • 1994 • 1996 • 1998 • 2000 • 2002 • 2004 • 2006 • 2008 • 2010 • 2012 • 2014 • 2016 • 2018 • 2020 |
1932[]
| Party | Candidate | Votes | % | ||
|---|---|---|---|---|---|
| Republican | Sam L. Collins | 56,889 | 51.0 | ||
| Democratic | B. Z. McKinney | 51,796 | 46.4 | ||
| Liberty | Horatio S. Hoard | 2,873 | 2.6 | ||
| Total votes | 111,558 | 100.0 | |||
| Turnout | |||||
| Republican win (new seat) | |||||
1934[]
| Party | Candidate | Votes | % | |
|---|---|---|---|---|
| Republican | Sam L. Collins (Incumbent) | 97,119 | 88.8 | |
| No party | A. B. Hillabold (write-in) | 12,301 | 11.2 | |
| Total votes | 109,420 | 100.0 | ||
| Turnout | ||||
| Republican hold | ||||
1936[]
| Party | Candidate | Votes | % | |||
|---|---|---|---|---|---|---|
| Democratic | Harry R. Sheppard | 70,339 | 53.8 | |||
| Republican | Sam L. Collins (Incumbent) | 59,071 | 45.2 | |||
| Communist | Charles McLauchlan | 1,336 | 1.0 | |||
| Total votes | 130,746 | 100.0 | ||||
| Turnout | ||||||
| Democratic gain from Republican | ||||||
1938[]
| Party | Candidate | Votes | % | |
|---|---|---|---|---|
| Democratic | Harry R. Sheppard (Incumbent) | 75,819 | 53.3 | |
| Republican | C. T. Johnson | 66,402 | 46.7 | |
| Total votes | 142,221 | 100.0 | ||
| Turnout | ||||
| Democratic hold | ||||
1940[]
| Party | Candidate | Votes | % | |
|---|---|---|---|---|
| Democratic | Harry R. Sheppard (Incumbent) | 84,931 | 52.9 | |
| Republican | Lotus H. Loudon | 75,495 | 47.1 | |
| Total votes | 160,426 | 100.0 | ||
| Turnout | ||||
| Democratic hold | ||||
1942[]
| Party | Candidate | Votes | % | ||
|---|---|---|---|---|---|
| Democratic | Chet Holifield | 34,918 | 63.1 | ||
| Republican | Carlton H. Casjens | 20,446 | 36.9 | ||
| Total votes | 55,374 | 100.0 | |||
| Turnout | |||||
| Democratic win (new seat) | |||||
1944[]
| Party | Candidate | Votes | % | |
|---|---|---|---|---|
| Democratic | Chet Holifield (Incumbent) | 65,758 | 71.8 | |
| Republican | Carlton H. Casjens | 25,852 | 28.2 | |
| Total votes | 91,610 | 100.0 | ||
| Turnout | ||||
| Democratic hold | ||||
1946[]
| Party | Candidate | Votes | % | |
|---|---|---|---|---|
| Democratic | Chet Holifield (Incumbent) | 50,666 | 97.6 | |
| Independent | Marshall J. Morrill (write-in) | 1,248 | 2.4 | |
| Total votes | 51,914 | 100.0 | ||
| Turnout | ||||
| Democratic hold | ||||
1948[]
| Party | Candidate | Votes | % | |
|---|---|---|---|---|
| Democratic | Chet Holifield (Incumbent) | 72,900 | 69.7 | |
| Republican | Joseph Francis Quigley | 28,698 | 27.5 | |
| Progressive | Jacob Berman | 1,915 | 1.8 | |
| Independent | Myra Tanner Weiss | 1,013 | 1.0 | |
| Total votes | 104,526 | 100.0 | ||
| Turnout | ||||
| Democratic hold | ||||
1950[]
| Party | Candidate | Votes | % | |
|---|---|---|---|---|
| Democratic | Chet Holifield (Incumbent) | 73,317 | 90.9 | |
| Independent | Myra Tanner Weiss | 7,329 | 9.1 | |
| Total votes | 80,646 | 100.0 | ||
| Turnout | ||||
| Democratic hold | ||||
1952[]
| Party | Candidate | Votes | % | |
|---|---|---|---|---|
| Democratic | Chet Holifield (Incumbent) | 126,606 | 87.1 | |
| Progressive | Ida Alvarez | 13,724 | 9.4 | |
| Independent | Milton Snipper | 4,959 | 3.5 | |
| Total votes | 145,289 | 100.0 | ||
| Turnout | ||||
| Democratic hold | ||||
1954[]
| Party | Candidate | Votes | % | |
|---|---|---|---|---|
| Democratic | Chet Holifield (Incumbent) | 90,269 | 74.8 | |
| Republican | Raymond R. Pritchard | 30,404 | 25.2 | |
| Total votes | 120,673 | 100.0 | ||
| Turnout | ||||
| Democratic hold | ||||
1956[]
| Party | Candidate | Votes | % | |
|---|---|---|---|---|
| Democratic | Chet Holifield (Incumbent) | 116,287 | 73.8 | |
| Republican | Roy E. Reynolds | 41,269 | 26.2 | |
| Total votes | 157,556 | 100.0 | ||
| Turnout | ||||
| Democratic hold | ||||
1958[]
| Party | Candidate | Votes | % | |
|---|---|---|---|---|
| Democratic | Chet Holifield (Incumbent) | 131,421 | 75.3 | |
| Republican | Roy E. Reynolds | 26,092 | 24.7 | |
| Total votes | 157,513 | 100.0 | ||
| Turnout | ||||
| Democratic hold | ||||
1960[]
| Party | Candidate | Votes | % | |
|---|---|---|---|---|
| Democratic | Chet Holifield (Incumbent) | 145,479 | 78.2 | |
| Republican | Gordon S. McWilliams | 40,491 | 21.8 | |
| Total votes | 185,970 | 100.0 | ||
| Turnout | ||||
| Democratic hold | ||||
1962[]
| Party | Candidate | Votes | % | |
|---|---|---|---|---|
| Democratic | Chet Holifield (Incumbent) | 78,436 | 61.6 | |
| Republican | Robert T. Ramsay | 48,976 | 38.4 | |
| Total votes | 127,412 | 100.0 | ||
| Turnout | ||||
| Democratic hold | ||||
1964[]
| Party | Candidate | Votes | % | |
|---|---|---|---|---|
| Democratic | Chet Holifield (Incumbent) | 97,934 | 65.4 | |
| Republican | C. Everett Hunt | 51,747 | 34.6 | |
| Total votes | 149,681 | 100.0 | ||
| Turnout | ||||
| Democratic hold | ||||
1966[]
| Party | Candidate | Votes | % | |
|---|---|---|---|---|
| Democratic | Chet Holifield (Incumbent) | 82,592 | 62.3 | |
| Republican | William R. Sutton | 50,068 | 37.7 | |
| Total votes | 132,660 | 100.0 | ||
| Turnout | ||||
| Democratic hold | ||||
1968[]
| Party | Candidate | Votes | % | |
|---|---|---|---|---|
| Democratic | Chet Holifield (Incumbent) | 96,857 | 63.2 | |
| Republican | Bill Jones | 52,284 | 34.1 | |
| American Independent | Wayne L. Cook | 3,996 | 2.6 | |
| Total votes | 153,137 | 100.0 | ||
| Turnout | ||||
| Democratic hold | ||||
1970[]
| Party | Candidate | Votes | % | |
|---|---|---|---|---|
| Democratic | Chet Holifield (Incumbent) | 98,578 | 70.4 | |
| Republican | Bill Jones | 41,462 | 29.6 | |
| Total votes | 140,040 | 100.0 | ||
| Turnout | ||||
| Democratic hold | ||||
1972[]
| Party | Candidate | Votes | % | |
|---|---|---|---|---|
| Democratic | Chet Holifield (Incumbent) | 103,823 | 67.2 | |
| Republican | Kenneth M. Fisher | 43,034 | 27.9 | |
| Peace and Freedom | Joe Harris | 7,588 | 4.9 | |
| Total votes | 154,445 | 100.0 | ||
| Turnout | ||||
| Democratic hold | ||||
1974[]
| Party | Candidate | Votes | % | |
|---|---|---|---|---|
| Republican | Robert J. Lagomarsino (Incumbent) | 84,849 | 56.3 | |
| Democratic | James D. Loebl | 65,334 | 43.7 | |
| Total votes | 150,183 | 100.0 | ||
| Turnout | ||||
| Republican hold | ||||
1976[]
| Party | Candidate | Votes | % | |
|---|---|---|---|---|
| Republican | Robert J. Lagomarsino (Incumbent) | 124,201 | 64.4 | |
| Democratic | Dan Sisson | 68,722 | 35.6 | |
| Total votes | 192,923 | 100.0 | ||
| Turnout | ||||
| Republican hold | ||||
1978[]
| Party | Candidate | Votes | % | |
|---|---|---|---|---|
| Republican | Robert J. Lagomarsino (Incumbent) | 123,192 | 71.7 | |
| Democratic | Jerry Zamos | 41,672 | 24.3 | |
| Peace and Freedom | Milton Shiro Takei | 6,887 | 4.0 | |
| Total votes | 171,751 | 100.0 | ||
| Turnout | ||||
| Republican hold | ||||
1980[]
| Party | Candidate | Votes | % | |
|---|---|---|---|---|
| Republican | Robert J. Lagomarsino (Incumbent) | 162,849 | 77.7 | |
| Democratic | Carmen Lodise | 36,990 | 17.6 | |
| Libertarian | Jim Trotter | 9,764 | 4.7 | |
| Total votes | 209,603 | 100.0 | ||
| Turnout | ||||
| Republican hold | ||||
1982[]
| Party | Candidate | Votes | % | |
|---|---|---|---|---|
| Republican | Robert J. Lagomarsino (Incumbent) | 112,486 | 61.1 | |
| Democratic | Frank Frost | 66,042 | 35.8 | |
| Libertarian | R. C. Gordon-McCutchan | 4,198 | 2.3 | |
| Peace and Freedom | Charles J. Zekan | 1,520 | 0.8 | |
| Total votes | 184,246 | 100.0 | ||
| Turnout | ||||
| Republican hold | ||||
1984[]
| Party | Candidate | Votes | % | |
|---|---|---|---|---|
| Republican | Robert J. Lagomarsino (Incumbent) | 153,187 | 67.3 | |
| Democratic | James C. Carey Jr. | 70,278 | 30.9 | |
| Peace and Freedom | Charles J. Zekan | 4,161 | 1.8 | |
| Total votes | 227,626 | 100.0 | ||
| Turnout | ||||
| Republican hold | ||||
1986[]
| Party | Candidate | Votes | % | |
|---|---|---|---|---|
| Republican | Robert J. Lagomarsino (Incumbent) | 122,578 | 71.9 | |
| Democratic | Wayne B. Norris | 45,619 | 26.8 | |
| Libertarian | George Hasara | 2,341 | 1.4 | |
| Total votes | 170,538 | 100.0 | ||
| Turnout | ||||
| Republican hold | ||||
1988[]
| Party | Candidate | Votes | % | |
|---|---|---|---|---|
| Republican | Robert J. Lagomarsino (Incumbent) | 116,026 | 50.2 | |
| Democratic | Gary K. Hart | 112,033 | 48.5 | |
| Libertarian | Robert Donaldson | 2,865 | 1.2 | |
| Total votes | 230,924 | 100.0 | ||
| Turnout | ||||
| Republican hold | ||||
1990[]
| Party | Candidate | Votes | % | |
|---|---|---|---|---|
| Republican | Robert J. Lagomarsino (Incumbent) | 94,599 | 54.6 | |
| Democratic | Anita Perez Ferguson | 76,991 | 44.4 | |
| No party | Lorenz (write-in) | 1,655 | 1.0 | |
| Total votes | 173,235 | 100.0 | ||
| Turnout | ||||
| Republican hold | ||||
1992[]
| Party | Candidate | Votes | % | |
|---|---|---|---|---|
| Democratic | Richard H. Lehman (Incumbent) | 101,619 | 46.9 | |
| Republican | Tal L. Cloud | 100,590 | 46.4 | |
| Peace and Freedom | Dorothy L. Wells | 13,334 | 6.2 | |
| No party | Williams (write-in) | 1,097 | 0.5 | |
| Total votes | 216,640 | 100.0 | ||
| Turnout | ||||
| Democratic hold | ||||
1994[]
| Party | Candidate | Votes | % | |||
|---|---|---|---|---|---|---|
| Republican | George Radanovich | 104,435 | 56.78 | |||
| Democratic | Richard Lehman (Incumbent) | 72,912 | 39.64 | |||
| Libertarian | Dolores Comstock | 6,579 | 3.58 | |||
| Total votes | 183,926 | 100.0 | ||||
| Turnout | ||||||
| Republican gain from Democratic | ||||||
1996[]
| Party | Candidate | Votes | % | |
|---|---|---|---|---|
| Republican | George Radanovich (Incumbent) | 137,402 | 66.6 | |
| Democratic | Paul Barile | 58,452 | 28.4 | |
| Libertarian | Pamela Pescosolido | 6,083 | 2.9 | |
| Natural Law | David Adalian | 4,442 | 2.1 | |
| Total votes | 206,379 | 100.0 | ||
| Turnout | ||||
| Republican hold | ||||
1998[]
| Party | Candidate | Votes | % | |
|---|---|---|---|---|
| Republican | George Radanovich (Incumbent) | 131,105 | 79.39 | |
| Democratic | Paul Barile | 34,044 | 20.61 | |
| Total votes | 165,149 | 100.0 | ||
| Turnout | ||||
| Republican hold | ||||
2000[]
| Party | Candidate | Votes | % | |
|---|---|---|---|---|
| Republican | George Radanovich (Incumbent) | 144,517 | 65.0 | |
| Democratic | Dan Rosenberg | 70,578 | 31.8 | |
| Libertarian | Elizabeth Taylor | 4,264 | 1.9 | |
| Natural Law | Bob Miller | 1,990 | 0.8 | |
| American Independent | Edmon V. Kaiser | 1,266 | 0.5 | |
| Total votes | 222,615 | 100.0 | ||
| Turnout | ||||
| Republican hold | ||||
2002[]
| Party | Candidate | Votes | % | |
|---|---|---|---|---|
| Republican | George Radanovich (Incumbent) | 106,209 | 67.4 | |
| Democratic | John Veen | 47,403 | 30.0 | |
| Libertarian | Patrick Lee McHargue | 4,190 | 2.6 | |
| Total votes | 157,802 | 100.0 | ||
| Turnout | ||||
| Republican hold | ||||
2004[]
| Party | Candidate | Votes | % | |
|---|---|---|---|---|
| Republican | George Radanovich (Incumbent) | 155,354 | 66.1 | |
| Democratic | James Lex Bufford | 79,970 | 27.2 | |
| Green | Larry R. Mullen | 15,863 | 6.7 | |
| Total votes | 251,187 | 100.0 | ||
| Turnout | ||||
| Republican hold | ||||
2006[]
| Party | Candidate | Votes | % | |
|---|---|---|---|---|
| Republican | George Radanovich (Incumbent) | 110,246 | 60.6 | |
| Democratic | T.J. Cox | 71,748 | 39.4 | |
| Total votes | 181,994 | 100.0 | ||
| Turnout | ||||
| Republican hold | ||||
2008[]
| Party | Candidate | Votes | % | |
|---|---|---|---|---|
| Republican | George Radanovich (Incumbent) | 179,245 | 98.43 | |
| Democratic | Peter Leinau (write-in) | 2,490 | 1.37 | |
| Independent | Phil Rockey (write-in) | 366 | 0.20 | |
| Total votes | 182,101 | 100.00 | ||
| Turnout | 51.19 | |||
| Republican hold | ||||
2010[]
This election was the final election before 19th district was redrawn. Jeff Denham won his 2012 re-election as a representative of the 10th district.
| Party | Candidate | Votes | % | |
|---|---|---|---|---|
| Republican | Jeff Denham | 128,394 | 64.6 | |
| Democratic | Loraine Goodwin | 69,912 | 35.2 | |
| Democratic | Les Marsden (write-in) | 596 | 0.2 | |
| Total votes | 198,902 | 100.0 | ||
| Republican hold | ||||
2012[]
| Party | Candidate | Votes | % | |
|---|---|---|---|---|
| Democratic | Zoe Lofgren (Incumbent) | 162,300 | 73% | |
| Republican | Robert Murray | 59,313 | 27% | |
| Total votes | 221,613 | 100% | ||
| Democratic hold | ||||
2014[]
| Party | Candidate | Votes | % | |
|---|---|---|---|---|
| Democratic | Zoe Lofgren (Incumbent) | 85,888 | 67% | |
| Republican | Robert Murray | 41,900 | 33% | |
| Total votes | 127,788 | 100% | ||
| Democratic hold | ||||
2016[]
| Party | Candidate | Votes | % | |
|---|---|---|---|---|
| Democratic | Zoe Lofgren (Incumbent) | 181,802 | 74% | |
| Republican | G. Burt Lancaster | 64,061 | 26% | |
| Total votes | 245,863 | 100% | ||
| Democratic hold | ||||
2018[]
| Party | Candidate | Votes | % | |
|---|---|---|---|---|
| Democratic | Zoe Lofgren (Incumbent) | 162,496 | 74% | |
| Republican | Justin James Aguilera | 57,823 | 26% | |
| Total votes | 220,319 | 100% | ||
| Democratic hold | ||||
2020[]
| Party | Candidate | Votes | % | |
|---|---|---|---|---|
| Democratic | Zoe Lofgren (incumbent) | 224,385 | 71.7 | |
| Republican | Justin Aguilera | 88,642 | 28.3 | |
| Total votes | 313,027 | 100.0 | ||
| Democratic hold | ||||
See also[]
References[]
- ^ https://www.census.gov/mycd/?st=06&cd=19
- ^ "Partisan Voting Index – Districts of the 115th Congress" (PDF). The Cook Political Report. April 7, 2017. Retrieved April 7, 2017.
- ^ "Statement of Vote (2000 President)" (PDF). Archived from the original (PDF) on May 20, 2011. Retrieved September 17, 2008.
- ^ "Statement of Vote (2000 Senator)" (PDF). Archived from the original (PDF) on May 20, 2011. Retrieved September 17, 2008.
- ^ Statement of Vote (2002 Governor) Archived November 11, 2010, at the Wayback Machine
- ^ "Statement of Vote (2003 Recall Question)" (PDF). Archived from the original (PDF) on May 20, 2011. Retrieved October 8, 2007.
- ^ "Statement of Vote (2003 Governor)" (PDF). Archived from the original (PDF) on May 20, 2011. Retrieved October 8, 2007.
- ^ "Statement of Vote (2004 President)" (PDF). Archived from the original (PDF) on May 20, 2011. Retrieved August 8, 2007.
- ^ Statement of Vote (2004 Senator) Archived August 10, 2011, at the Wayback Machine
- ^ Statement of Vote (2006 Governor) Archived August 10, 2011, at the Wayback Machine
- ^ Statement of Vote (2006 Senator) Archived August 10, 2011, at the Wayback Machine
- ^ "(2008 President)". Archived from the original on February 11, 2009. Retrieved March 5, 2009.
- ^ 1932 election results
- ^ 1934 election results
- ^ 1936 election results
- ^ 1938 election results
- ^ 1940 election results
- ^ 1942 election results
- ^ 1944 election results
- ^ 1946 election results
- ^ 1948 election results
- ^ 1950 election results
- ^ 1952 election results
- ^ 1954 election results
- ^ 1956 election results
- ^ 1958 election results
- ^ 1960 election results
- ^ 1962 election results
- ^ 1964 election results
- ^ 1966 election results
- ^ 1968 election results
- ^ 1970 election results
- ^ 1972 election results
- ^ 1974 election results
- ^ 1976 election results
- ^ 1978 election results
- ^ 1980 election results
- ^ 1982 election results
- ^ 1984 election results
- ^ 1986 election results
- ^ 1988 election results
- ^ 1990 election results
- ^ 1992 election results
- ^ 1994 election results
- ^ 1996 election results
- ^ 1998 election results
- ^ 2000 election results
- ^ 2002 general election results Archived February 3, 2009, at the Wayback Machine
- ^ 2004 general election results Archived August 21, 2008, at the Wayback Machine
- ^ 2006 general election results Archived November 27, 2008, at the Wayback Machine
- ^ 2008 general election results Archived December 21, 2008, at the Wayback Machine
- ^ "2010 general election results" (PDF). Archived from the original (PDF) on May 20, 2011. Retrieved December 25, 2010.
- ^ 2012 general election results Archived October 19, 2013, at the Wayback Machine
- ^ "U.S. House of Representatives District 19 - Districtwide Results". Archived from the original on December 21, 2014. Retrieved December 21, 2014.
External links[]
- GovTrack.us: California's 19th congressional district
- RAND California Election Returns: District Definitions
- California Voter Foundation map - CD19
| Authority control |
|
|---|
Coordinates: 37°36′N 120°00′W / 37.6°N 120°W

- Congressional districts of California
- Government of Fresno County, California
- Government of Madera County, California
- Government of Mariposa County, California
- Government of Stanislaus County, California
- Government of Tuolumne County, California
- Constituencies established in 1933
- 1933 establishments in California