California's 18th congressional district
| California's 18th congressional district | |||
|---|---|---|---|
 California's 18th congressional district since January 3, 2013 | |||
| Representative |
| ||
| Population (2019) | 753,806 | ||
| Median household income | $149,375[1] | ||
| Ethnicity |
| ||
| Cook PVI | D+27[2] | ||
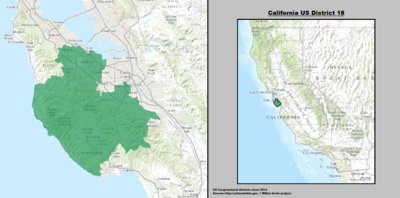
California's 18th congressional district is a congressional district located in the U.S. state of California.
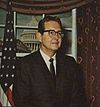
The district is currently represented by Democrat Anna Eshoo. It includes portions of Santa Clara, San Mateo, and Santa Cruz counties, extending from the southwestern San Francisco Bay Area through the Santa Cruz Mountains to the Pacific coast. Cities and CDPs in the district include Palo Alto, Stanford, Los Altos, Woodside, Mountain View, Los Altos Hills, Campbell, Saratoga, Los Gatos, and Scotts Valley; most of Menlo Park and Redwood City; and part of San Jose.
From 2003 to 2013, the district was located in the San Joaquin Valley. It included Merced County and portions of San Joaquin, Stanislaus, Madera, and Fresno counties. Cities in the district included Modesto, most of Stockton, Ceres, Atwater, Merced and Los Banos.
As of 2019, the district had a median household income of $149,375, higher than any other congressional district in the country.[3]
Recent election results from statewide races[]
| Year | Office | Results |
|---|---|---|
| 2012 | President[4] | Obama 68.2 – 28.9% |
| Senator[5] | Feinstein 71.6 – 28.4% | |
| 2014 | Governor[6] | Brown 71.6 – 28.4% |
| 2016 | President[7] | Clinton 73.4 – 20.2% |
| Senator[8] | Harris 73.8 – 26.2% | |
| 2018 | Governor[9] | Newsom 72.5 – 27.5% |
| Senator[10] | Feinstein 60.9 – 39.1% | |
| 2020 | President[11] | Biden 76.4 – 21.3% |
Election results from statewide races before 2012[]
| Year | Office | Results |
|---|---|---|
| 1992 | President | Clinton 40.9 – 37.3% |
| Senator | Herschensohn 46.6 – 43.1% | |
| Senator | Feinstein 49.0 – 42.6% | |
| 1994 | Governor | [data unknown/missing] |
| Senator | [data unknown/missing] | |
| 1996 | President | [data unknown/missing] |
| 1998 | Governor | [data unknown/missing] |
| Senator | [data unknown/missing] | |
| 2000 | President[12] | Bush 52.6 – 43.9% |
| Senator[13] | Feinstein 49.0 – 43.6% | |
| 2002 | Governor[14] | Davis 50.5 – 40.2% |
| 2003 | Recall[15][16] | Yes 57.9 – 42.1% |
| Schwarzenegger 44.1 – 33.4% | ||
| 2004 | President[17] | Bush 49.6 – 49.3% |
| Senator[18] | Boxer 56.5 – 39.2% | |
| 2006 | Governor[19] | Schwarzenegger 55.7 – 39.7% |
| Senator[20] | Feinstein 58.6 – 36.2% | |
| 2008 | President[21] | Obama 59.2 – 38.3% |
| 2010 | Governor[22] | Brown 52.3 – 40.9% |
| Senator[23] | Boxer 47.9 – 44.5% |
List of members representing the district[]
| Member | Party | Dates | Cong ress(es) |
Electoral history | Counties |
|---|---|---|---|---|---|
| District created on March 4, 1933 | |||||
| John H. Burke | Democratic | March 4, 1933 – January 3, 1935 |
73rd | Elected in 1932. Retired. |
1933–1963 Los Angeles County |
| Byron N. Scott | Democratic | January 3, 1935 – January 3, 1939 |
74th 75th |
Elected in 1934. Re-elected in 1936. Lost re-election. | |
 Thomas M. Eaton |
Republican | January 3, 1939 – September 16, 1939 |
76th | Elected in 1938. Died. | |
| Vacant | September 16, 1939 – January 3, 1941 | ||||
 William Ward Johnson |
Republican | January 3, 1941 – January 3, 1945 |
77th 78th |
Elected in 1940. Re-elected in 1942. Lost re-election. | |
 Clyde Doyle |
Democratic | January 3, 1945 – January 3, 1947 |
79th | Elected in 1944. Lost re-election. | |
 Willis W. Bradley |
Republican | January 3, 1947 – January 3, 1949 |
80th | Elected in 1946. Lost re-election. | |
Clyde Doyle |
Democratic | January 3, 1949 – January 3, 1953 |
81st 82nd |
Elected in 1948. Re-elected in 1950. Redistricted to the 23rd district. | |
 Craig Hosmer |
Republican | January 3, 1953 – January 3, 1963 |
83rd 84th 85th 86th 87th |
Elected in 1952. Re-elected in 1954. Re-elected in 1956. Re-elected in 1958. Re-elected in 1960. Redistricted to the 32nd district. | |
 Harlan Hagen |
Democratic | January 3, 1963 – January 3, 1967 |
88th 89th |
Redistricted from the 14th district and re-elected in 1962. Re-elected in 1964. Lost re-election. |
1963–1967 Kern County, Kings County, Tulare County |
 Bob Mathias |
Republican | January 3, 1967 – January 3, 1975 |
90th 91st 92nd 93rd |
Elected in 1966. Re-elected in 1968. Re-elected in 1970. Re-elected in 1972. Redistricted to the 17th district and lost re-election. |
1967–1973 Kern County, Tulare County |
| 1973–1975 Amador County, Calaveras County, Inyo County, Kern County (sliver in north), Madera County, Mariposa County, Mono County, Tulare County, Tuolumne County | |||||
 William M. Ketchum |
Republican | January 3, 1975 – June 24, 1978 |
94th 95th |
Redistricted from the 36th district and re-elected in 1974. Re-elected in 1976. Died. |
Inyo County, Kern County, northern Los Angeles County, Tulare County |
| Vacant | June 24, 1978 – January 3, 1979 |
95th | |||
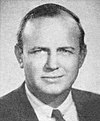
 Bill Thomas |
Republican | January 3, 1979 – January 3, 1983 |
96th 97th |
Elected in 1978. Re-elected in 1980. Redistricted to the 20th district. | |
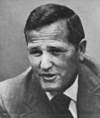
 Richard Lehman |
Democratic | January 3, 1983 – January 3, 1993 |
98th 99th 100th 101st 102nd |
Elected in 1982. Re-elected in 1984. Re-elected in 1986. Re-elected in 1988. Re-elected in 1990. Redistricted to the 19th district. |
1983–1993 Calaveras County, Fresno County (Fresno city), Madera County, Mono County, eastern San Joaquin County, Tuolumne County |
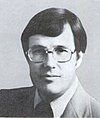
 Gary Condit |
Democratic | January 3, 1993 – January 3, 2003 |
103rd 104th 105th 106th 107th |
Redistricted from the 15th district and re-elected in 1992. Re-elected in 1994. Re-elected in 1996. Re-elected in 1998. Re-elected in 2000. Lost renomination. |
1993–2003 Northwestern Fresno County, western Madera County, Merced County, southwestern San Joaquin County, Stanislaus County |
 Dennis Cardoza |
Democratic | January 3, 2003 – August 14, 2012 |
108th 109th 110th 111th 112th |
Elected in 2002. Re-elected in 2004. Re-elected in 2006. Re-elected in 2008. Re-elected in 2010. Resigned to become a lobbyist. |
2003–2013 Small part of western Fresno County, Merced County, San Joaquin County (Stockton), western Stanislaus County |
| Vacant | August 14, 2012 – January 3, 2013 |
112th | |||
 Anna Eshoo |
Democratic | January 3, 2013 – present |
113th 114th 115th 116th 117th |
Redistricted from the 14th district and re-elected in 2012. Re-elected in 2014. Re-elected in 2016. Re-elected in 2018. Re-elected in 2020. |
2013–present Portions of San Mateo, Santa Clara, and Santa Cruz |
Election results[]
|
1932 • 1934 • 1936 • 1938 • 1940 • 1942 • 1944 • 1946 • 1948 • 1950 • 1952 • 1954 • 1956 • 1958 • 1960 • 1962 • 1964 • 1966 • 1968 • 1970 • 1972 • 1974 • 1976 • 1978 • 1980 • 1982 • 1984 • 1986 • 1988 • 1990 • 1992 • 1994 • 1996 • 1998 • 2000 • 2002 • 2004 • 2006 • 2008 • 2010 • 2012 • 2014 • 2016 • 2018 • 2020 |
1932[]
| Party | Candidate | Votes | % | ||
|---|---|---|---|---|---|
| Democratic | John H. Burke | 48,179 | 53.3 | ||
| Republican | Robert Henderson | 33,817 | 37.4 | ||
| Independent | William E. Hinshaw | 8,399 | 9.3 | ||
| Total votes | 90,395 | 100.0 | |||
| Turnout | |||||
| Democratic win (new seat) | |||||
1934[]
| Party | Candidate | Votes | % | |
|---|---|---|---|---|
| Democratic | Byron N. Scott | 52,377 | 56.3 | |
| Republican | William Brayton | 40,179 | 43.2 | |
| Communist | Clyde Champion | 507 | 0.5 | |
| Total votes | 93,063 | 100.0 | ||
| Turnout | ||||
| Democratic hold | ||||
1936[]
| Party | Candidate | Votes | % | |
|---|---|---|---|---|
| Democratic | Byron N. Scott (incumbent) | 61,415 | 59 | |
| Republican | James F. Collins | 42,748 | 41 | |
| Total votes | 134,163 | 100 | ||
| Turnout | ||||
| Democratic hold | ||||
1938[]
| Party | Candidate | Votes | % | |||
|---|---|---|---|---|---|---|
| Republican | Thomas M. Eaton | 52,216 | 48.6 | |||
| Democratic | Byron N. Scott (incumbent) | 51,874 | 48.3 | |||
| Progressive | Solomon Carr | 3,384 | 3.1 | |||
| Total votes | 107,474 | 100.0 | ||||
| Turnout | ||||||
| Republican gain from Democratic | ||||||
1940[]
| Party | Candidate | Votes | % | |
|---|---|---|---|---|
| Republican | William Ward Johnson (inc.) | 73,932 | 54.4 | |
| Democratic | Byron N. Scott | 60,764 | 44.7 | |
| Communist | George R. Ashby | 1,355 | 0.9 | |
| Total votes | 136,051 | 100.0 | ||
| Turnout | ||||
| Republican hold | ||||
1942[]
| Party | Candidate | Votes | % | |
|---|---|---|---|---|
| Republican | William Ward Johnson (inc.) | 53,136 | 56.8 | |
| Democratic | Francis H. Gentry | 40,339 | 43.2 | |
| Total votes | 93,475 | 100.0 | ||
| Turnout | ||||
| Republican hold | ||||
1944[]
| Party | Candidate | Votes | % | |||
|---|---|---|---|---|---|---|
| Democratic | Clyde Doyle | 95,090 | 55.7 | |||
| Republican | William Ward Johnson (inc.) | 75,749 | 44.3 | |||
| Total votes | 170,839 | 100.0 | ||||
| Turnout | ||||||
| Democratic gain from Republican | ||||||
1946[]
| Party | Candidate | Votes | % | |||
|---|---|---|---|---|---|---|
| Republican | Willis W. Bradley | 67,363 | 52.8 | |||
| Democratic | Clyde Doyle (incumbent) | 60,218 | 47.2 | |||
| Total votes | 127,581 | 100.0 | ||||
| Turnout | ||||||
| Republican gain from Democratic | ||||||
1948[]
| Party | Candidate | Votes | % | |||
|---|---|---|---|---|---|---|
| Democratic | Clyde Doyle | 105,687 | 51.1 | |||
| Republican | Willis W. Bradley (incumbent) | 92,721 | 44.9 | |||
| Progressive | Stanley Moffatt | 8,232 | 4.0 | |||
| Total votes | 206,640 | 100.0 | ||||
| Turnout | ||||||
| Democratic gain from Republican | ||||||
1950[]
| Party | Candidate | Votes | % | |
|---|---|---|---|---|
| Democratic | Clyde Doyle (incumbent) | 97,177 | 50.5 | |
| Republican | Craig Hosmer | 95,308 | 49.5 | |
| Total votes | 192,485 | 100.0 | ||
| Turnout | ||||
| Democratic hold | ||||
1952[]
| Party | Candidate | Votes | % | ||
|---|---|---|---|---|---|
| Republican | Craig Hosmer | 90,438 | 55.5 | ||
| Democratic | Joseph M. Kennick | 72,457 | 44.5 | ||
| Total votes | 162,895 | 100.0 | |||
| Turnout | |||||
| Republican win (new seat) | |||||
1954[]
| Party | Candidate | Votes | % | |
|---|---|---|---|---|
| Republican | Craig Hosmer (incumbent) | 71,731 | 55 | |
| Democratic | Joseph M. Kennick | 58,647 | 45 | |
| Total votes | 130,378 | 100 | ||
| Turnout | ||||
| Republican hold | ||||
1956[]
| Party | Candidate | Votes | % | |
|---|---|---|---|---|
| Republican | Craig Hosmer (incumbent) | 103,108 | 59.3 | |
| Democratic | Raymond C. "Ray" Simpson | 70,911 | 40.7 | |
| Total votes | 174,019 | 100.0 | ||
| Turnout | ||||
| Republican hold | ||||
1958[]
| Party | Candidate | Votes | % | |
|---|---|---|---|---|
| Republican | Craig Hosmer (incumbent) | 95,682 | 60 | |
| Democratic | Harry S. May | 63,684 | 40 | |
| Total votes | 159,366 | 100 | ||
| Turnout | ||||
| Republican hold | ||||
1960[]
| Party | Candidate | Votes | % | |
|---|---|---|---|---|
| Republican | Craig Hosmer (incumbent) | 129,851 | 70 | |
| Democratic | D. Patrick Ahern | 55,735 | 30 | |
| Total votes | 185,586 | 100 | ||
| Turnout | ||||
| Republican hold | ||||
1962[]
| Party | Candidate | Votes | % | |
|---|---|---|---|---|
| Democratic | Harlan Hagen (incumbent) | 91,684 | 58.9 | |
| Republican | G. Ray Arnett | 64,037 | 41.1 | |
| Total votes | 155,721 | 100.0 | ||
| Turnout | ||||
| Democratic hold | ||||
1964[]
| Party | Candidate | Votes | % | |
|---|---|---|---|---|
| Democratic | Harlan Hagen (incumbent) | 121,304 | 66.7 | |
| Republican | James E. Williams Jr. | 60,523 | 33.3 | |
| Total votes | 181,827 | 100.0 | ||
| Turnout | ||||
| Democratic hold | ||||
1966[]
| Party | Candidate | Votes | % | |||
|---|---|---|---|---|---|---|
| Republican | Bob Mathias | 96,699 | 55.9 | |||
| Democratic | Harlan Hagen (incumbent) | 76,346 | 44.1 | |||
| Total votes | 173,045 | 100.0 | ||||
| Turnout | ||||||
| Republican gain from Democratic | ||||||
1968[]
| Party | Candidate | Votes | % | |
|---|---|---|---|---|
| Republican | Bob Mathias (incumbent) | 100,008 | 65.2 | |
| Democratic | Harlan Hagen | 51,274 | 33.4 | |
| American Independent | Edward Calvin Williams | 2,186 | 1.4 | |
| Total votes | 153,468 | 100.0 | ||
| Turnout | ||||
| Republican hold | ||||
1970[]
| Party | Candidate | Votes | % | |
|---|---|---|---|---|
| Republican | Bob Mathias (incumbent) | 86,071 | 63.2 | |
| Democratic | Milton Spartacus Miller | 48,415 | 33.4 | |
| American Independent | Nora E. Hensley | 1,709 | 3.4 | |
| Total votes | 136,195 | 100.0 | ||
| Turnout | ||||
| Republican hold | ||||
1972[]
| Party | Candidate | Votes | % | |
|---|---|---|---|---|
| Republican | Bob Mathias (incumbent) | 109,993 | 66.5 | |
| Democratic | Vincent J. Lavery | 55,484 | 33.5 | |
| Total votes | 165,477 | 100.0 | ||
| Turnout | ||||
| Republican hold | ||||
1974[]
| Party | Candidate | Votes | % | |
|---|---|---|---|---|
| Republican | William M. Ketchum (inc.) | 66,603 | 52.7 | |
| Democratic | George A. Seielstad | 59,931 | 47.3 | |
| Total votes | 126,534 | 100.0 | ||
| Turnout | ||||
| Republican hold | ||||
1976[]
| Party | Candidate | Votes | % | |
|---|---|---|---|---|
| Republican | William M. Ketchum (inc.) | 101,658 | 64.2 | |
| Democratic | Dean Close | 56,683 | 35.8 | |
| Total votes | 158,341 | 100.0 | ||
| Turnout | ||||
| Republican hold | ||||
1978[]
| Party | Candidate | Votes | % | |
|---|---|---|---|---|
| Republican | Bill Thomas | 85,663 | 59.3 | |
| Democratic | Bob Sogge | 58,900 | 40.7 | |
| Total votes | 144,563 | 100.0 | ||
| Turnout | ||||
| Republican hold | ||||
1980[]
| Party | Candidate | Votes | % | |
|---|---|---|---|---|
| Republican | Bill Thomas (incumbent) | 126,046 | 71 | |
| Democratic | Mary Pat Timmermans | 51,415 | 29 | |
| Total votes | 177,461 | 100 | ||
| Turnout | ||||
| Republican hold | ||||
1982[]
| Party | Candidate | Votes | % | ||
|---|---|---|---|---|---|
| Democratic | Richard H. Lehman | 92,762 | 59.5 | ||
| Republican | Adrian C. Fondse | 59,664 | 38.3 | ||
| Libertarian | Marshall William Fritz | 3,501 | 2.2 | ||
| Total votes | 155,927 | 100.0 | |||
| Turnout | |||||
| Democratic win (new seat) | |||||
1984[]
| Party | Candidate | Votes | % | |
|---|---|---|---|---|
| Democratic | Richard H. Lehman (inc.) | 128,186 | 67.3 | |
| Republican | Dale L. Ewen | 62,339 | 32.7 | |
| Total votes | 190,525 | 100.0 | ||
| Turnout | ||||
| Democratic hold | ||||
1986[]
| Party | Candidate | Votes | % | |
|---|---|---|---|---|
| Democratic | Richard H. Lehman (inc.) | 101,480 | 71.3 | |
| Republican | David C. Crevelt | 40,907 | 28.7 | |
| Total votes | 142,387 | 100.0 | ||
| Turnout | ||||
| Democratic hold | ||||
1988[]
| Party | Candidate | Votes | % | |
|---|---|---|---|---|
| Democratic | Richard H. Lehman (inc.) | 125,715 | 69.9 | |
| Republican | David A. Linn | 54,034 | 30.1 | |
| Total votes | 179,749 | 100.0 | ||
| Turnout | ||||
| Democratic hold | ||||
1990[]
| Party | Candidate | Votes | % | |
|---|---|---|---|---|
| Democratic | Richard H. Lehman (inc.) | 98,804 | 100.0 | |
| Turnout | ||||
| Democratic hold | ||||
1992[]
| Party | Candidate | Votes | % | |
|---|---|---|---|---|
| Democratic | Gary Condit (incumbent) | 139,704 | 84.7 | |
| Libertarian | Kim R. Almstrom | 25,307 | 15.3 | |
| Total votes | 165,011 | 100.0 | ||
| Turnout | ||||
| Democratic hold | ||||
1994[]
| Party | Candidate | Votes | % | |
|---|---|---|---|---|
| Democratic | Gary Condit (incumbent) | 91,106 | 65.52 | |
| Republican | Tom Carter | 44,046 | 31.68 | |
| Libertarian | James B. Morzella | 3,902 | 2.81 | |
| Total votes | 139,054 | 100.0 | ||
| Turnout | ||||
| Democratic hold | ||||
1996[]
| Party | Candidate | Votes | % | |
|---|---|---|---|---|
| Democratic | Gary Condit (incumbent) | 108,827 | 65.8% | |
| Republican | Bill Conrad | 52,695 | 31.8% | |
| Libertarian | James Morzella | 2,233 | 1.3% | |
| Natural Law | Page Riskin | 1,831 | 1.1% | |
| Total votes | 165,586 | 100.0% | ||
| Turnout | ||||
| Democratic hold | ||||
1998[]
| Party | Candidate | Votes | % | |
|---|---|---|---|---|
| Democratic | Gary Condit (incumbent) | 118,842 | 86.79% | |
| Libertarian | Linda M. Degroat | 18,089 | 13.21% | |
| Total votes | 136,931 | 100.0% | ||
| Turnout | ||||
| Democratic hold | ||||
2000[]
| Party | Candidate | Votes | % | |
|---|---|---|---|---|
| Democratic | Gary Condit (incumbent) | 118,842 | 67.2% | |
| Republican | Steve R. Wilson | 56,465 | 31.3% | |
| Natural Law | Page Roth Riskin | 2,860 | 1.5% | |
| Total votes | 178,167 | 100.0% | ||
| Turnout | ||||
| Democratic hold | ||||
2002[]
| Party | Candidate | Votes | % | |
|---|---|---|---|---|
| Democratic | Dennis Cardoza | 56,181 | 51.3 | |
| Republican | Dick Monteith | 47,528 | 43.4 | |
| American Independent | Kevin H. Cripe | 3,641 | 3.3 | |
| Libertarian | Linda De Groat | 2,194 | 2.0 | |
| No party | Donna Crowder (write-in) | 49 | 0.0 | |
| Turnout | 109,593 | |||
| Democratic hold | ||||
2004[]
| Party | Candidate | Votes | % | |
|---|---|---|---|---|
| Democratic | Dennis Cardoza (incumbent) | 103,732 | 67.5 | |
| Republican | Charles F. Pringle Sr. | 49,973 | 32.5 | |
| Total votes | 153,705 | 100.0 | ||
| Turnout | ||||
| Democratic hold | ||||
2006[]
| Party | Candidate | Votes | % | |
|---|---|---|---|---|
| Democratic | Dennis Cardoza (incumbent) | 71,182 | 65.5 | |
| Republican | John A. Kanno | 37,531 | 34.5 | |
| Total votes | 108,713 | 100.0 | ||
| Turnout | ||||
| Democratic hold | ||||
2008[]
| Party | Candidate | Votes | % | |
|---|---|---|---|---|
| Democratic | Dennis Cardoza (incumbent) | 130,192 | 100.0 | |
| Total votes | 130,192 | 100.0 | ||
| Turnout | ||||
| Democratic hold | ||||
2010[]
| Party | Candidate | Votes | % | |
|---|---|---|---|---|
| Democratic | Dennis Cardoza (incumbent) | 72,853 | 58.48 | |
| Republican | Michael Clare Berryhill Sr. | 51,716 | 41.52 | |
| Total votes | 124,569 | 100.00 | ||
| Turnout | ||||
| Democratic hold | ||||
2012[]
| Party | Candidate | Votes | % | |
|---|---|---|---|---|
| Democratic | Anna Eshoo | 212,831 | 70.5 | |
| Republican | Dave Chapman | 89,103 | 29.5 | |
| Total votes | 301,934 | 100.0 | ||
| Democratic hold | ||||
2014[]
| Party | Candidate | Votes | % | |
|---|---|---|---|---|
| Democratic | Anna Eshoo (incumbent) | 133,060 | 68% | |
| Republican | Richard B. Fox | 63,326 | 32% | |
| Total votes | 196,386 | 100% | ||
| Democratic hold | ||||
2016[]
| Party | Candidate | Votes | % | |
|---|---|---|---|---|
| Democratic | Anna Eshoo (incumbent) | 230,460 | 71% | |
| Republican | Richard B. Fox | 93,470 | 29% | |
| Total votes | 323,930 | 100% | ||
| Democratic hold | ||||
2018[]
| Party | Candidate | Votes | % | |
|---|---|---|---|---|
| Democratic | Anna Eshoo (incumbent) | 225,142 | 74.5% | |
| Republican | Christine Russell | 77,096 | 25.5% | |
| Total votes | 302,238 | 100% | ||
| Democratic hold | ||||
2020[]
| Party | Candidate | Votes | % | |
|---|---|---|---|---|
| Democratic | Anna Eshoo (incumbent) | 217,377 | 63.2 | |
| Democratic | Rishi Kumar | 126,750 | 36.8 | |
| Total votes | 344,127 | 100.0 | ||
| Democratic hold | ||||
See also[]
References[]
- ^ https://www.census.gov/mycd/?st=06&cd=18
- ^ "Partisan Voting Index – Districts of the 115th Congress" (PDF). The Cook Political Report. April 7, 2017. Retrieved April 7, 2017.
- ^ https://www.census.gov/mycd/?st=06&cd=18
- ^ [1]
- ^ [2]
- ^ [3]
- ^ [4]
- ^ [5]
- ^ [6]
- ^ [7]
- ^ https://www.dailykos.com/stories/2012/11/19/1163009/-Daily-Kos-Elections-presidential-results-by-congressional-district-for-the-2012-2008-elections
- ^ "Statement of Vote (2000 President)" (PDF). Archived from the original (PDF) on May 20, 2011. Retrieved September 17, 2008.
- ^ "Statement of Vote (2000 Senator)" (PDF). Archived from the original (PDF) on May 20, 2011. Retrieved September 17, 2008.
- ^ Statement of Vote (2002 Governor) Archived November 11, 2010, at the Wayback Machine
- ^ "Statement of Vote (2003 Recall Question)" (PDF). Archived from the original (PDF) on May 20, 2011. Retrieved October 8, 2007.
- ^ "Statement of Vote (2003 Governor)" (PDF). Archived from the original (PDF) on May 20, 2011. Retrieved October 8, 2007.
- ^ "Statement of Vote (2004 President)" (PDF). Archived from the original (PDF) on May 20, 2011. Retrieved August 8, 2007.
- ^ Statement of Vote (2004 Senator) Archived August 10, 2011, at the Wayback Machine
- ^ Statement of Vote (2006 Governor) Archived August 10, 2011, at the Wayback Machine
- ^ Statement of Vote (2006 Senator) Archived August 10, 2011, at the Wayback Machine
- ^ "(2008 President)". Archived from the original on February 11, 2009. Retrieved March 5, 2009.
- ^ "Statement of Vote (2010 Governor)" (PDF). Archived from the original (PDF) on June 1, 2011. Retrieved July 27, 2011.
- ^ "Statement of Vote (2010 Senator)" (PDF). Archived from the original (PDF) on June 1, 2011. Retrieved July 27, 2011.
- ^ 1932 election results
- ^ 1934 election results
- ^ 1936 election results
- ^ 1938 election results
- ^ 1940 election results
- ^ 1942 election results
- ^ 1944 election results
- ^ 1946 election results
- ^ 1948 election results
- ^ 1950 election results
- ^ 1952 election results
- ^ 1954 election results
- ^ 1956 election results
- ^ 1958 election results
- ^ 1960 election results
- ^ 1962 election results
- ^ 1964 election results
- ^ 1966 election results
- ^ 1968 election results
- ^ 1970 election results
- ^ 1972 election results
- ^ 1974 election results
- ^ 1976 election results
- ^ 1978 election results
- ^ 1980 election results
- ^ 1982 election results
- ^ 1984 election results
- ^ 1986 election results
- ^ 1988 election results
- ^ 1990 election results
- ^ 1992 election results
- ^ 1994 election results
- ^ 1996 election results
- ^ 1998 election results
- ^ 2000 election results
- ^ 2002 general election results Archived February 3, 2009, at the Wayback Machine
- ^ 2004 general election results Archived August 21, 2008, at the Wayback Machine
- ^ 2006 general election results Archived November 27, 2008, at the Wayback Machine
- ^ 2008 general election results Archived December 21, 2008, at the Wayback Machine
- ^ 2010 general election results[permanent dead link]
- ^ 2012 general election results Archived October 19, 2013, at the Wayback Machine
- ^ "U.S. House of Representatives District 18 - Districtwide Results". Archived from the original on December 21, 2014. Retrieved December 21, 2014.
External links[]
- GovTrack.us: California's 18th congressional district
- RAND California Election Returns: District Definitions
- California Voter Foundation map - CD18
| Authority control |
|
|---|

- Congressional districts of California
- Government of San Mateo County, California
- Government of Santa Clara County, California
- Santa Cruz Mountains
- Silicon Valley
- Los Altos, California
- Los Gatos, California
- Mountain View, California
- Palo Alto, California
- Portola Valley, California
- Redwood City, California
- Sunnyvale, California
- San Jose, California
- Woodside, California
- Constituencies established in 1933
- 1933 establishments in California
- Government in the San Francisco Bay Area